Deposition measurements and critical loads calculations: monitoring data, results and perspective
iForest - Biogeosciences and Forestry, Volume 2, Issue 1, Pages 11-14 (2009)
doi: https://doi.org/10.3832/ifor0478-002
Published: Jan 21, 2009 - Copyright © 2009 SISEF
Research Articles
Collection/Special Issue: Cost Action E29 Meeting 2008 - Istanbul (Turkey)
Future Monitoring and Research Needs for Forest Ecosystems
Guest Editors: Marcus Schaub (WSL, Birmensdorf, CH)
Abstract
This paper presents the variation of sulphur and nitrogen deposition and the exceedance of their critical loads on Level II ICP Forests plots. The fact that critical loads are still exceeded at many forest sites in Europe indicates a continuing need for further implementation of air pollution abatement strategies. Such results contribute to the scientific basis for the development and reviews of the effectiveness of clean air politics by the Convention on Long-range Transboundary Air Pollution.
Keywords
Forest monitoring, Deposition, Nitrogen, Sulphur, Critical Loads
Introduction
Forest condition in Europe is assessed by the International Co-operative Programme on Assessment and Monitoring of Air Pollution Effects on Forests (ICP Forests). Established by the Convention on Long-range Transboundary Air Pollution (CLRTAP) under the United Nations Economic Commission for Europe (UNECE), ICP Forests has been monitoring forest condition in a close co-operation with the European Commission (EC) for 22 years. Large-scale variations of forest condition over space and time in relation to natural and anthropogenic factors are assessed on more than 6000 plots systematically spread across Europe. For studies of causal relationships about 860 intensive monitoring plots were installed covering the most important forest ecosystems in Europe. Intensive monitoring data were submitted for 774 of these plots in 2006. Intensive monitoring includes crown condition, phenology, litterfall, foliar chemistry, tree growth, soil condition and soil solution chemistry, deposition, ambient air quality, and meteorology. Risks of atmospheric nitrogen and sulphur deposition are assessed by means of calculations of critical loads and their exceedances. This article aims at the presentation of the variation of sulphur and nitrogen deposition and the exceedance of their critical loads on Level II plots. Such results contribute to the scientific basis for the development and reviews of the effectiveness of clean air politics by CLRTAP.
Summary of methods
The monitoring methods applied by ICP Forests are harmonised among its 40 participating countries ([4]). Bulk deposition is measured in the open field close to the Level II plots. Deposition under canopy is derived from throughfall measurements. For the present study, annual bulk and throughfall deposition of nitrate nitrogen (N-NO3-), ammonium nitrogen (N-NH4+), sulphate sulphur (S-SO42-), sodium (Na+), chlorine (Cl-) and calcium (Ca2+) were calculated as the arithmetic means of the yearly sums of the deposition in the years 2003 to 2005 for each Level II plot in kg ha-1 yr-1. Changes over time were calculated over the period 2000-2005. This period permitted the inclusion of a maximum number of plots under the aspect of data availability. With the years of assessment as predictor and annual deposition as target variable, linear trends over time were calculated for each plot.
Only plots were involved on which deposition had been measured continuously from 2000 to 2005, with maximally 30 days of measurements missing per year. Data of missing days were replaced by the average daily deposition of the respective year. Tab. 1 shows the numbers of included plots. The temporal variation of throughfall and bulk deposition of these three compounds was derived from annual arithmetic means over the respective plots. Depending on the pollutant and the form of deposition (bulk or throughfall) considered, between 185 and 249 plots were available.
Tab. 1 - Numbers of plots for which deposition data were available.
| Variation | Deposition | Na+ | Cl- | Ca2+ | N- NH4+ | N- NO3- | S- SO42- |
|---|---|---|---|---|---|---|---|
| Temporal (2000-2005) |
Bulk | 193 | 193 | 193 | 192 | 193 | 185 |
| Throughfall | 223 | 223 | 223 | 222 | 223 | 215 | |
| Spatial (2003-2005) |
Bulk | 216 | 216 | 216 | 216 | 216 | 216 |
| Throughfall | 249 | 249 | 249 | 249 | 249 | 249 |
It must be mentioned that measured throughfall underestimates total deposition. One reason is that total deposition comprises wet and dry deposition, but only part of the dry deposition is washed off the leaves and included in the throughfall. Moreover, throughfall measurements do not take into account canopy exchange in the sense of uptake and leaching of the leaves which is particularly pronounced for N. For the separation between internal circulation and deposition, models have been developed ([2]). Deviations between the modelled total deposition and throughfall measurements by ICP Forests were shown by De Vries et al. ([1]). Because of relatively high uncertainties of the models ([3]), throughfall measurements were left uncorrected for canopy exchange in the present study. In this respect it must also be mentioned that stem flow was not included in the analysis which may lead to an underestimation at least in beech forests.
Results and discussion
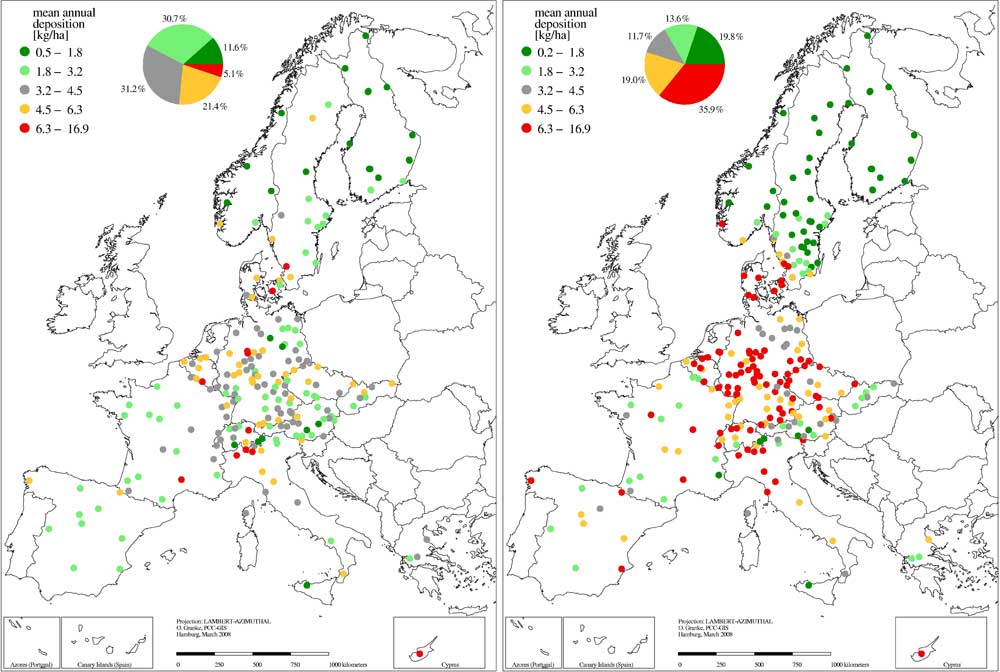
Throughfall deposition of nitrate (N-NO3-), ammonium (N-NH4+), and sulphate (S-SO42-) shows marked spatial patterns across Europe. For the majority of those plots on which both throughfall and bulk deposition were measured, throughfall deposition is clearly higher than bulk deposition, indicating dry deposition filtered from the air by the canopy and washed off the leaves.
Fig. 1 shows two maps for bulk deposition (left) and throughfall (right) of N-NO3- on the Level II plots involved in the study. Throughfall is clearly higher and its spatial pattern is more pronounced than that of bulk deposition: Throughfall ranges from 0.2 to 16.9 kg ha-1 yr-1. The plots with the highest throughfall (6.3 to 16.9 kg ha-1 yr-1) are largely situated in areas of high vehicle exhaust, namely central Germany, Belgium and northern Italy. In contrast, plots with lowest throughfall (0.2 to 1.8 kg ha-1 yr-1) are located mainly in northern Europe and in the Alps. In comparison to N-NO3 -, throughfall of N-NH4 + shows a similar spatial pattern (not shown). But plots with highest throughfall of N-NH4 + (7.5 to 23.8 kg ha-1 yr-1) are less frequent in central Germany and in northern Italy.
Fig. 1 - Bulk deposition (left) and throughfall (right) of N-NO3 - on the Level II plots involved in the study.
Throughfall of S-SO4 (not shown) ranges from 0.7 to 42.7 kg ha-1 yr-1. Plots with the highest throughfall ranging from 8.0 to 42.7 kg ha-1 yr-1 are particularly frequent in central Europe. Sulphate deposition was not corrected for sea salt contribution. On plots in coastal areas (e.g., in Belgium, Cyprus, Greece, Italy, south-western Norway, north-western Spain and in the United Kingdom) high sulphate deposition coincides with high sodium deposition, indicating sea salt as an origin. In the other regions the high deposition is likely to reflect regional emission situations. Similar to the nitrogen compounds, throughfall of S-SO42- is particularly low (0.7 to 3.3 kg ha-1 yr-1) in northern Europe and in the Alps.
Temporal variation of bulk deposition and throughfall of the analysed substances (not shown) revealed a year by year (except 2004) decrease for S-SO4 2-. From 2000 to 2005 bulk deposition decreased from 6.1 to 4.6 kg ha-1 yr-1 and throughfall decreased from 7.8 to 5.9 kg ha-1 yr-1. This time series is too short for the quantification of a trend, but previous studies by ICP Forests show that the decrease in sulphur deposition has been ongoing for a longer time than the six years’ period investigated in the present study ([6], [1]). It may therefore be stated that the results of ICP Forests give evidence of the reduction of sulphur emissions under CLRTAP politics over the last years and the less pronounced reduction of N emissions in Europe ([10]).
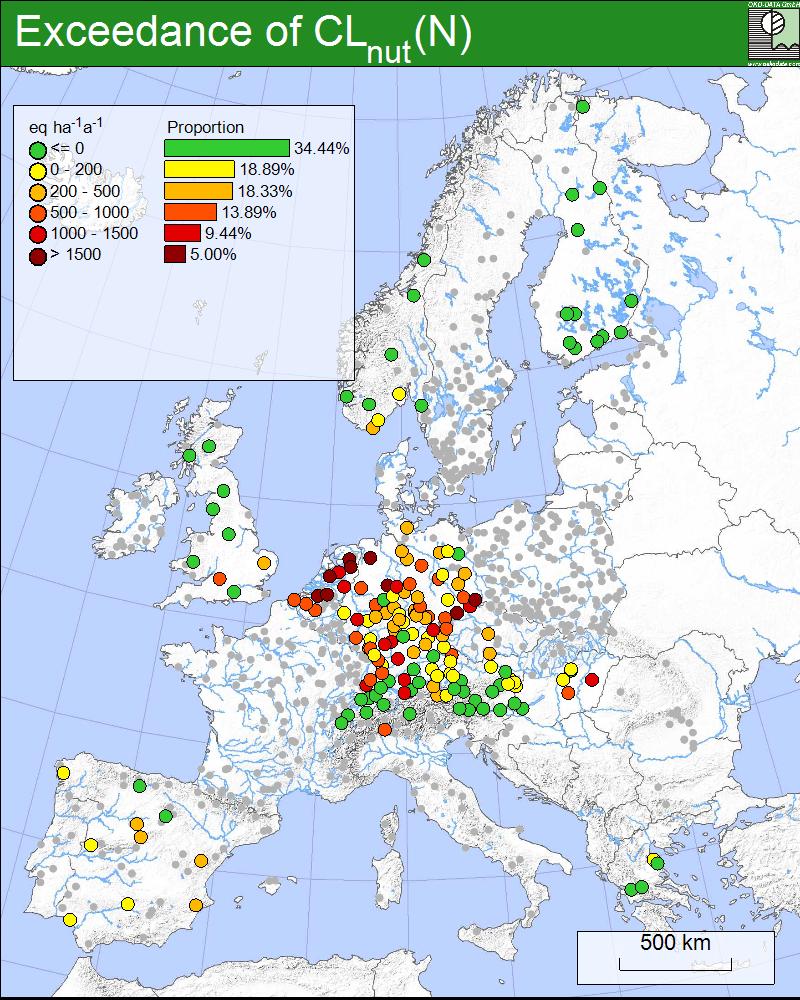
Mere deposition measurements do not permit any risk assessment for forest ecosystems. An approach for the assessment of the risk of forests damage by air pollution is the calculation of critical loads of deposition ([8], [9]) and the determination of their exceedances. Therefore, the deposition data from Level II plots were used in previous studies of ICP Forests for calculations of exceedances of critical loads for each pollutant ([7]). Results of these studies show that on the investigated Level II plots critical load exceedances are smaller for sulphur than for nitrogen. Throughfall exceeds the critical loads for nitrogen on about two thirds of the plots (Fig. 2). Highest exceedances are found in The Netherlands, Belgium and in several parts of Germany. Hardly any exceedances are found in the United Kingdom, in Fennoscandia, in Greece and in the Alps. In the United Kingdom and Greece this reflects the low nitrogen deposition on Level II plots ([5]). Even in Fennoscandia, where critical loads are notoriously low, there are little or no exceedances because of low nitrogen deposition. However, the high precipitation in the Alps and lower Alps causes high leaching yielding high critical loads and low exceedances, even if deposition is relatively high. This leads to the contradiction that low exceedances of critical loads for nitrogen deposition suggest a low risk on the one hand, while on the other hand high leaching of inorganic nitrogen constitutes a disturbance of the forest ecosystem. Critical loads for acidity were exceeded on less than a quarter of the plots. The plots are largely situated in The Netherlands, in southern Sweden, in several parts of Germany, and in Hungary.
Fig. 2 - Exceedances of critical loads for nitrogen assessed in 2004 ([7]).
The fact that critical loads are still exceeded at many forest sites in Europe indicates a continuing need for further implementation of air pollution abatement strategies. In order to improve the reliability of the results, the potential of improving the modelling of canopy ion exchange should be considered.
As regards forest ecosystem response to deposition, it must be noted that the exceedance of critical loads indicates only that a pollutant flux is reached which may after a certain time lead to the exceedance of a critical limit, i.e., to the exceedance of a pollutant concentration causing damage to the ecosystem. For the assessment of ecosystem response it is therefore crucial to know whether the critical limits are violated or not. Future studies of ICP Forests should therefore focus on violations of critical limits and their relationships with forest ecosystem response.
Acknowledgements
The data used for the described study were assessed and submitted within ICP Forests and under relevant EC Regulations by Austria, Belgium, Czech Republic, Denmark, Finland, France, Germany, Greece, Italy, Luxembourg, The Netherlands, Norway, Portugal, Slovakia, Spain, Sweden, Switzerland, and United Kingdom. Addresses of the National Focal Centres of ICP Forests are listed under ⇒ http://www.icp-forests.org.
References
Gscholar
Gscholar
Gscholar
Gscholar
Gscholar
Authors’ Info
Authors’ Affiliation
Corresponding author
Paper Info
Citation
Lorenz M, Granke O (2009). Deposition measurements and critical loads calculations: monitoring data, results and perspective. iForest 2: 11-14. - doi: 10.3832/ifor0478-002
Academic Editor
Marcus Schaub
Paper history
Received: Mar 13, 2008
Accepted: Dec 09, 2008
First online: Jan 21, 2009
Publication Date: Jan 21, 2009
Publication Time: 1.43 months
Copyright Information
© SISEF - The Italian Society of Silviculture and Forest Ecology 2009
Open Access
This article is distributed under the terms of the Creative Commons Attribution-Non Commercial 4.0 International (https://creativecommons.org/licenses/by-nc/4.0/), which permits unrestricted use, distribution, and reproduction in any medium, provided you give appropriate credit to the original author(s) and the source, provide a link to the Creative Commons license, and indicate if changes were made.

Web Metrics
Breakdown by View Type
Article Usage
Total Article Views: 51587
(from publication date up to now)
Breakdown by View Type
HTML Page Views: 41545
Abstract Page Views: 4106
PDF Downloads: 4691
Citation/Reference Downloads: 205
XML Downloads: 1040
Web Metrics
Days since publication: 6323
Overall contacts: 51587
Avg. contacts per week: 57.11
Article Citations
Article citations are based on data periodically collected from the Clarivate Web of Science web site
(last update: Mar 2025)
Total number of cites (since 2009): 16
Average cites per year: 0.94
Publication Metrics
by Dimensions ©
Articles citing this article
List of the papers citing this article based on CrossRef Cited-by.
Related Contents
iForest Similar Articles
Research Articles
Influence of pH, nitrogen and sulphur deposition on species composition of lowland and montane coniferous communities in the Tatrzanski and Slowinski National Parks, Poland
vol. 12, pp. 141-148 (online: 27 February 2019)
Commentaries & Perspectives
Clean air policy under the UNECE Convention on long-range transboundary air pollution: how are monitoring results “translated” to policy action
vol. 2, pp. 49-50 (online: 21 January 2009)
Editorials
Future monitoring and research needs for forest ecosystems in a changing environment: an introduction
vol. 2, pp. 54-55 (online: 21 January 2009)
Research Articles
Nitrogen deposition and its impact on forest ecosystems in the Czech Republic - change in soil chemistry and ground vegetation
vol. 10, pp. 48-54 (online: 29 June 2016)
Short Communications
QA/QC activities and ecological monitoring in the Acid Deposition Monitoring Network in East Asia (EANET)
vol. 2, pp. 26-29 (online: 21 January 2009)
Review Papers
Monitoring the effects of air pollution on forest condition in Europe: is crown defoliation an adequate indicator?
vol. 3, pp. 86-88 (online: 15 July 2010)
Short Communications
Linking critical thresholds for acidity to forest condition by using element contents in tree rings: consequences for the development of an integrated ecosystem assessment
vol. 2, pp. 51-53 (online: 21 January 2009)
Short Communications
The importance of forest type when incorporating forest edge deposition in the evaluation of critical load exceedance
vol. 2, pp. 43-45 (online: 21 January 2009)
Short Communications
Dynamic modelling of target loads of acidifying deposition for forest ecosystems in Flanders (Belgium)
vol. 2, pp. 30-33 (online: 21 January 2009)
Research Articles
Long-term monitoring of air pollution effects on selected forest ecosystems in the Bucegi-Piatra Craiului and Retezat Mountains, southern Carpathians (Romania)
vol. 4, pp. 49-60 (online: 05 April 2011)
iForest Database Search
Search By Author
Search By Keyword
Google Scholar Search
Citing Articles
Search By Author
Search By Keywords
PubMed Search
Search By Author
Search By Keyword


