Multifactor empirical mapping of the protective function of forests against landslide occurrence: statistical approaches and a case study
iForest - Biogeosciences and Forestry, Volume 9, Issue 3, Pages 383-393 (2016)
doi: https://doi.org/10.3832/ifor1740-008
Published: Jan 16, 2016 - Copyright © 2016 SISEF
Research Articles
Abstract
Forests are increasingly valued for services beyond timber and non-timber products including land protection with respect to events such as landslides, soil erosion, floods and avalanches. The most important properties of a protective forest are its ecological and mechanical stability. Planning and implementing multifunctional forest management in protective forests is challenging because of the trade-offs and synergies among the many functions of the forest. In this study, a multifactor empirical method is presented for assessing the protective role of forests on a stand scale with respect to landslide occurrence. Multifactor methodologies typically estimate landslide susceptibility exploiting the relationship between past landslide patterns and site characteristics. Two statistical approaches were here applied to assess the probability of landslide occurrence: the weight-of-evidence technique and the logistic regression technique. Statistical analysis was performed on the basis of landslide detachment zone only. The question of how to estimate protective forest function was answered through the comparison of models established with different sets of predicting factors. This study ultimately aims to provide a decision-support tool focused on mapping the potential role of forests in landslide-prone areas. A case study from the Italian Alps was considered. The density of landslide detachment outside forest areas proves to be more than twice than that within forest areas.
Keywords
Forest Protective Function, Landslide Susceptibility, Logistic Regression, Weight of Evidence, GIS, Alps
Introduction
Forests provide timber and non-timber products and a wide range of services. Most forests are multifunctional, to a certain extent, simultaneously fulfilling ecological, economic and social functions. However, a clear functional specialization of forests also exists and can thus determine focused management strategies. This is the case of protection forests.
The protective role of forests is due to the ability of stands to control and reduce the occurrence and impact of natural hazards such as landslides, soil erosion, surface runoff, debris flow and avalanches ([12], [32]). Forest protection may be classified according to indirect or direct effects ([53]). Direct protection implies that the forest directly defends people, their goods and infrastructures against the impact of natural hazards. Indirect protection is related to other natural resources, such as protection of soil against erosion or protection of the quantity and quality of water resources. Forests offering direct protection also provide indirect protection, whereas the opposite is not always true. Berger & Rey ([9]) introduce also the terms “active protection” (which is possible in the departure zone of avalanches, floods or erosion) and “passive protection” in the transition and stopping zones. Protection forests require management decision other than, for example, those of productive forests aiming at preserving and enhancing the protective effectiveness of the stands ([11], [28]). However, in many cases, protective stands are also harvested for wood production and must be managed weighing the relative importance of each function ([20]). Thus assessing and mapping the degree of protection against a certain hazard guaranteed by a forest are key tools for planning silvicultural options at stand level. This paper had this goal referring to protection against landslides. We did not distinguish between direct and indirect protection, the scope of the work being to evaluate the protective potential of each stands apart from the object to protect.
The relationships between vegetation cover and mass movement are diverse and multifaceted, as discussed by Sidle et al. ([68]), Sidle & Ochiai ([69]) and Marston ([48]). Forest cover enhances slope stability through its effect on both hydrology and soil strength. Through interception, evapo-transpiration and enhancing soil permeability, forests improve the hydrological characteristics of the soil. Tree root systems enhance the shearing strength of the soil, enabling it to resist landslides and erosion. Among the preparatory causes, slope failures may take place under modification of forest stand conditions by human activities, such as road building and wood harvesting ([69]). Landslides which occur some years after deforestation are often attributed to decay and loss of strength in root networks of a former forest cover ([33], [1]).
A landslide can be defined as the movement of rock, earth or debris down a slope under the force of gravity ([24]). Despite this simple definition, a landslide is a complex phenomenon characterized by five fundamental mechanisms (fall, topple, slide, lateral spread, flow) and their combinations ([23]). Varnes ([75]) defines landslide hazard as the probability of a landslide occurring within a specified period and given area. This definition includes two features: geographical location (spatial probability) and the occurrence of the events (temporal probability). Spatial probability, as represented by landslide susceptibility, is the likelihood of a landslide occurrence in a given location (or land unit) conditioned to its characteristics ([19], [35]). Landslide susceptibility maps are very useful for planners for selecting suitable locations for developmental activities in mountain regions ([65]).
A variety of approaches, including heuristic, statistical and deterministic ones, were developed to assess landslide susceptibility. The heuristic approaches take into account the relation between the location of previous landslide events and geo-morphological and geo-lithological settings ([2], [5], [77], [10]). This approach strongly depends on the expert experience: each geo-morphological and geo-lithological factor is weighted according to its assumed or expected influence in causing mass movements. A final map is obtained by overlaying the thematic layers relative to each factor.
The deterministic approach is based on the hydrogeo-technical models of slope stability. A variety of frameworks are available in literature referring to different physical models. For instance, many authors have used the infinite slope stability paradigm ([52], [64]), hydrological models with slope stability component ([50], [42]), more complex dynamic landscape evolution models ([21]), and shallow subsurface flow and landsliding models ([73]) to assess landslide susceptibility. The primary drawback of deterministic approach is that it requires detailed information on many environmental conditions within a landscape at a high spatial resolution.
Statistical approaches to assess landslide susceptibility involve the determination of the combinations of variables that have led to landslides in the past. Thorough reviews of the approach are given by Guzzetti et al. ([37]) and Brenning ([14]). Both bivariate and multivariate statistical approaches were exploited. Bivariate analysis compares each predisposing factor with a landslide inventory map, ignoring any significant intercorrelation among the factors. Under bivariate statistical analysis, each causal factor layer is combined with the landslide distribution map and weighting values are calculated according to landslide densi- ties. One of the common methods applied is the weight-of-evidence model ([43], [63], [62], [59]).
Multivariate analysis builds statistical models by simultaneously considering the influences of all factors within a defined land unit on landslide susceptibility. For this analysis, several authors have successfully used logistic regression modeling ([4], [78], [46], [18], [27], [55], [61]).
This paper compares the results of bivariate and multivariate statistical approaches in order to introduce a framework for estimating the degree of protection offered by forest at the stand level as a decision-support tool for forest management and planning with a protective role against landslide. Assuming that the forest cover generally enhances slope stability, we propose an approach to asses forest protection by considering landslide susceptibility scenarios derived from various landslide predictive factors dataset.
The methodological approach, which is illustrated with references to a case study in the Italian Alps, has the following goals: (i) to evaluate the influence of different factors on the model prediction; (ii) to quantify, in relative terms, the protection against landslide occurrence provided by forests; (iii) to determine the spatial extent of forest that have a preeminent protective function.
Material and methods
Models established for distinct functional units of landslides involve different patterns for landslide susceptibility assessment ([76]). Magliuolo et al. ([47]) demonstrated that consideration of landslide detachment zones rather than landslide body (the transport zone and the deposition zone) for statistical analysis conveys more meaningful results. Therefore, only the area of landslide detachment zone was considered for the statistical analysis in the present study.
The bivariate (weight-of-evidence) and multivariate (logistic regression) approaches were exploited to examine the relationship between landslide occurrence and geo-environmental factors, whose maps are typically available for large areas. For each statistical approach, two models were established, with the second one including forest cover as a predicting factor. The predictive potentials of the established models were evaluated using the Receiver Operating Characteristics (ROC) curve ([8], [31], [71]).
After identifying the best statistical approaches, the landslides susceptibility maps produced by either models that exclude (model type 1) and the models including (model type 2) forest cover were compared. By subtracting the model type 1 from the model type 2 a coefficient map was obtained by scaling between 0 and 1 this difference. Our interpretation is that this coefficient quantifies the relative effect of the forest cover on slope stability.
Weight-of-Evidence (WofE)
The WofE technique is based on a statistical Bayesian bivariate approach. Bayes’ theorem expresses the conditional probability of finding supporting evidence s in the study area given the class Bi of the B predicting factor, as Bi variable represents the presence of a factor that predicts the potential evidence, Bi^ is the absence of a factor that predicts potential evidence, s is the presence of the event and s^ is the absence of the event. The above-mentioned conditional probability can be written as follows (eqn. 1):
where P(Bi|s) is the conditional probability of Bi given s; P(s) is the prior probability that s exists in the study area; P(Bi) is the prior probability of finding the class Bi in the study area.
Similarly, the conditional probability of finding s in areas not covered by class Bi of the factor B is as follows (eqn. 2):
where P(Bi^|s) is the conditional probability of not finding the class Bi given s; P(s) is the prior probability that s exists within the study area; P(Bi^) is the prior probability that class Bi does not exist within the study area.
These conditional probabilities are incorporated into two logarithmic equations to determine positive (eqn. 1) and negative (eqn. 2) weights, from which a weighted contrast (eqn. 3) can be determined for each predictive factor’s class, which reflects the overall spatial association between landslides and the factor ([13] - eqn. 3, eqn. 4, eqn. 5):
Landslide susceptibility is calculated from the combined probabilities associated with the different components of the model ([6] - eqn. 6):
where Of=Pf/(1-Pf) is the prior odds of a landslide in the study area, and Pf=Af/At where Af is that portion of the study area affected by landslides, and At is the total study area. The WofE approach was here applied using the spatial data modeller compiled in the Python language with ArcGIS® 9.3 software ([30]) by Sawatzky et al. ([66]).
Logistic Regression (LR)
Logistic regression is a common multivariate approach that: (i) can be used to predict a result measured by a binary variable, such as the absence or presence of landslides, based on a set of one or more independent variables (predictive factors); (ii) does not require the variables to be normally distributed; and (iii) the independent variables can be either nonlinear, continuous, categorical or a combination of both ([39], [45]).
The conditional probability that an event will occur is given as follows (eqn. 7):
and the logistic model can be expressed in its simplest form as (eqn. 8):
in which z can be expressed as a linear combination (eqn. 9):
where β0 is the intercept of the model, n is the number of variables, Xi (i = 1, 2, …, n) are the independent variables, and βi (i = 1, 2, …, n) are the values associated with each of the independent variables. P varies between 0 and 1 on an S-shaped curve as z varies from -∞ to +∞ ([39]).
The logistic multiple regression algorithm within the free statistical programming language “R” ([60]) was used in this study to obtain the coefficients for the logistic multiple regression model according to a forward stepwise method.
The results were then imported in the ArcGIS software for mapping landslide susceptibility with a probability of occurrence ranging from 0 to 1.
Case study
The Alpine region is characterized by a strong link between local communities and forests ([56]) and by particular attention to forest multifunctionality ([36]). This is particularly relevant in the Italian Alps where all forests have been affected by humans to some extent, either through direct periodic wood harvesting or by other forms of land-use (e.g., grazing). Nevertheless, in the last decades there has been a noticeable reduction of the anthropogenic disturbances and, as a consequence, many forest stands have developed naturally even if their composition and structure still reflect past human activity ([54]).
The study area is inside the Veneto region (Italy) within the geographic zone of the Dolomites (south-eastern European Alps), dominated by mountain ridges rising up to 3000 m a.s.l., with their uppermost portion consisting mainly of carbonate rocks (limestone and dolostone) that form isolated peaks or high standing plateaus. The case study refers to the Cadore-Longaronese-Zoldo administrative district, covering approximately 32 000 ha and contains 7 municipalities consisting of small and sparsely populated villages. The administrative district covers a latitude of 46° 11′ - 46° 26′ N, and a longitude of 12° 05′ - 12° 30′ E (Fig. 1).
Fig. 1 - Map of the case study area and landslide inventory map (a). The locations of the area within the Veneto region (b) and within Italy (c) are shown on the right.
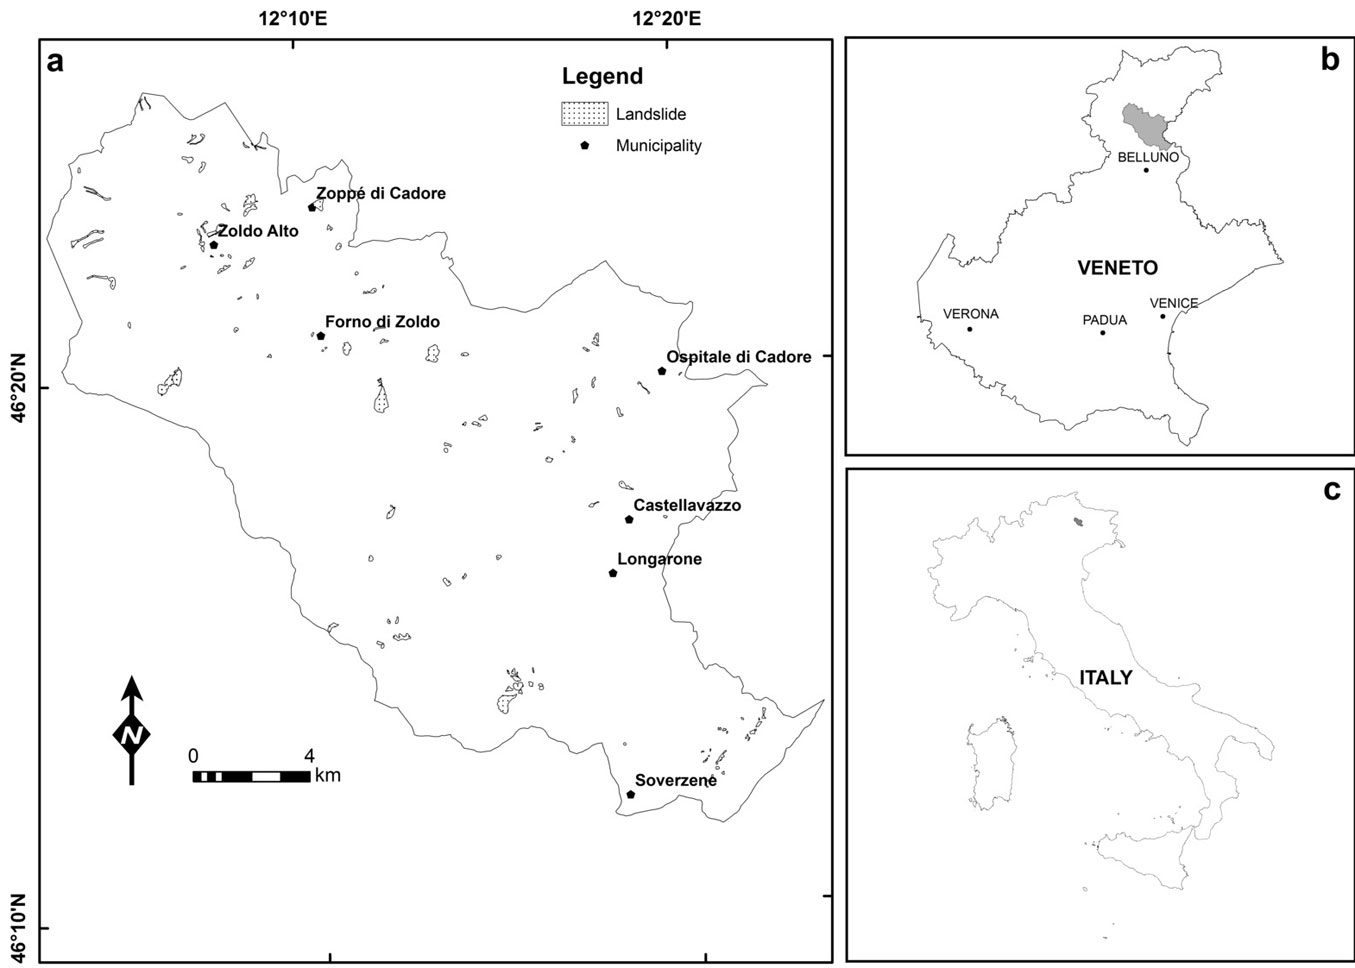
Artificial surfaces such as urban and built up areas cover a small percentage of the study area (2%). Approximately, 10% is used for agriculture and consists mostly of meadows and alpine pastures; screes and rocks outcrops cover a similar surface (11%). The most dominant land cover type is forest (77%).
The survey protocol was based on the following steps:
- delineation of the landslide detachment areas from the IFFI Project (Italian Landslides Inventory);
- selection of the predictive factors and acquisition of the corresponding GIS layers;
- WofE modeling and evaluation of the predictive factor classes via
W+andC; - LR analysis by forward stepwise regression method;
- validation and assessment of the model’s predictive potential using the ROC curve;
- comparison of the modeling results, i.e., the susceptibility map generated using only geo-environmental variables as predictive factors (model type 1) vs. the susceptibility map generated including also forest cover as a predictive factor (model type 2).
Landslide database
The IFFI project constitutes the Italian national landslide inventory, accomplished from 1999 to 2004. In the 2005-2006 biennium the inventory was updated based on field surveys, collection of the historical and archive data, and aerial photo interpretation ([41]). Classification of landslides was made referring to Varnes ([75], modified by [23]), partly modified to meet the practical needs of surveying and mapping the landslides. Additional types of movement were introduced: sinkholes, deep seated gravitational slope deformation, areas affected by numerous rockfalls/topples, areas affected by numerous sinkholes and areas affected by numerous shallow landslides. The last three classes were added in order to classify those landslides which are limited in size, recurrent and referable to same type of movement, which affect large sectors of slopes in Italy ([41]).
A total of 120 active landslides were identified in the study area, covering close to 350 ha and accounting for 1.1% of the territory (Fig. 1). Although the exact date of occurrence for most of the considered landslide is unknown, they are all referred to the last two decades. According to the landslide classification by Varnes partly modified, 70 % of the inventoried landslides account for three types of mass movement: rapid flow, rotational/translational slides and complex slope movements (Tab. 1). Rock falls, that can occur from Dolomite peaks, were not considered in this study.
Tab. 1 - Landslides by landslide type occurring in the study area considered.
| Landslide type | Number | Area (ha) |
|---|---|---|
| Area prone to falls/topples | 1 | 9 |
| Shallow | 2 | 23 |
| Slow flow | 4 | 11 |
| Rapid flow | 40 | 104 |
| Complex movement | 5 | 36 |
| Fall/topple | 2 | 10 |
| Rotational and translational slide | 63 | 150 |
| Not available | 3 | 5 |
| Total | 120 | 348 |
The landslide detachment zone is where failure occurs. Generally, landslide detachment surface is located in the upper part of steep slope within the boundaries of crown portion of the slide, beyond the main scrap and the active scrap itself (Fig. 2).
Fig. 2 - A rotational landslide within the case study area (Pontesei zone, municipality of Forno di Zoldo, province of Belluno, Italy). The detachment zone is delineated.
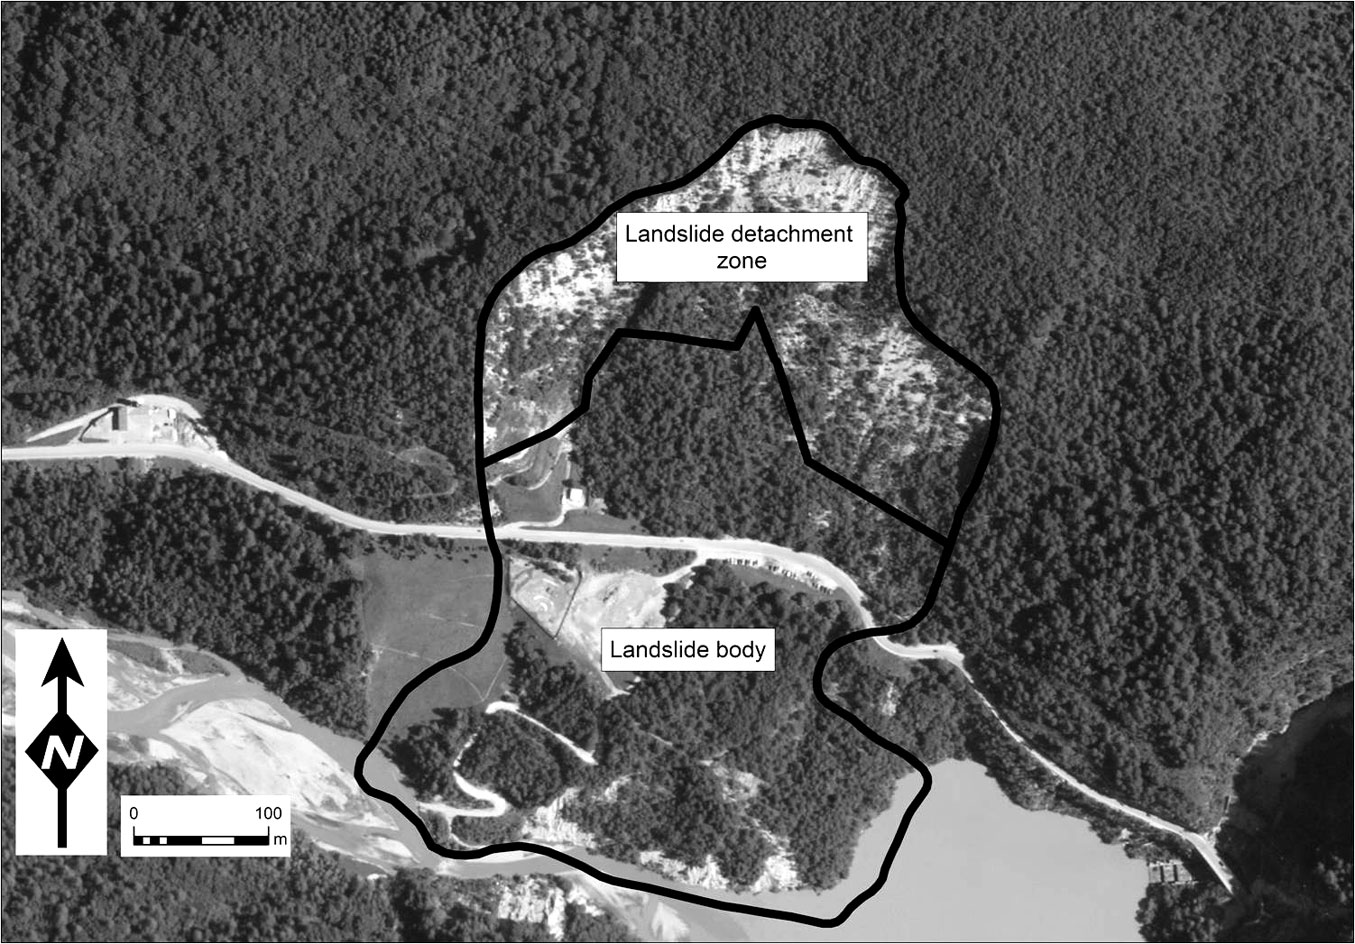
Landslide detachment identification and delineation were drawn from the IFFI inventory through an on-screen monoscopic-visual interpretation technique of digital aerial photos taken in 2006-2007. The detachment area of each landslide was delineated in a vector-type spatial database using the ARCGIS 9.3 software package. The geo-referenced point located at the highest point of the landslide crown was selected as starting/ending point to map each detachment area. When the landslide detachment zone was hidden or obscured by tree cover, the identification was carried out by considering the size of the features, the contrast between landslides and surrounding areas, and the morphological expression (Tab. 2).
Tab. 2 - Landslide detachments by landslide type occurring in the study area considered.
| Landslide type | Area (ha) |
|---|---|
| Areas prone to falls/topples | 2 |
| Shallow | 17 |
| Slow flow | 5 |
| Rapid flow | 46 |
| Complex movement | 15 |
| Fall/topple | 5 |
| Rotational and translational slide | 70 |
| Not available | 2 |
| Total | 162 |
Landslide predictive factors
To apply the statistical approaches, a spatial database was created. According to literature ([16], [70], [37]) and to the data available over the entire study area, six potential predictive factors were considered: aspect, slope, lithology, permeability, soil type, and forest cover. Influential climatic factors, such as rainfall, were not taken into account because their variation is negligible within this area.
The DEM resolution is the basis for the mapping unit in landslide susceptibility assessments ([4], [29]). Lee et al. ([44]) undertook a comparative study of landslide susceptibility assessments at different spatial resolutions: relationship between the landslide distribution and the predictive factors generated by DEM (constructed from a 1:5.000 scale topographic map) and vector data were evaluated with spatial resolutions of 5, 10, 30, 100 and 200 m. The authors determined that a 30 m pixel size was the maximum advised to obtain suitable predictive capacity. For this study, it was decided to use the best precision level of the available data (20 m) as the basic mapping unit. By using a small pixel size, we were reasonably confident that the sampled parameters are constant across the pixel size. Applying a cell size of 20 m resulted in 807 255 pixels, of which 4 014 were classified as landslide detachment area.
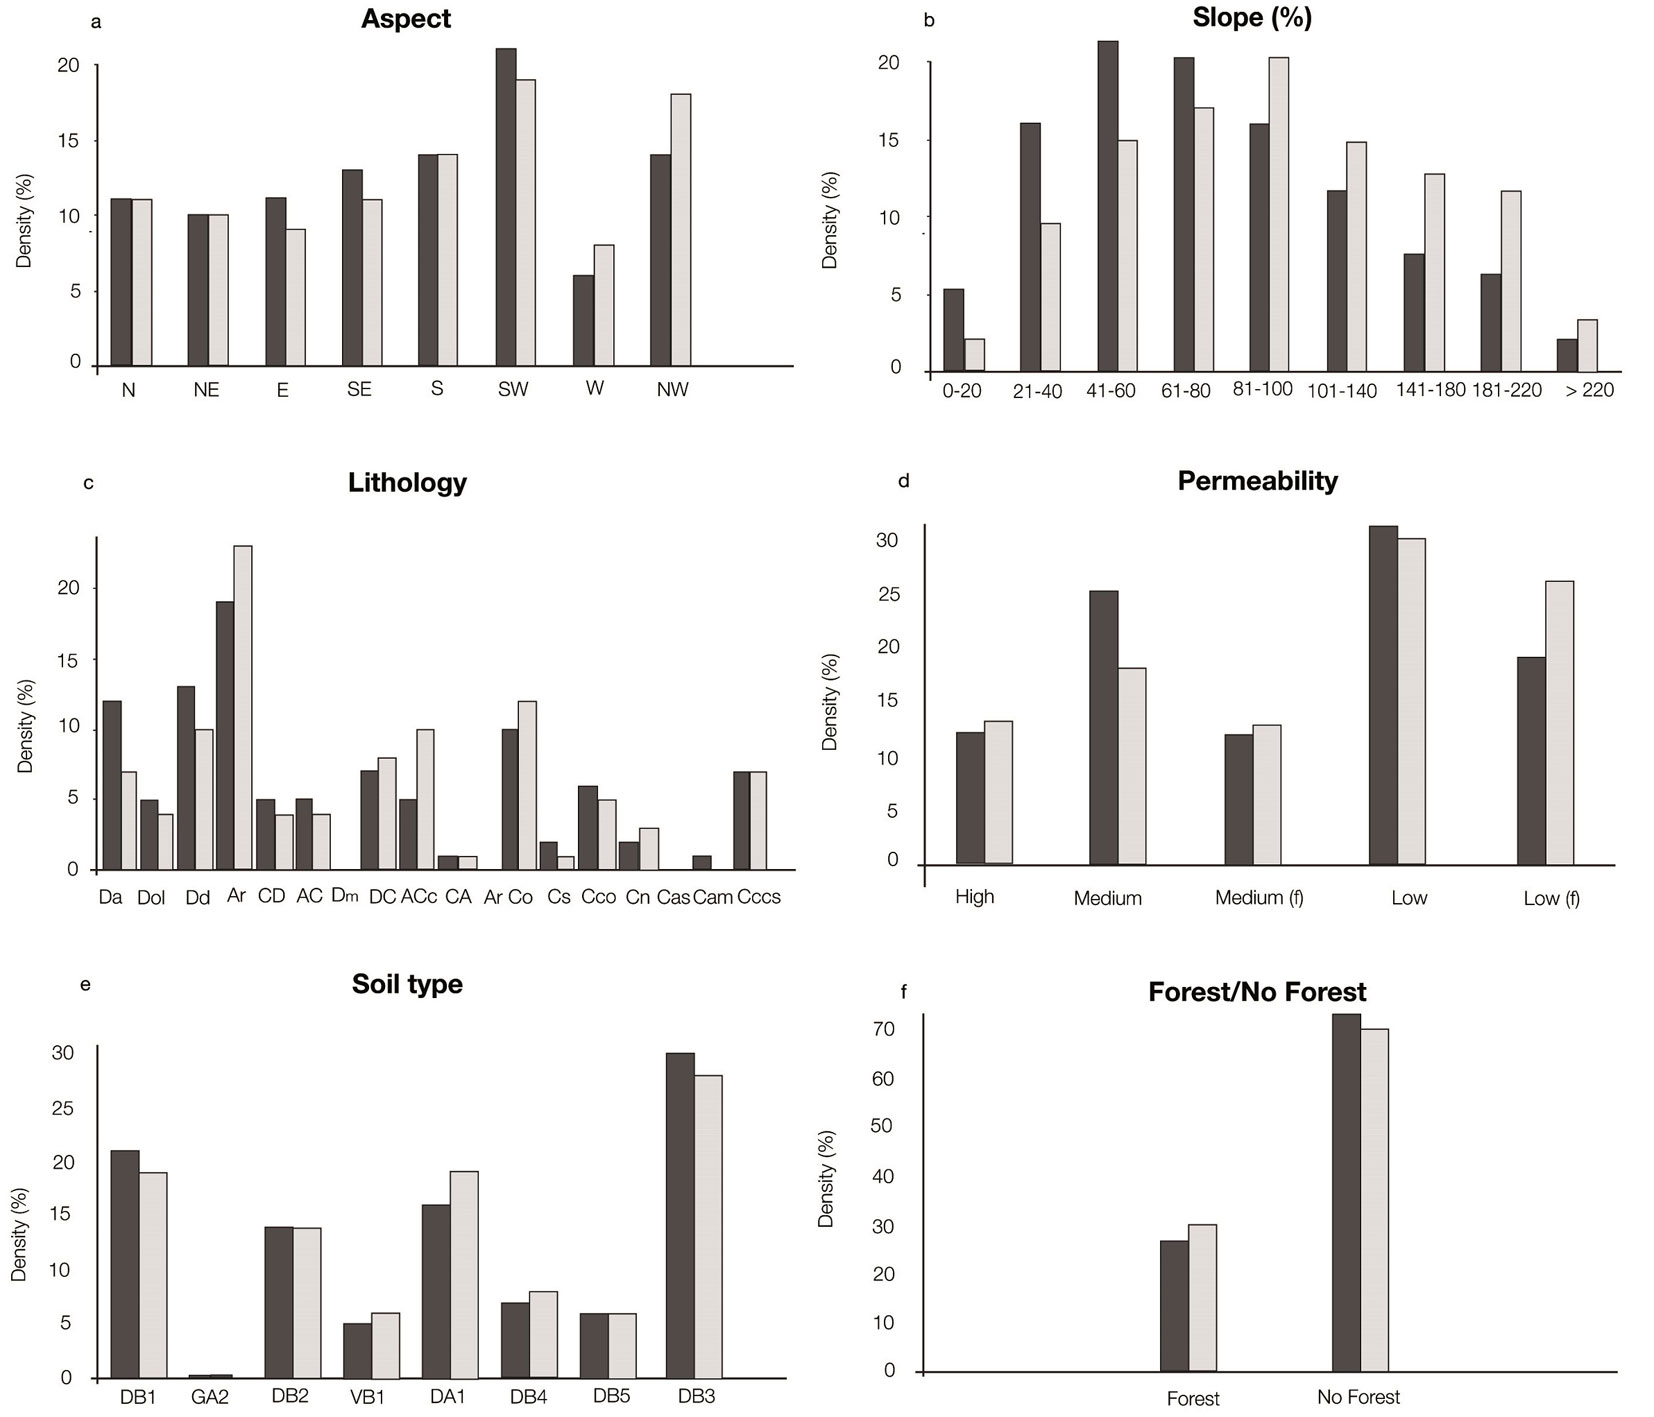
The spatial distribution of the potential predictive factors was crossed with those of the landslides and detachment areas to calculate the density values for each class of the predictive factors (Fig. 3). The density was calculated according to Ayalew & Yamagishi ([4]): the ratio between the area occupied by the landslide pixels in a given class of a certain factor and the total pixels in that class was first determined; this was repeated for each of the classes available for that factor; these ratios were then added, and each ratio was divided by the total sum to obtain the density with respect to each factor.
Fig. 3 - Density of all landslides (black) and of the landslide detachment zones (grey) with respect to the predictive factors: aspect (a), slope (b), lithology (c), permeability (d), soil types (e) and forest cover (f). Histograms showing landslide densities as described in the text. Sub-divisions of the X-axis represent classes of the six landslide-predictive parameters. The definitions of the acronyms for the lithology classes, permeability classes and soil types are reported in Appendix 1: Rock Units (Tab. S1), Perm Classes (Tab. S2), Soil Types (Tab. S3).
DEM-derived factors: aspect and slope
The aspect and slope layers were derived from DEM (resolution of 20×20 m) based on digital topographic maps at scale 1:5.000 of the study area revised in 2004. The DEM was created by using an interpolation method based upon the ANUDEM program developed by Hutchinson ([40]), which is included in the ArcGIS 9.3 software package.
These predictive factors were treated as discrete variables under the WofE analysis (categorized according to their different classes), while they were considered continuous variables as input for LR analysis.
The aspect indicates the influence of solar radiation, exposition to preferential winds and local weather conditions on landslide distributions. Aspect discontinuities may also control the occurrence of landslides ([72], [51], [38]). The aspect was classified according to direction: north (0°-22.5°; 337.5°-360°), northeast (22.5°-67.5°), east (67.5°-112.5°), southeast (112.5°-157.5°), south (157.5°-202.5°), southwest (202.5°-247.5°), west (247.5°-292.5°) and northwest (292.5°-337.5). No flat class was found in the study area. Most events occurred on southern-oriented slopes (19% - Fig. 3). For LR analysis the aspect was treated as a continuous variable after cosine transformation.
Slope gradient is one of the factors most closely associated with landslides ([37], [57], [51], [55]). The slope layer was derived from the DEM using the average maximum technique ([15]) included in ArcGIS 9.3. The slope value was calculated using the maximum change in elevation over the distance between each pixel and its eight neighbors. We defined nine categories of slope percentage slicing the values into equal intervals and computed the corresponding percentage of landslide occurrence (Fig. 3). In the study area, most landslides occur on slopes of 40 to 100%.
Other geo-environmental factors
Referring to the case study, three factors hypothesized to act as other geo-environmental predictors of landslide susceptibility were extracted from the regional spatial datasets available: lithology, permeability and soil types.
Different lithological types are affected by different landslide susceptibilities ([26], [78], [55]). The lithology layer, rasterized from a 1:250.000-scale geological map of the Veneto region by Dal Piaz ([25]), consists of 19 rock units (see Tab. S1 in Appendix 1 for a short description). Most landslides occur in arenitic rocks belonging to Auronzo, Fernazza and La Valle formations (Ar - Fig. 3).
It is widely recognized that geological parameters greatly influence the occurrence of landslides, because lithological and structural variations lead to a difference in strength and permeability of rocks and soils, runoff and groundwater movement. In many cases, landslides are due to large changes in the pore-water pressure due to the rise or fall of the groundwater level. The Department of Geology of the Veneto region compiled the permeability data through the digital integration of the geological map at a scale of 1:250.000 (see Tab. S2 in Appendix 1 for the classes of this predictive factor). The permeability map was prepared to show the relative permeability of lithological units. The landslide densities computed for rocks with low primary and secondary permeability were 31% and 19%, respectively. The landslide density was also high in rocks classified as having medium permeability (25%). When assessing the density of these permeability classes with respect to the detachment zones, the maximum density value was confirmed for the rocks with low primary permeability, while the density increased to 26% for rocks with low secondary permeability and decreased to 18% for rocks with medium primary permeability (Fig. 3).
Sidle et al. ([68]) observed that soil properties such as particle size and pore distribution in the soil matrix can significantly influence the slope stability. These properties control the rate of water movement and the capacity of the soil to hold water. In addition, finer soils tend to hold higher volumes of water under unsaturated conditions than coarse-textured soils. The digital soil information was obtained from a 1:250.000-scale soil map of the Veneto region ([3]). The soil types identified in the study area are reported in the Tab. S3 in Appendix 1. In the study area, the soil type mostly affected by landslides was the DB3 type (Fig. 3).
Forest cover
In order to clarify the effects of forest stands on the occurrence of landslides the local forest cover map, available at a scale of 1:10.000 ([3]), was used for the analysis. Each landslide detachment area was assigned in the field to either forest or open land and checked in the field. About 77% of the study area is covered by forest, of which approximately 0.5% is included within the landslide detachment areas. The forest stands are primarily dominated by Larix decidua L., Fagus sylvatica L. and Pinus sylvestris L.
The protective function of the forest against landslide is immediately apparent from Fig. 3: the density of landslides in non-forest areas is more than twice that in forest areas.
Preparation of the calibration and validation data, the ROC curve
The tested statistical approaches were applied by two stages: model calibration and model validation. Based on the random partition approach, the 90% of the original dataset was selected as the calibration subset used for building the model and the remaining 10% was designed as validation subset used for independent verification of the model’s predictive performance via the ROC curve. The technique using a ROC curve has been frequently adopted to evaluate and compare models ([78], [35], [55], [17]). ROC curves can be prepared: (i) using the same landslide information used to construct the classification model (in this case, the ROC curve measures the degree of model fit); and (ii) for independent landslide information, in which case they measure the classification prediction skill ([74]), as in the present case study. The curve plots the sensitivity (true-positive) vs. 1-specificity (false-positive) to indicate the ability of a model to correctly discriminate between the positive and negative observations in the validation space. High sensitivity often implies low specificity and vice versa. For example, a conservative model would have high sensitivity (a high number of correct predictions) but low specificity (a high number of false positives). In a standard ROC plot, the area under the curve (AUC) is a quantitative measure of the model performance: the higher is this value, the better is the model fit ([58]). The statistical range from 0.5 (random prediction, represented by the diagonal straight line) to 1 (perfect prediction) can be used to compare models. In contrast to success and prediction rate curves, ROC curves are not sensitive to prevalence, i.e., considerable difference between landslide free and landslide-affected mapping units ([8]): therefore, ROC curves are considered a more appropriate assessment and validation tool ([74]).
Results
The values of the weights and the contrasts and their standard deviations for each predictive factor under the WofE approach are summarized in Tab. 3. According to the weights assigned to the aspect classes, the highest positive correlation is observed for the south-western slopes. A steeper slope indicates a greater probability of landslide detachment: below 20%, the contrast is -2.224, indicating very low probability; from 40 to 60%, the contrast is 0.104 and increases in the three subsequent classes. Among the considered lithological classes, arenitic rocks belonging to Auronzo, Fernazza and La Valle formations (Ar) and calcareous and dolomitic rocks belonging to S. Vigilio group (Co) exhibit the greatest importance. In the permeability classes, the contrast value is higher when the permeability is low. The contrast is higher for some classes of Cambisols and is relatively lower for Leptosols, indicating an increase in the landslide occurrence in soil with medium-to-fine texture. Finally, the contrast value is much lower when forest cover is present (model type 2), indicating a statistically significant reduction in the occurrence of landslide detachments compared to the areas outside the forest (Tab. 4).
Tab. 3 - Weight and standard deviation (σ) of each predictive factor class. (a): classes showing positive values of W+. The definitions of the acronyms for lithology classes, permeability classes and soil types are reported in Appendix 1: Rock Units (Tab. S1), Perm Classes (Tab. S2), Soil Types (Tab. S3).
| Predicting factor |
Class | W + | σW + | W - | σW - | C | σC |
|---|---|---|---|---|---|---|---|
| Aspect | N | -0.077 | 0.050 | 0.010 | 0.018 | -0.087 | 0.053 |
| NE | -0.240 | 0.051 | 0.033 | 0.018 | -0.273 | 0.054 | |
| E | -0.329 | 0.050 | 0.050 | 0.018 | -0.379 | 0.053 | |
| SE | -0.122 | 0.047 | 0.019 | 0.018 | -0.141 | 0.050 | |
| S a | 0.134 | 0.046 | -0.018 | 0.018 | 0.153 | 0.050 | |
| SW a | 0.449 | 0.039 | -0.079 | 0.019 | 0.528 | 0.043 | |
| W | -0.449 | 0.064 | 0.042 | 0.017 | -0.490 | 0.067 | |
| NW a | 0.396 | 0.041 | -0.061 | 0.018 | 0.457 | 0.045 | |
| Slope | 0 - 20 | -2.151 | 0.174 | 0.073 | 0.017 | -2.224 | 0.175 |
| 20 - 40 | -0.392 | 0.052 | 0.058 | 0.018 | -0.450 | 0.055 | |
| 40 - 60 a | 0.081 | 0.035 | -0.023 | 0.019 | 0.104 | 0.040 | |
| 60 - 80 a | 0.182 | 0.032 | -0.060 | 0.020 | 0.242 | 0.038 | |
| 80 - 100 a | 0.353 | 0.037 | -0.074 | 0.019 | 0.428 | 0.041 | |
| 100 - 140 a | 0.053 | 0.047 | -0.008 | 0.018 | 0.060 | 0.050 | |
| 140 - 180 | -0.097 | 0.087 | 0.004 | 0.017 | -0.101 | 0.088 | |
| 180 - 220 | -0.166 | 0.151 | 0.002 | 0.017 | -0.169 | 0.152 | |
| > 220 | -1.248 | 0.354 | 0.006 | 0.017 | -1.254 | 0.354 | |
| Lithology | Da a | 0.107 | 0.061 | -0.008 | 0.017 | 0.115 | 0.063 |
| Dol | -0.416 | 0.041 | 0.108 | 0.018 | -0.524 | 0.045 | |
| Dd a | 0.473 | 0.031 | -0.141 | 0.020 | 0.614 | 0.037 | |
| Ar a | 1.314 | 0.037 | -0.170 | 0.019 | 1.484 | 0.042 | |
| CD | -0.314 | 0.189 | 0.003 | 0.017 | -0.316 | 0.190 | |
| AC | -0.552 | 0.133 | 0.012 | 0.017 | -0.563 | 0.134 | |
| Dm | 0.000 | 0.000 | 0.000 | 0.000 | 0.000 | 0.000 | |
| DC a | 0.261 | 0.135 | -0.004 | 0.017 | 0.264 | 0.136 | |
| ACc a | 0.456 | 0.159 | -0.004 | 0.017 | 0.460 | 0.160 | |
| CA | -2.384 | 0.316 | 0.028 | 0.017 | -2.412 | 0.317 | |
| Arr | 0.000 | 0.000 | 0.000 | 0.000 | 0.000 | 0.000 | |
| Co a | 0.613 | 0.083 | -0.019 | 0.017 | 0.632 | 0.085 | |
| Cs | -1.583 | 0.169 | 0.039 | 0.017 | -1.621 | 0.170 | |
| Ds | -0.234 | 0.049 | 0.035 | 0.018 | -0.269 | 0.052 | |
| Cco | -0.831 | 0.098 | 0.040 | 0.017 | -0.871 | 0.099 | |
| Cn | 0.000 | 0.000 | 0.000 | 0.000 | 0.000 | 0.000 | |
| Cas | -2.755 | 0.354 | 0.033 | 0.017 | -2.788 | 0.354 | |
| Cam a | 0.103 | 0.114 | -0.002 | 0.017 | 0.105 | 0.115 | |
| CCcs | 0.000 | 0.000 | 0.000 | 0.000 | 0.000 | 0.000 | |
| Permeability | High | -0.401 | 0.034 | 0.171 | 0.019 | -0.573 | 0.039 |
| Medium | -0.033 | 0.060 | 0.003 | 0.017 | -0.036 | 0.063 | |
| Medium (f) | -0.347 | 0.045 | 0.068 | 0.018 | -0.415 | 0.049 | |
| Low a | 0.473 | 0.031 | -0.141 | 0.020 | 0.614 | 0.037 | |
| Low(f) a | 0.320 | 0.033 | -0.091 | 0.019 | 0.411 | 0.038 | |
| Soil types | DB1 a | 0.159 | 0.024 | -0.138 | 0.024 | 0.296 | 0.033 |
| GA2 | 0.000 | 0.000 | 0.000 | 0.000 | 0.000 | 0.000 | |
| DB2 | -0.158 | 0.054 | 0.018 | 0.018 | -0.176 | 0.057 | |
| VB1 | -1.036 | 0.122 | 0.035 | 0.017 | -1.071 | 0.123 | |
| DA1 a | 0.136 | 0.045 | -0.021 | 0.018 | 0.157 | 0.048 | |
| DB4 | -0.741 | 0.075 | 0.059 | 0.017 | -0.801 | 0.077 | |
| DB5 | -1.078 | 0.101 | 0.056 | 0.017 | -1.134 | 0.102 | |
| DB3 a | 0.503 | 0.041 | -0.077 | 0.018 | 0.580 | 0.045 |
Tab. 4 - Weights and standard deviations (σ) obtained with respect to the presence/ absence of forest cover.
| Class | W + | σW | W - | σW | C | σC |
|---|---|---|---|---|---|---|
| Forest area | 0.577 | 0.026 | -0.267 | 0.022 | 0.844 | 0.034 |
| Non-forest area | -0.267 | 0.022 | 0.577 | 0.026 | -0.844 | 0.034 |
Tab. 5 summarizes the overall model statistics of LR. The McFadden pseudo R2 is respectively 0.18 and 0.2. The McFadden pseudo R2 measures the reduction in maximized log-likelihood. It is conceptually and mathematically close to the ordinary least squares R2 ([49]). A McFadden pseudo R2 of 1 indicates a perfect fit, whereas a pseudo R2 equal to 0 indicates no relationship. When a pseudo R2 is greater than 0.2, it shows a relatively good fit ([22], [4]).
Tab. 5 - Results of the overall model fit of logistic regressions.
| Model | Group | Statistics | Model fitting criteria | Likelihood ratio tests | ||
|---|---|---|---|---|---|---|
| -2log likelihood | χ2 | df | Prob | |||
| Model type 1 | Parameters | Intercept only | 4987.80 | - | - | - |
| Final | 4023.24 | 3778.2 | 23 | 0 | ||
| Pseudo R2 | McFadden | 0.19 | - | - | - | |
| Nagelkerke | 0.23 | - | - | - | ||
| Cox and Snell | 0.30 | - | - | - | ||
| Model type 2 | Parameters | Intercept only | 4987.80 | - | - | - |
| Final | 3935.26 | 4210.1 | 24 | 0 | ||
| Pseudo R2 | McFadden | 0.21 | - | - | - | |
| Nagelkerke | 0.25 | - | - | - | ||
| Cox and Snell | 0.34 | - | - | - | ||
The regression coefficients obtained by LR considering only the geo-environmental factors (model type 1) are provided in Tab. 6. The influence of the selected factors on landslide occurrence can be deduced from the sign of the estimated coefficients: a negative coefficient indicates that the corresponding factor is related to a safe area, while a positive coefficient signifies that the probability of landslide detachment is low. The slope is included with a positive coefficient, while the aspect is not statistically significant: landslide probability increases with increasing slope, and no significant additional interaction occurs with the aspect. Among the categorical variables, arenitic rocks belonging to Auronzo, Fernazza and La Valle formations (Ar) and to S. Cassiano formation (ACc) and calcareous and dolomitic rocks belonging to Serla Inf. Dolostone and Werfen formation (DC) have the strongest relationship with landslide occurrence, whereas the DB1 soil type prove to have a slight positive influence. Permeability is not a relevant predictor of landslide detachment in the case study: only rocks with medium secondary permeability are included in the model with slightly significant coefficient.
Tab. 6 - Logistic regression model (type 1). The definitions of the acronyms for the lithology classes, permeability classes and soil types are reported in Appendix 1: Rock Units (Tab. S1), Perm Classes (Tab. S2), Soil Types (Tab. S3).
| Predicting factors |
β
|
SE | Prob | |
|---|---|---|---|---|
| Intercept | -1.222 | 0.115 | 0.000 | |
| Slope | 4.411 | 0.358 | 0.000 | |
| Lithology | Da | 1.978 | 0.151 | 0.000 |
| Dd | 1.398 | 0.083 | 0.000 | |
| Ar | 2.767 | 0.133 | 0.000 | |
| CD | 0.940 | 0.312 | 0.003 | |
| Dm | -15.171 | 348.659 | 0.965 | |
| AC | 1.599 | 0.224 | 0.000 | |
| DC | 2.325 | 0.468 | 0.000 | |
| ACc | 2.089 | 0.284 | 0.000 | |
| CA | -0.694 | 0.364 | 0.056 | |
| Arr | -16.122 | 830.951 | 0.985 | |
| Co | 1.359 | 0.177 | 0.000 | |
| Cs | -1.767 | 0.198 | 0.000 | |
| Ds | -0.873 | 0.378 | 0.021 | |
| Cco | -0.702 | 0.144 | 0.000 | |
| Cn | -16.526 | 243.214 | 0.946 | |
| Cas | -3.459 | 0.522 | 0.000 | |
| Permeability | Medium (f) | 0.709 | 0.373 | 0.057 |
| Soil type | DB1 | 0.251 | 0.080 | 0.002 |
| VB1 | -2.484 | 0.193 | 0.000 | |
| DA1 | -0.275 | 0.108 | 0.011 | |
| DB5 | -2.424 | 0.224 | 0.000 | |
| DB3 | -1.087 | 0.128 | 0.000 | |
Forest cover has a high negative coefficient (model type 2) which provides further evidence that forest cover significantly improves slope stability (Tab. 7).
Tab. 7 - Logistic regression (type 2). The definitions of the acronyms for lithology classes, permeability classes and soil types are reported in in Appendix 1: Rock Units (Tab. S1), Perm Classes (Tab. S2), Soil Types (Tab. S3).
| Predicting factors |
β
|
SE | Prob | |
|---|---|---|---|---|
| Intercept | -1.236 | 0.120 | 0.000 | |
| Slope | 4.078 | 0.361 | 0.000 | |
| Lithology | Da | 1.557 | 0.142 | 0.000 |
| Dd | 1.276 | 0.086 | 0.000 | |
| Ar | 2.636 | 0.115 | 0.000 | |
| CD | 0.670 | 0.320 | 0.036 | |
| AC | 1.499 | 353.183 | 0.965 | |
| Dm | -15.297 | 0.214 | 0.000 | |
| DC | 2.239 | 0.463 | 0.000 | |
| ACc | 1.834 | 0.277 | 0.000 | |
| CA | -0.743 | 0.370 | 0.045 | |
| Arr | -16.025 | 836.911 | 0.985 | |
| Co | 1.236 | 0.176 | 0.000 | |
| Cs | -1.890 | 0.202 | 0.000 | |
| Ds | -0.989 | 0.376 | 0.009 | |
| Cco | -0.794 | 0.154 | 0.000 | |
| Cn | -16.686 | 240.626 | 0.945 | |
| Cas | -3.720 | 0.526 | 0.000 | |
| Permeability | Medium (f) | 0.750 | 0.371 | 0.043 |
| Soil type | DB1 | 1.172 | 0.079 | 0.000 |
| DB2 | 1.141 | 0.114 | 0.000 | |
| VB1 | -1.719 | 0.173 | 0.000 | |
| DB4 | 0.940 | 0.136 | 0.000 | |
| DB5 | -1.276 | 0.204 | 0.000 | |
| Forest cover | - | -1.044 | 0.067 | 0.000 |
Although similarities exist with respect to predictor factors (e.g., the regression coefficient sign for the slope and the exclusion of aspect as a significant factor), differences arise between models of types 1 and 2. For example, the model type 2 replaces DA1 and DB3 soil classes included in the model type 1 with DB2 and DB4. For the model type 2, medium secondary permeability class has a more significant positive coefficient than model type 1. Among the lithological variable, arenitic rocks belonging to Auronzo, Fernazza and La Valle formations (Ar) and to S. Cassiano formation (ACc) and calcareous and dolomitic rocks belonging to Serla Inf. Dolostone and Werfen formation (DC) confirm the strongest relationship with landslide occurrence, but the comparison between models reveals difference in estimated coefficient values.
However, on the whole, the obtained evidence corroborates the known interrelationship between forest cover and geoenvironmental factors.
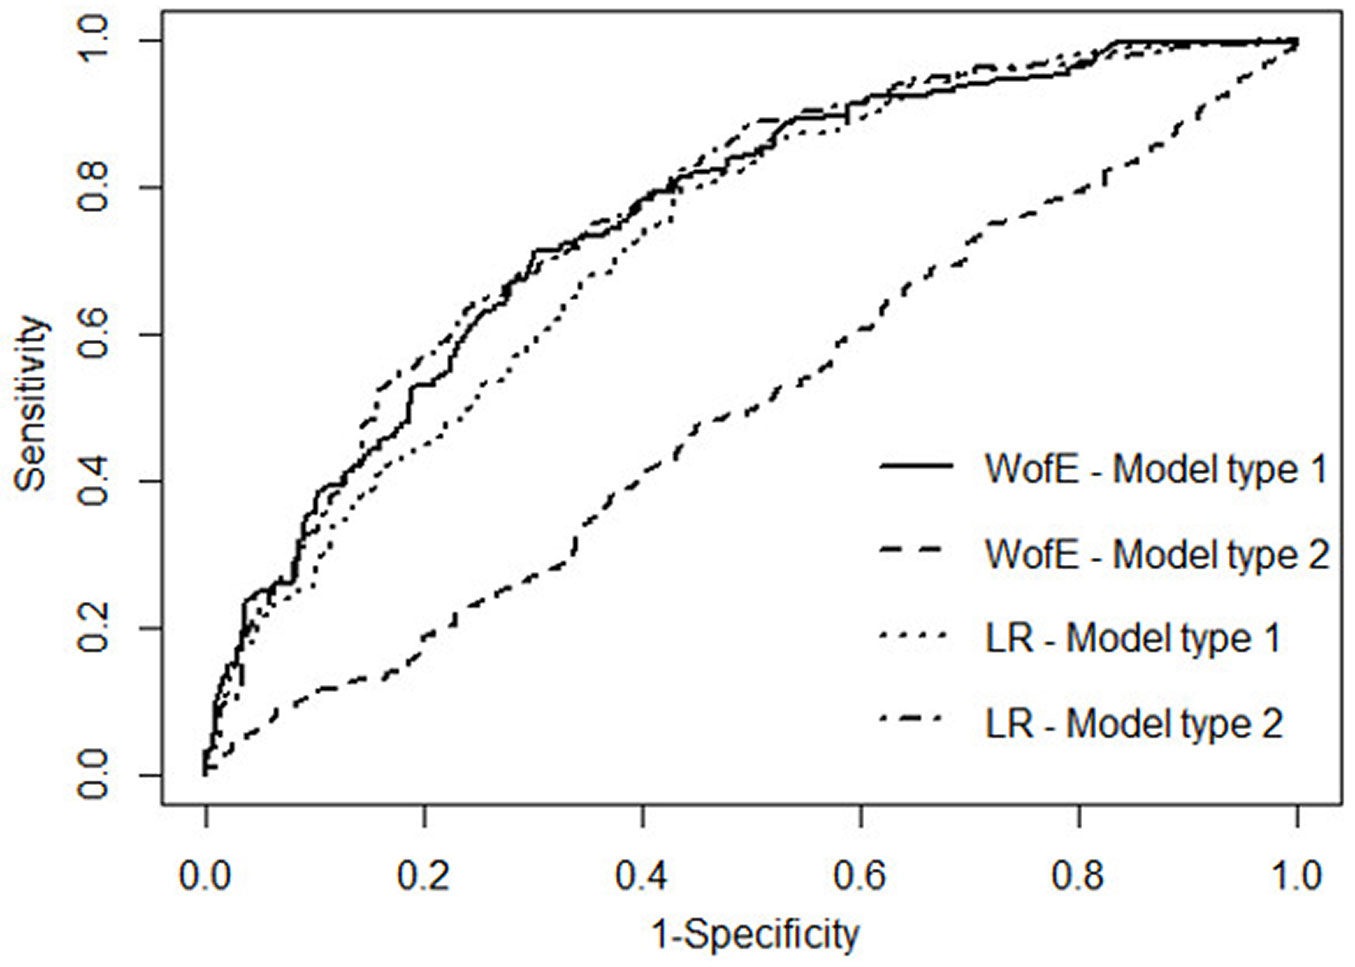
The results of the ROC analysis on the validation dataset are reported in Fig. 4. The LR approach provides results similar to those of the WofE approach: the AUC ranges from 0.757 for the WofE model type 1 to 0.768 for the WofE model type 2, while the AUC ranges from 0.734 for the LR model type 1 to 0.779 for the LR model type 2. LR approach shows a slightly better predictive capability than WofE when forest cover is included in the model.
Fig. 4 - ROC curves obtained using the studied model types with respect to the validation dataset.
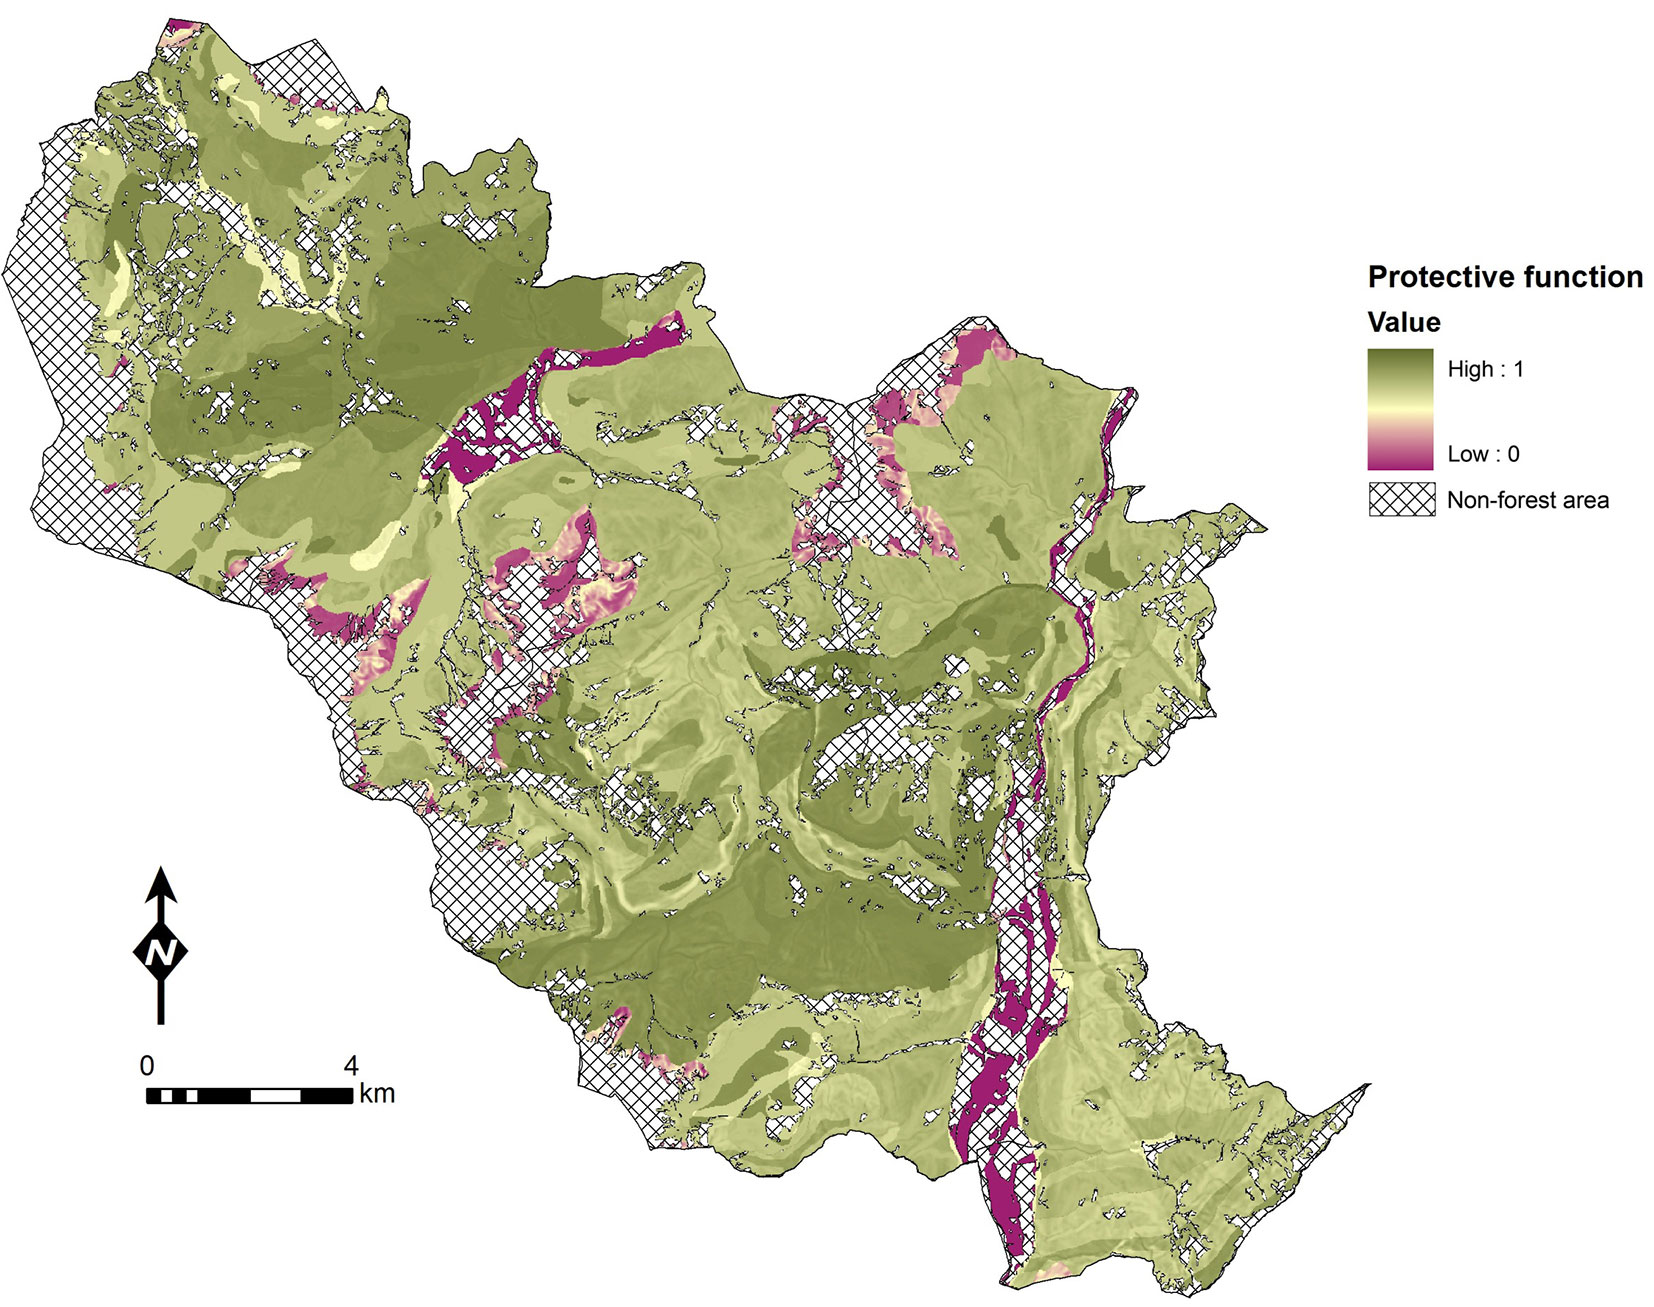
Considering that LR approach shows better performance than the WofE one, only LR models were used to estimate the forest protective effect. We subtracted the modeled susceptibility value by the LR model type 1 (established without forest cover as predictor) from the value provided by the model type 2 (including forest cover), and re-scaled this difference between 0 and 1. The result is an empirical map which shows the ranking score of protection function associated to the forest stand (Fig. 5): values close to 0 indicate forest stands with an indirect protective function while, values close to 1 identify forest stands with a high potential protective function. The forest with high protective function are mainly located in the middle part of the slope.
Fig. 5 - Map of the relative protective function of the forest stands in the study area (LR approach).
Discussion
In this study, we proposed an approach to assess the protective function of forests through the comparison of landslide susceptibility assessment with and without the current forest cover, with reference to a case study in the Italian Alps. The WofE and LR approaches were comparatively applied to generate multifactor empirical maps of landslide detachment susceptibility.
Both the WofE and the LR methods pinpointed the same predictors of the spatial distribution of landslides. Among the considered factors, those related to slope, soil type and forest cover prove to be the most influential. The probability of occurrence is highest when slope is between 40% and 100%. The soil type affects the occurrence of landslide detachment when soil particles are large. The inclusion of forest cover significantly improves accuracy in the prediction of landslide occurrence: in this case study, the density of landslide detachment areas outside forests is more than twice than that within forests.
Established statistical models proved to be characterized by fair predictive potential, as shown by AUC higher than 0.7 for the validation dataset. The LR appears to give more reliable results than WofE, as it is more sensitive to intermingling between predictive factors.
Overall, the comparison of LR model type 1 with LR model type 2 yielded a high significance of forest cover. The reason is related to the reinforcing effect on slope stability of the diverse root systems of the trees and the associated forest vegetation, as stressed by various authors ([68], [69], [48]). This effect can be also described as an increase in the angle of internal friction or as a virtual increase in soil density ([34]).
Assessing the protective effect of mountain forests on slope stability using landslide susceptibility maps contributes to support resource managers in evaluating forest management practices and setting up suitable measures in forest planning. However, the method may have some limitations that should be stressed in order to correctly interpret the obtained map of forest protective function. The first limitation relates to the scale of analysis. This work was based on factor data available for the study area at different scales. As a result, the accuracy of boundaries in protective function within the map may be potentially misleading at a certain extent. The second key limitation is that the work evaluates forest cover only, and does not consider forest stand characteristics and management practices, since no data are available for the entire study area. On the other hand, it is worth to notice that research on stand characteristics (e.g., stand structure, crown cover, tree density and composition) that optimize the protective functions of forests for specific hazards ([7]) is only at the beginning of its route: stand over-maturity and over-stocking may determine the death and fall rate of large trees or the windthrow rate over large areas with a consequent prolonged loss in protection ([53], [12]), but root cohesion of old-growth forests is greater than that of post-harvest, second-growth stands ([67]).
Conclusion
The main objective of this study was to develop a multifactor empirical model to assess the relationship between forest cover and landslide detachment at stand scale. Multifactor methodologies typically estimate landslide susceptibility using the relationship between past landslide patterns and observed site characteristics.
The difference between models with and without the inclusion of forest cover as predictive factor has been exploited to spatially assess the potential role of forest stands in controlling landslide detachment. No comparable results or proposals can be found in the literature relative to this issue, despite a wealth of general references regarding landslide susceptibility assessment. By the empirical approach proposed here, we are able to extract the effect of forest cover on the probability of landslides.
To simultaneously sustain several different functions, large areas of forest should be managed as multi-purpose forests. Under such perspective, the spatial assessment of protective functions allows foresters to make conscious management decisions by comparing the relative importance of this distinctive function within the territorial context. Ultimately, the modeling approach proposed here can be used to pinpoint forest areas with high degree of protection against landslide occurrence on a stand scale, in which targeted policies and careful planning could be important in maintaining their effectiveness for providing protection under a multifunctional sustainable management framework.
Acknowledgements
This work was prepared in the Forestry Inventory and Information Systems Laboratory, University of Tuscia, under a contact between Department for Innovation in Biological, Agro-food and Forest systems (DIBAF) and Department of Agriculture, Forests, Nature and Energy (DAFNE).
CD carried out the design of the study and performed the statistical analysis, MS participated in the geological mapping, GS participated in the DEM pre-processing, PL and CP conceived the study, participated in its design and coordination, and helped to draft the manuscript.
References
Gscholar
Online | Gscholar
Online | Gscholar
Gscholar
CrossRef | Gscholar
Gscholar
Gscholar
Gscholar
Gscholar
Online | Gscholar
Gscholar
Gscholar
Gscholar
Gscholar
Gscholar
Online | Gscholar
Supplementary Material
Authors’ Info
Authors’ Affiliation
Luigi Portoghesi
Department for Innovation in Biological, Agro-food and Forest systems (DIBAF), University of Tuscia, v. S. Camillo de Lellis, snc - 01100 Viterbo (Italy)
Department of Science and Technology for Agriculture, forests, Nature and Energy (DAFNE), University of Tuscia, v. S. Camillo de Lellis, snc - 01100 Viterbo (Italy)
Honors Center of Italian Universities (H2CU), Sapienza University of Rome, v, Eudossiana 18, I-00184 Roma (Italy)
Department of Mechanical and Aerospace Engineering, Polytechnic Institute of New York University, Six MetroTech, Brooklyn, NY 11201 (USA)
Forestry Research Center (CREA SEL) The Council for Agricultural Research and Economics, v.le S. Margherita 80, I-52100 Arezzo (Italy)
Corresponding author
Paper Info
Citation
Cimini D, Portoghesi L, Madonna S, Grimaldi S, Corona P (2016). Multifactor empirical mapping of the protective function of forests against landslide occurrence: statistical approaches and a case study. iForest 9: 383-393. - doi: 10.3832/ifor1740-008
Academic Editor
Marco Borghetti
Paper history
Received: May 28, 2015
Accepted: Oct 20, 2015
First online: Jan 16, 2016
Publication Date: Jun 01, 2016
Publication Time: 2.93 months
Copyright Information
© SISEF - The Italian Society of Silviculture and Forest Ecology 2016
Open Access
This article is distributed under the terms of the Creative Commons Attribution-Non Commercial 4.0 International (https://creativecommons.org/licenses/by-nc/4.0/), which permits unrestricted use, distribution, and reproduction in any medium, provided you give appropriate credit to the original author(s) and the source, provide a link to the Creative Commons license, and indicate if changes were made.

Web Metrics
Breakdown by View Type
Article Usage
Total Article Views: 51118
(from publication date up to now)
Breakdown by View Type
HTML Page Views: 42553
Abstract Page Views: 3367
PDF Downloads: 4036
Citation/Reference Downloads: 22
XML Downloads: 1140
Web Metrics
Days since publication: 3801
Overall contacts: 51118
Avg. contacts per week: 94.14
Article Citations
Article citations are based on data periodically collected from the Clarivate Web of Science web site
(last update: Mar 2025)
Total number of cites (since 2016): 10
Average cites per year: 1.00
Publication Metrics
by Dimensions ©
Articles citing this article
List of the papers citing this article based on CrossRef Cited-by.
Related Contents
iForest Similar Articles
Review Papers
Remote sensing-supported vegetation parameters for regional climate models: a brief review
vol. 3, pp. 98-101 (online: 15 July 2010)
Review Papers
Accuracy of determining specific parameters of the urban forest using remote sensing
vol. 12, pp. 498-510 (online: 02 December 2019)
Review Papers
Remote sensing of selective logging in tropical forests: current state and future directions
vol. 13, pp. 286-300 (online: 10 July 2020)
Technical Reports
Detecting tree water deficit by very low altitude remote sensing
vol. 10, pp. 215-219 (online: 11 February 2017)
Research Articles
Estimating biomass of mixed and uneven-aged forests using spectral data and a hybrid model combining regression trees and linear models
vol. 9, pp. 226-234 (online: 21 September 2015)
Research Articles
Assessing water quality by remote sensing in small lakes: the case study of Monticchio lakes in southern Italy
vol. 2, pp. 154-161 (online: 30 July 2009)
Research Articles
Geostatistical techniques for estimating aboveground biomass in eastern Amazonia
vol. 19, pp. 85-93 (online: 13 March 2026)
Research Articles
Trends and driving forces of spring phenology of oak and beech stands in the Western Carpathians from MODIS times series 2000-2021
vol. 16, pp. 334-344 (online: 19 November 2023)
Research Articles
Afforestation monitoring through automatic analysis of 36-years Landsat Best Available Composites
vol. 15, pp. 220-228 (online: 12 July 2022)
Review Papers
Remote sensing support for post fire forest management
vol. 1, pp. 6-12 (online: 28 February 2008)
iForest Database Search
Search By Author
Search By Keyword
Google Scholar Search
Citing Articles
Search By Author
Search By Keywords
PubMed Search
Search By Author
Search By Keyword


