An overview of Italian participation in afforestation and reforestation projects under the Clean Development Mechanism
iForest - Biogeosciences and Forestry, Volume 9, Issue 5, Pages 720-728 (2016)
doi: https://doi.org/10.3832/ifor1654-009
Published: May 17, 2016 - Copyright © 2016 SISEF
Research Articles
Abstract
In order to meet its Kyoto Protocol commitment targets, the Italian Government has made relevant investments in forest projects in developing countries through the Clean Development Mechanism. This paper investigates the Italian participated afforestation/reforestation (A/R) projects under the Clean Development Mechanism of the Kyoto Protocol, by considering the countries hosting forestry projects, the project areas, the estimated emission reductions, the use of tree species (native/non-native), the issuance of Carbon credits, and the projects’ contribution to sustainable development and technology transfer in general, as stated by the “Project Design Document” of each project. This study utilizes the “Project Design Documents” and “Monitoring Reports” of the registered projects in the United Nations Convention on Climate Change database and data from the BioCarbon Fund database. Results show that, in terms of number of projects, the A/R sector is a prominent component of the Italian CDM portfolio. The financing of the 16 projects by the Italian government, with a total of about 65 k ha planted and an estimated emission reductions of about 556 k tCO2 eq per year, are based on criteria that differ substantially from the ongoing policy adopted for domestic forest interventions.
Keywords
CDM, Afforestation, Reforestation, Italy, Forest Policy, Impact Analysis
Introduction
To fulfill their commitments to limit greenhouse gas emissions under the Kyoto Protocol (KP) to the United Nations Convention on Climate Change (UNFCCC), according to article 3, paragraph 3, and article 3, paragraph 4 of the Kyoto Protocol ([25]), industrialized countries listed in the KP’s Annex I can use land-based activities, such as reducing deforestation, establishing new forests (afforestation and reforestation) and other vegetation types, and managing agricultural and forest lands to maximize their function as a “carbon sink” ([19]).
During the first KP commitment period (2008-2012) the Italian Government gave land-use, land-use change, and forestry (LULUCF) activities a prominent role. According to the data and information provided by the EEA ([7]), Italy accounts for the largest amounts of credits to be accounted from LULUCF activities within the 15 European Union member countries (EU-15). This amounted to 75.3 gigagrams (Gg) of carbon dioxide equivalent (CO2eq), which is about 26% of the aggregated LULUCF net removals of credits accounted by EU-15 (293mGg CO2eq - [7]).
In addition to activities within Italy, in order to meet its KP commitment targets, the Italian Government has also invested in forest projects in developing countries through the Clean Development Mechanism (CDM), one of the three market-based policy tools of the KP. This flexible mechanism allows public and private entities from Annex I Parties to finance greenhouse gas reduction activities, including forest activities ([24]), in non-Annex I developing countries. In return, Annex I Parties obtain certified emission reductions (CERs) that are countable against emissions targets.
The CDM is also the main source of funding for the UNFCCC Adaptation Fund, which according to UNFCCC ([23]) finances adaptation projects in developing country that are particularly vulnerable to the adverse effects of climate change. The Adaptation Fund is financed by a 2% levy on CERs issued by the CDM.
The CDM has been implemented using hundreds of different methodologies ([32]), with more than 7600 emission reduction projects registered in over 90 countries, with about 1.6 billion CERs issued ([29]).
During the KP’s first commitment period ([25]), and so far also for the second commitment period ([30]), afforestation and reforestation (A/R) projects were the only forest investment types allowed in CDM, excluding activities such as Reducing Emission from Deforestation and Forest Degradation (REDD) and Improved Forest Management (IFM).
Despite the success of the CDM, globally the number of registered forestry-based projects under this mechanism has been limited. According to the UNFCCC ([29]), only 55 A/R projects were registered. In the opinion of many stakeholders, one of the main reasons for the failure of A/R in the CDM has been the complexity of preparing these projects ([33]). This includes financial, administrative, and governance issues, such as the mechanism’s bureaucracy, the temporary nature of forestry-based credits, and the length of time an A/R CDM project takes to gain revenue. As a result A/R CDM project have high transaction costs ([9], [22]) and constraints associated with knowledge and skills, such as the complexity of early methodologies and other social factors ([22], [37]).
Other reasons include the restriction of forestry projects to only A/R activities, and their exclusion from the EU Emissions Trading Scheme, both of which made CDM a niche topic ([2]).
In addition to the emission reduction objective, the other complementary goal of CDM is to contribute to sustainable development in the host countries. There is still no universally accepted definition to determine whether a CDM project will contribute to sustainable development ([5], [10], [31]). Given this lack of an agreed operational definition on how to assess the CDM contribution to sustainable development, according to UNFCCC ([31]), two types of assesment are possible on a project-by-project basis: (1) “how” a CDM project contributes to sustainable development; and (2) “how much” a CDM project contributes to sustainable development ([15], [31]).
For the first type of assessment, a list of sustainable development indicators to be matched to evaluate the nature of the project contribution is required. The results of such assessment performed by UNFCCC ([31]) showed that almost all CDM projects claim a number of sustainable development benefits in the Project Design Documents (PDDs), but the sort of benefits changes according to project type. For the A/R sector, the most common claim is “stimulation of the local economy through employment creation and poverty alleviation”, followed by “reduction of pollution”, and also “engagement of local population” ([31]).
A potential co-benefit of CDM is the transfer of technology and know-how to the host countries ([28]). The Intergovernmental Panel on Climate Change (IPCC) defines technology transfer “as a broad set of processes covering the flows of know-how, experience and equipment for mitigating and adapting to climate change amongst different stakeholders such as governments, private sector entities, financial institutions, non-governmental organizations and research/education institutions” ([28]).
The CDM does not have an explicit technology transfer mandate, but it can contribute to technology transfer by financing emission reduction projects that utilize technology not currently available in the host countries. Project participants are requested to include in the PDDs the description of how technology and know-how is transferred to the host Party ([27]), therefore reflecting the implicit definitions of technology transfer made by the project participants ([28]). Technology transfer is a very heterogeneous concept across project types and usually involves both knowledge and equipment ([20]). According to the UNFCCC ([28]), A/R projects are less likely than average to involve technology transfer, as compared to bioenergy, energy, cement, fugitive gas, and hydro projects.
For assessing “how much” a CDM project contributes to sustainable development, “a number of indicators, a quantitative or qualitative measure for each indicator, and weights that allow the scores for the different indicators to be aggregated into an overall measure of the extent of the contribution to sustainable development” is needed ([31]). Only a few studies have attempted such an assessment, and they concluded that despite the number of claims in the PDDs, the contribution of the CDM to sustainable development in the host countries has been limited ([21], [14], [8], [3]). In particular, Sutter & Parreño ([21]) assessed the first 16 registered CDM projects (which includes every type of CDM), finding that a large part of the projects likely led to real and measurable emission reductions, while less than 1% were likely to contribute significantly to sustainable development in the host country, and none were fulfilling the two objectives simultaneously.
The responsible party in Italy for the financing of CDM projects is the Ministry for the Environment, Land, and Sea. In 2003 the Ministry entered into an agreement with the World Bank to create the “Italian Carbon Fund” which is intended to purchase greenhouse gas emission reductions from projects in developing countries and countries with economies in transition that may be recognized under KP’s CDM. The Fund is a public-private partnership administered by the World Bank. The forestry sector does not enter in the scope of the Italian Carbon Fund ([35]), but is part of another carbon fund to which Italy contributes, know as the BioCarbon Fund (BioCF). The BioCarbon Fund, administered by the World Bank is a public-private sector initiative mobilizing financing, and it was the first carbon fund in the world to focus on land use ([39]). On behalf of its investors, the BioCF purchases carbon emission reductions from projects in developing countries through the so called Emission Reductions Purchase Agreements (ERPAs). The emission reductions are subsequently transferred by BioCF to the participants pro rata their financial participation in the Fund ([37]). The BioCF investors can choose to use these reductions within the Kyoto Protocol or for other greenhouse gas emission reduction regimes ([39]). The payment benefits the project stakeholders (that is, contractual partners: governments, private companies, NGOs, research institutions, local communities, and landowners) as per benefit-sharing arrangements agreed with each individual project ([39]). The mechanism works as illustrated in Fig. 1.
Fig. 1 - The BioCarbon Fund mechanism for financing A/R CDM projects.
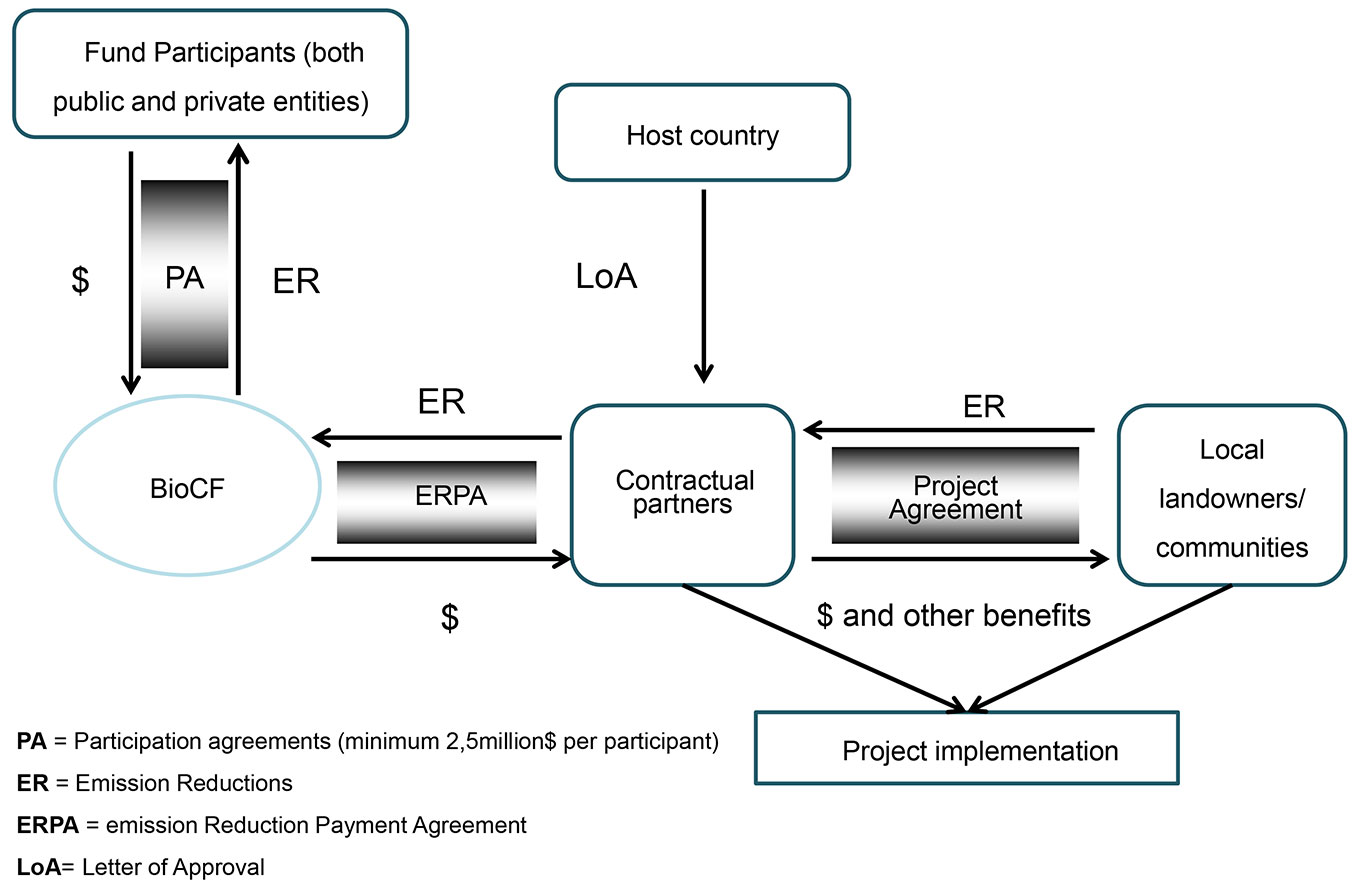
BioCF is divided in two tranches: Tranche one started operations in May 2004, with a capital of US$ 53.8 million; Tranche two started in March 2007 with a capital of US$ 29.5 million ([39]). Within each Tranche there are two windows: the first focuses on CDM eligible projects, while the second on non-CDM projects. The participants to BioCF window one typically use their purchase for meeting Kyoto targets ([37]).
Participants to the BioCF (both public and private sector) are required to commit a minimum of US$ 2.5 million into the Fund ([36]). According to World Bank ([39]), the BioCF Fund invested about US$ 90 million in 25 projects that have restored 150 k hectares of degraded lands and reduced deforestation in over 350 k hectares of land. Some 80% of the BioCF funding has been utilized for A/R projects under the CDM, and thus far BioCF is the main funding source for A/R CDM activities.
Each CDM project may not be entirely financed by the BioCF, but also by external public and private entities, as well as by other WB Carbon funds, in variable proportions. For each CDM project, the entire amount of the emission reduction is not purchased by the BioCF.
The purpose of this study is to provide an overview of the Italian participated afforestation and reforestation CDM projects. Questions which are addressed by this overview include: where are the projects located? How large they are? Is the afforestation and reforestation a prominent component of the Italian CDM portfolio? How many tons of CO2eq do the projects fix and how many CERs do they issue? Which tree species are used, and are they native or non-native to the host countries?
We also look at the financing with respect to Italian investments, management, and at benefit sharing, in terms of emission reductions received back by Italy.
We also aim at understanding whether other benefits were claimed to be delivered, in terms of “how” the projects are likely to contribute to sustainable development and technology transfer. However, given that the nature of the methodology is qualitative, there is no basis to estimate a concrete quantitative value of how much the projects contributes to sustainable development.
Methodology
This study utilizes the UNFCCC database ([29]), and data from the official Project Design Documents (PDDs, where project activities are described in detail - [24]), and Monitoring Reports (MRs). Only registered projects were considered in this study. For the carbon financing, the BioCF database was utilized ([39]), together with official BioCF and Italian Government documents.
To assess how the projects contribute to sustainable development objectives, the approach of UNFCCC ([31]) was followed. A text analysis of the PDDs was made, categorizing the statements using a set of 10 indicators used by UNFCCC ([31]), which was built using inputs, among the others, from Alexeew et al. ([1]), Olsen & Fenhann ([15]), Sutter & Parreño ([21]). The indicators cover the economic, environmental, and social development dimensions of sustainable development (Tab. 1) and they are based on information in the PDDs, which reflects the expected contributions at the time the project is being validated.
Tab. 1 - Sustainable dimensions and indicators for CDM projects (source: [31]).
| Dimension | Indicator | Description |
|---|---|---|
| Economic | Stimulation of the local economy including job creation and poverty alleviation | Economic improvements for the population through: direct or indirect job creation or retention of jobs, during the operation and construction phases; domestic or community cost savings; poverty reduction; financial benefits of the project for the national economy of the host country; enhancement of local investment and tourism; improvement of trade balance for the country; reinvestment of clean development mechanism proceeds into the community; creation of tax revenue for the community |
| Development and diffusion of technology |
Development, use, improvement and/or diffusion of a new local or international technology, international technology transfer or development of an in-house innovative technology | |
| Improvement to infrastructure | Creation of infrastructure (e.g., roads and bridges) and improved service availability (e.g., health centres and water availability) | |
| Environment | Reduction of pollution | Reducing gaseous emissions other than greenhouse gases, effluents, and odour and environmental and noise pollution; and enhancing indoor air quality |
| Promotion of reliable and renewable energy |
Supplying more or making less use of energy; stabilizing energy for the promotion of local enterprises; diversifying the sources of electricity generation | |
| Converting or adding to the country’s energy capacity that is generated from renewable sources; reducing dependence on fossil fuels; helping to stimulate the growth of the renewable power industries | ||
| Preservation of natural resources | Promoting comprehensive utilization of the local natural resources (i.e., utilizing discarded biomass for energy rather than leaving it to decay, utilizing water and solar resources); promoting efficiency (e.g., compact fluorescent lamps rather than incandescent lamps); recycling; creating positive by-products; improvement and/or protection of natural resources, including the security of non-renewable resources such as fossil fuels, or of renewable resources such as: soil and soil fertility; biodiversity (e.g., genetic diversity, species, alteration or preservation of habitats existing within the project’s impact boundaries and depletion level of renewable stocks like water, forests and fisheries); water, availability of water and water quality | |
| Social | Improvement of health and safety |
Improvements to health, safety and welfare of local people through a reduction in exposure to factors impacting health and safety, and/or changes that improve their lifestyles, especially for the poorest and most vulnerable members of society; improved human rights |
| Engagement of local population | Community or local/regional involvement in decision-making; respect and consideration of the rights of local/indigenous people; promotion of social harmony; education and awareness of local environmental issues; professional training of unskilled workers; reduction of urban migration | |
| Promotion of education | Improved accessibility of educational resources (reducing time and energy spent by children in collecting firewood for cooking, having access to electricity to study at night, and supplementing other educational opportunities); donating resources for local education | |
| Empowerment of women, care of children and the frail | Provision of and improvements in access to education and training for young people and women; enhancement of the position of women and children in society |
The indicator “development and diffusion of technology”, was analyzed separately. According to the approach used by the UNFCCC ([28]), projects that expect to involve technology transfer were classified according to the characteristic of the technology transferred: “no transfer”, “transfer of equipment only”, “transfer of knowledge through training”, and “transfer of both knowledge and equipment”.
Results and discussion
Italy participates in 16 A/R CDM projects, about one third of all the A/R CDM projects carried out globally. Projects are developed, in variable partnerships, with other countries: Canada, France, Ireland, Luxembourg, Japan, Netherlands, Norway, Spain, Switzerland and United Kingdom. Tab. S1 in Appendix 1 briefly describes the Italian participated projects.
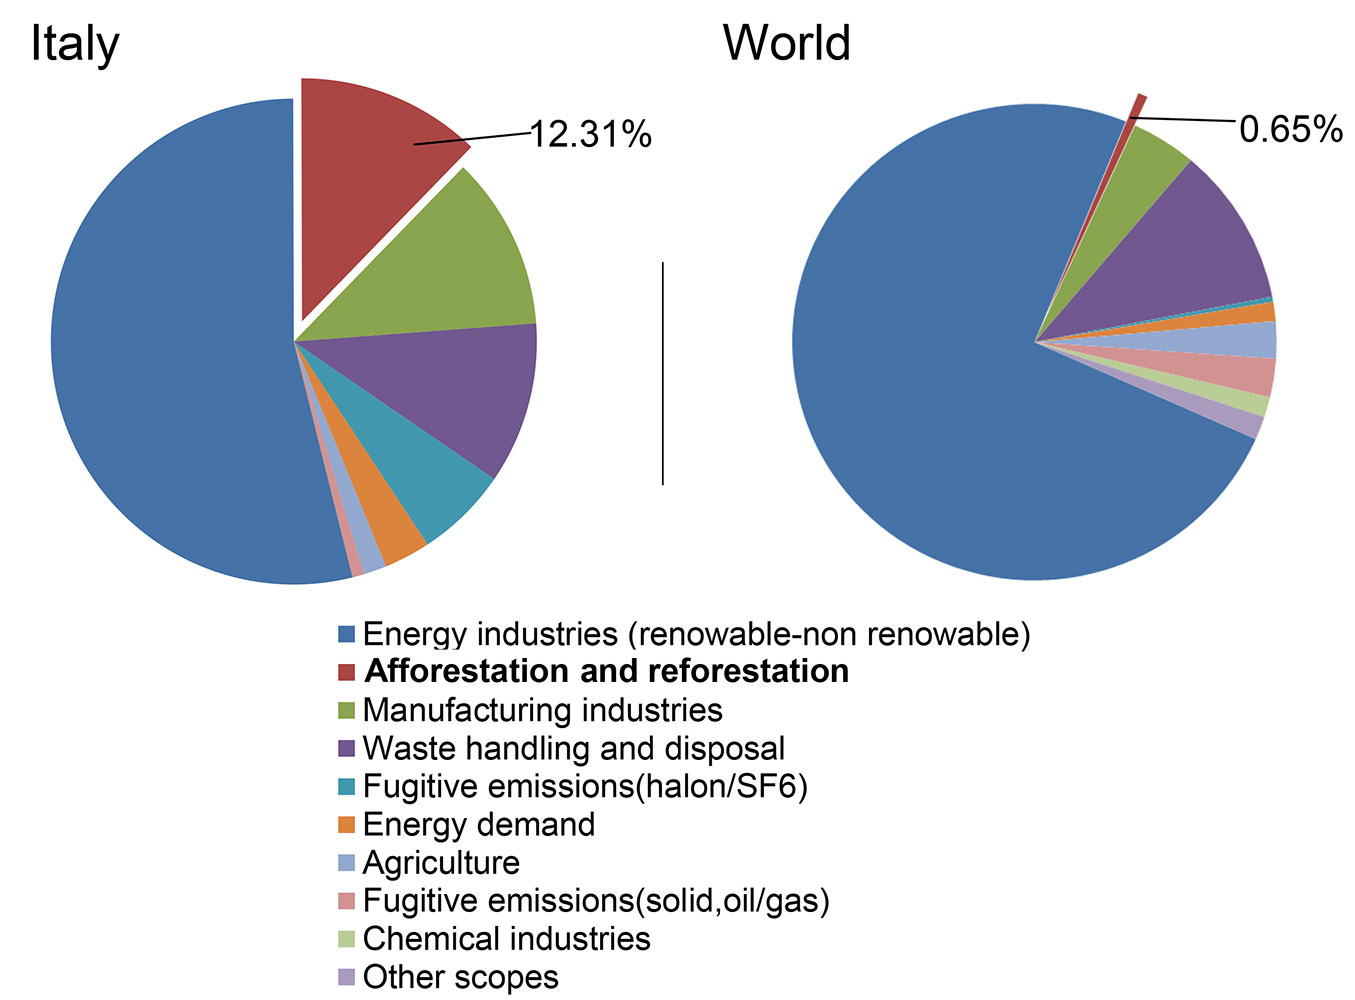
Afforestation and reforestation projects play a prominent role in the Italian CDM portfolio, being the sector with the second highest number of projects after energy industries. The share of A/R projects on the total of CDM projects is relatively high (12.5%) when compared with the global scenario (Fig. 2).
Fig. 2 - Proportion (%) at the Italian and global level of registered CDM projects, by scope. Afforestation and reforestation scope is highlighted.
The projects with Italian participation are located in 10 countries. The first Italian participation began in late 2006 with the project “Facilitating Reforestation for Guangxi Watershed Management in Pearl River Basin” in China, the first registered A/R CDM project in the world. In 2011 a large number of projects were registered by Italy (nine in total), which is in line with the international trend (18 news projects globally - [29]), as many projects were pursuing registration ahead of the end of the KP’s first commitment period ([17]).
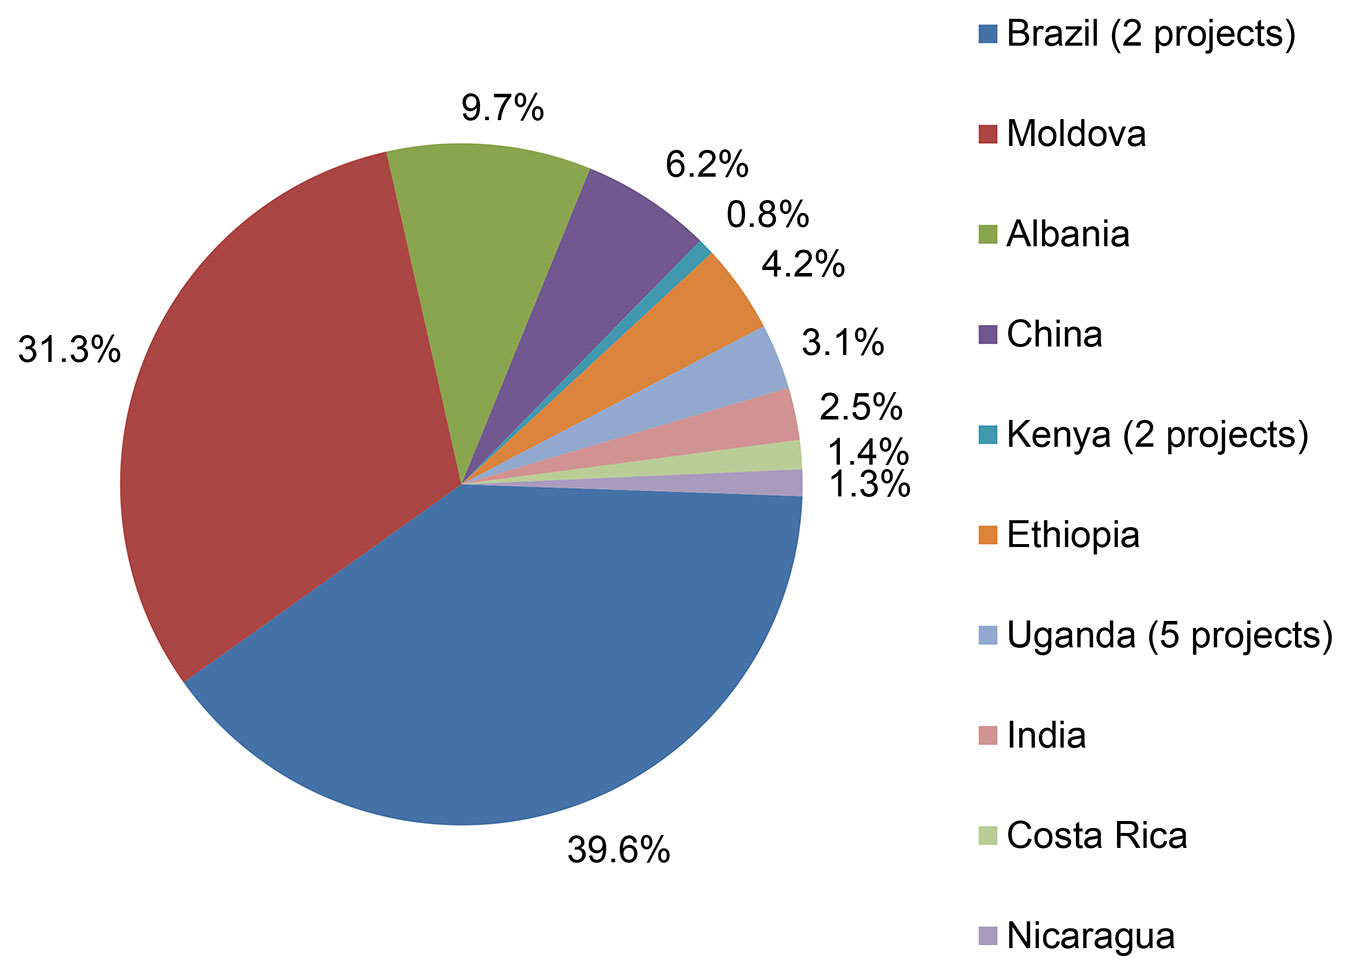
According to the PDDs, the total planted surface was 64.777 ha, which is more than the total of newly planted forests in Italy under the EU Rural Development Programme for the period of 2007-2013, i.e., 30.000 ha up to 2011 ([4]), which is the most recent data available. More than 70% of the total surface was included in 3 projects, located in Brazil and in the Republic of Moldova (Fig. 3).
Fig. 3 - Distribution (%) of Italian participated CDM forest project surfaces, by host countries.
From an assessment of eleven MRs, a general decrease in the planted areas in relation to the planned ones was found (Fig. 4). In particular, the monitoring report of the project “AES Tietê Afforestation/Reforestation Project in the State of São Paulo” highlights a significant planted area reduction, equivalent to more than 85% of the planned surface. Most of the area was still not planted at the MR’s editing time, but the auditor considered this a minor restriction, and he did not ask for corrective actions. Excluding this Brazilian case, the others projects show an average reduction in surface area of 11.6%.
Fig. 4 - Italian participated CDM forest planted surfaces, according to PDD and MR statements.
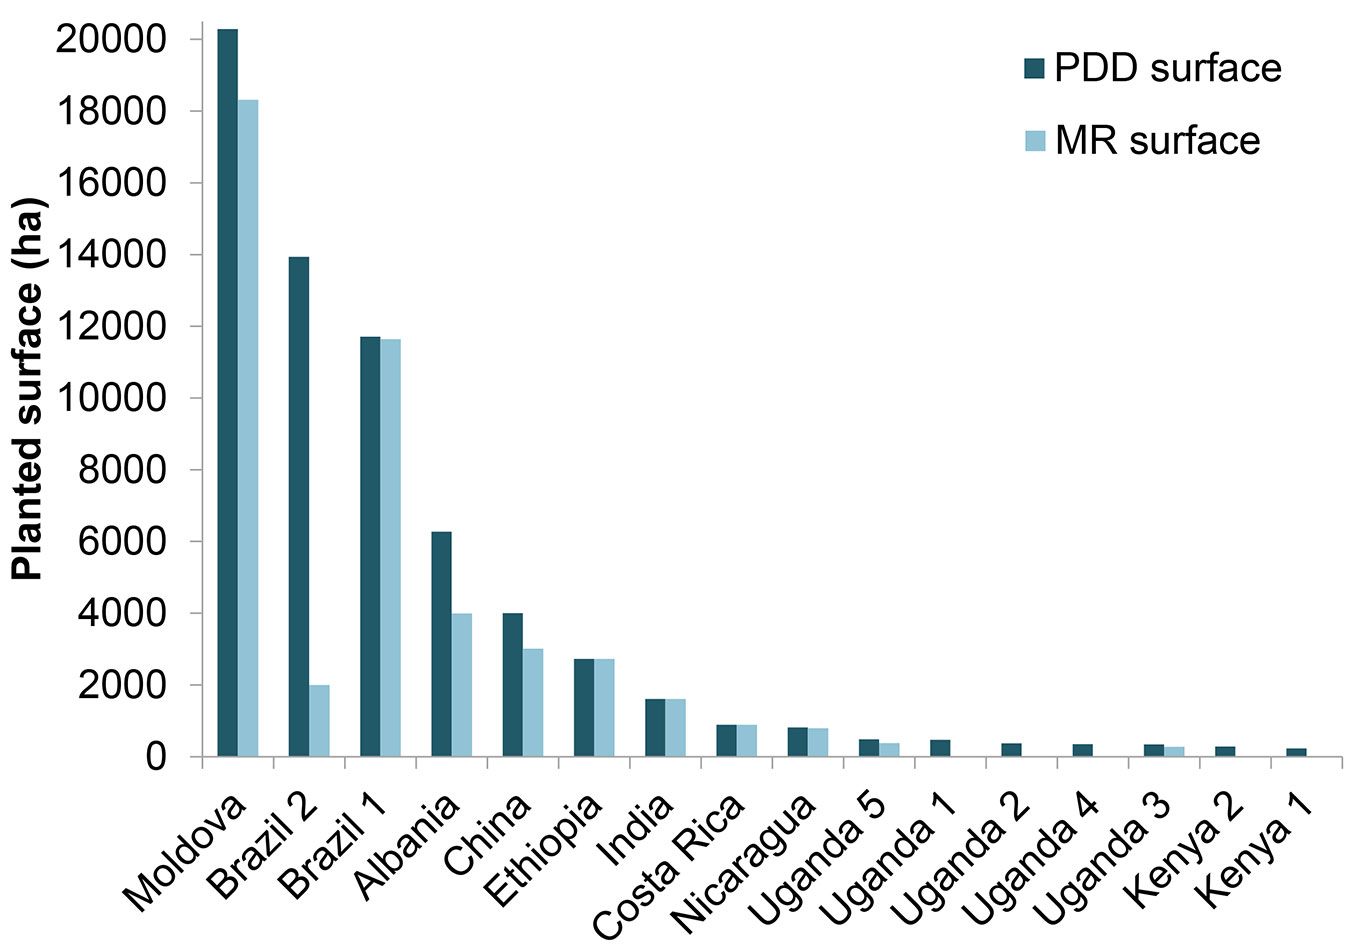
The MRs also show that in many projects with Italian participation other parameters have been changed from the PDDs redaction, such as changes in species composition, stocking density, timing and selection of silvicultural operations, project boundaries, parameters, equations, or methods used in tree biomass estimation etc. This reveals a degree of variability in the A/R CDM projects. World Bank ([37]) states that because of their dynamic nature, in general A/R projects are likely to deviate from the PDD at implementation. This can happen in projects that involve several farmers who may neglect the agreed land-use contract in favor of other alternatives. Other causes can also lead to deviation from the PDD and to the difficulty of implementing the MR, such as the lack of capacity of local stakeholders for dealing with forest inventories and forest emission estimations ([37]).
Each project, depending to its objectives, utilized different tree species in varying proportions. In the PDDs the species are listed and the project developers report if they are native or non-native to the host country. Tab. S1 in Appendix 1 reports the specific species used in each project.
According to the PDDs, about 55% of new forests were planted with non-native species. The non-native species mainly used are Eucaliptus spp., Pinus nigra, Pinus caribaea var. hondurensis, Robinia pseudoacacia, Gleditschia triachantos, Sophora japonica, and Elaeagnus angustifolia. Five projects use exclusively non-native trees (Fig. 5).
Fig. 5 - Proportion (%) of native and non-native species used in the registered Italian participated CDM forest projects.
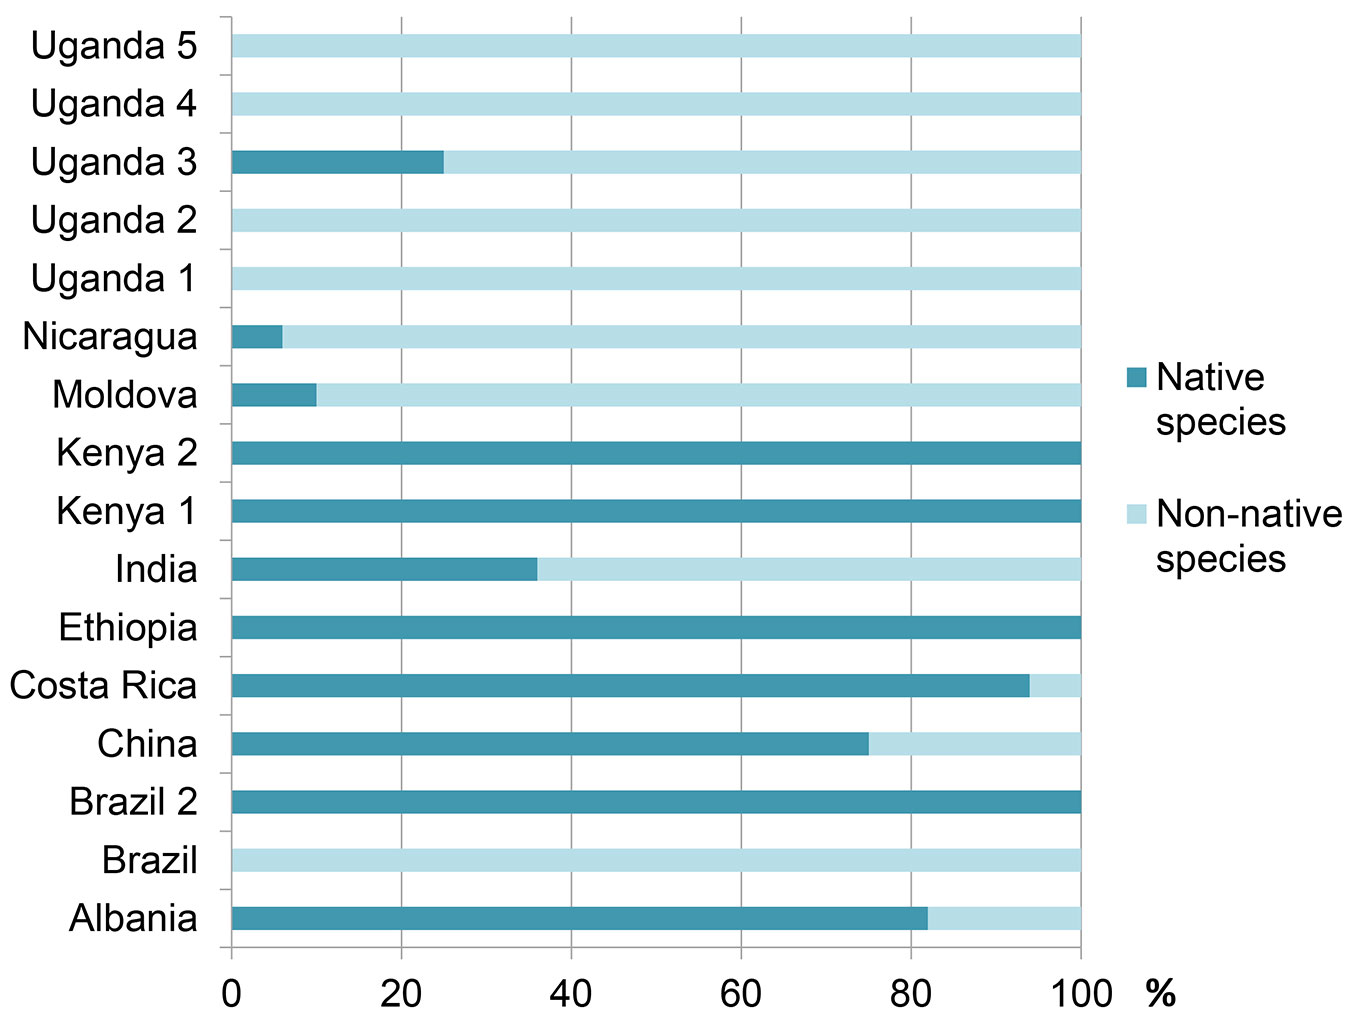
Some of the PDDs report that the non-native species used are naturalized or widely adapted in the country, such as in Moldova: “The long-term experience of forest management in Moldova has shown that Robinia is widely adapted to poor sites, on which other species cannot be established through cost effective means”; or in Ethiopia: “The naturalized species such as Grevillea robusta and Eucalyptus globulus are also considered for planting […]”.
However, there is no common definition among CDM projects of what “naturalized” means for project developer. If the definition of Richardson et al. ([18]) is used: “Alien plants that reproduce consistently (cf. casual alien plants) and sustain populations over many life cycles without direct intervention by humans (or in spite of human intervention); they often recruit offspring freely, usually close to adult plants, and do not necessarily invade natural, semi natural or human-made ecosystems”, this can involve either positive or negative effects on the local ecosystems, and therefore it should be further specified by CDM project developers.
Project developers justified the use of non-native species using several arguments, with the primary justification being the fast growing characteristics of the selected non-native species, which results in high productivity and fast generation of CERs. Also relevant for their selection were other beneficial market characteristics, the preferences of the local communities, as well as the mitigation of risks. To illustrate, the following statements are examples taken from the PDDs; India project: “During the PRA process, the scoring assessment on tree species also indicated that local farmers/communities prefer tree species that grow fast and have good market, such as Eucalyptus spp., Casuarina […]”; China project: “Eucalyptus was chosen for the project area at the request of local communities who prefer it due to the fact that it can generate a significant amount of CERs in the early stage of the crediting period, compared to other species that grow relatively slow in the first several years”; Brazil1 project: “The choice of species is aimed at achieving the highest productivity of sustainable biomass in order to accomplish self-sufficiency of charcoal consumption […] demanding the smaller land possible. Therefore, mainly Eucalyptus urograndis hybrid cloned sprouts are used […]”. Uganda project: “In general, experiences with forest plantations based on native tree species are very limited in Uganda and the East African region […]. Further increasing the proportion of native tree species would increase the project risk due to the uncertainty with regards to growth performance and pests. […]”.
The World Bank ([37]) observed that a consistent part of the total CDM A/R surface worldwide is planted with non-native species and states that a reason may also be the lack of suitable data on native species, especially with regard to biomass expansion factors. This may force some projects to reduce the portion of the project area that is planted with native species.
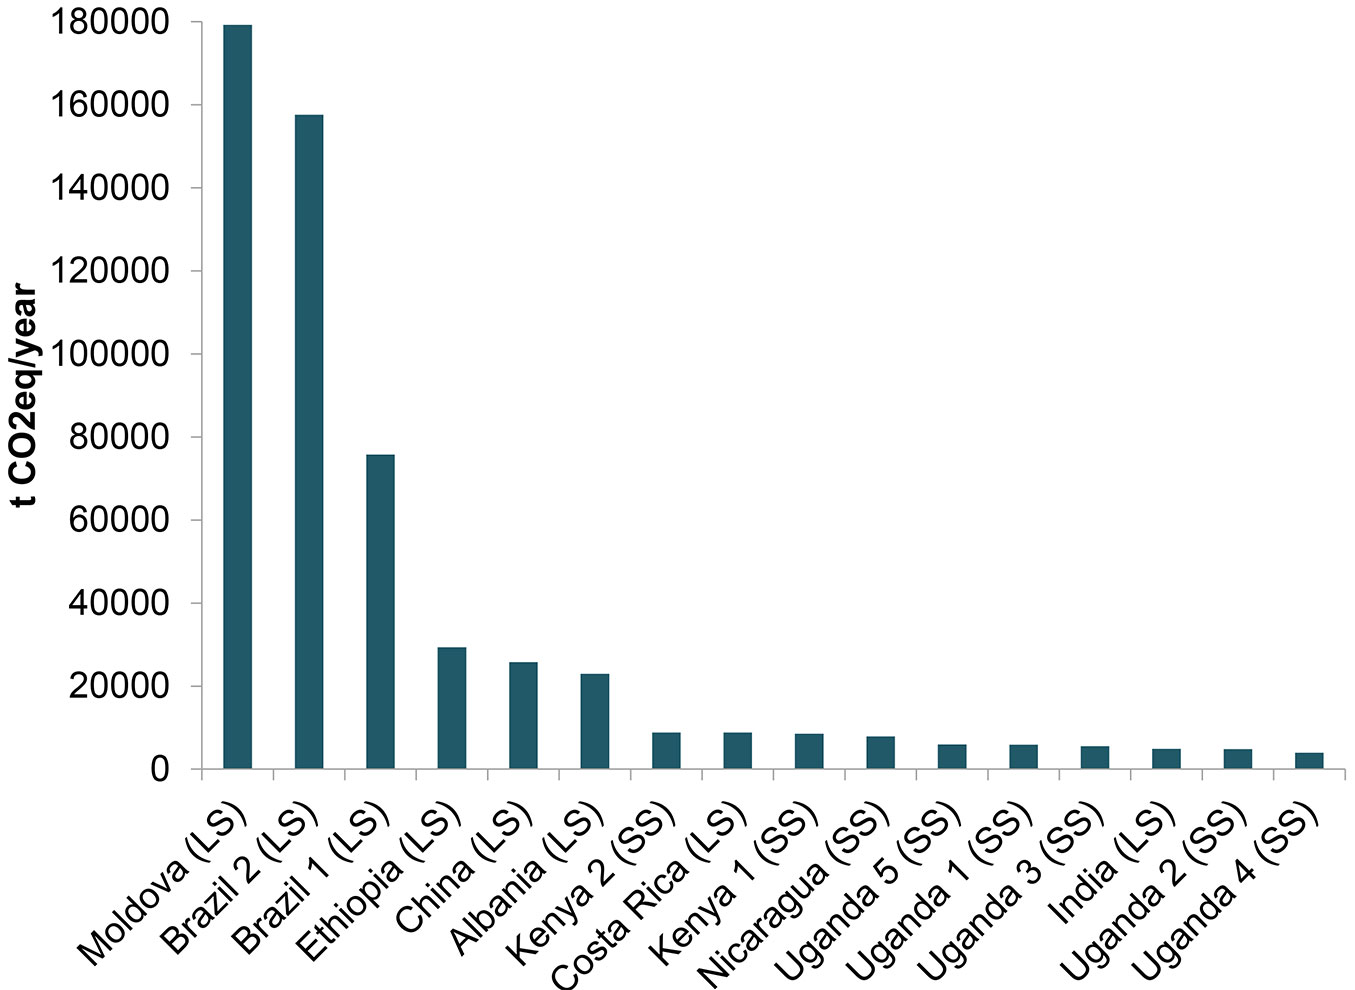
As stated in the PDDs, the total estimated emission reductions per year is about 556 k tCO2 eq, distributed as shown in Fig. 6. According to the PDDs, only 3 projects reach an annual fixation total higher than 60 k t CO2 eq, and 10 projects stock less than 10 k tCO2/year. This is due to the project methodologies adopted. Half of the projects with Italian participation adopted a small scale methodology, and the other half a large scale methodology. Small-scale A/R methodologies provide simplified approaches for project design and monitoring. Small-scale A/R project activities must fulfill two conditions: net anthropogenic removals must be less than 16 k tons of CO2eq per year; and the project activities must be developed or implemented by low-income communities and individuals, as determined by the host Party ([26]). Fig. 6 shows that projects reaching an annual fixation lower than 9 k tCO2eq are those which adopted a small scale methodology (with the exception of the Costa Rican and Indian projects). Regardless, these projects did not take advantage of the full potential allowed by the methodology requirements, remaining well below the threshold of 16 k tCO2eq per year.
Fig. 6 - Emission reductions per year in the Italian participated CDM registered forest projects, according to the statements in the PDDs. (LS): Large Scale; (SS): small Scale.
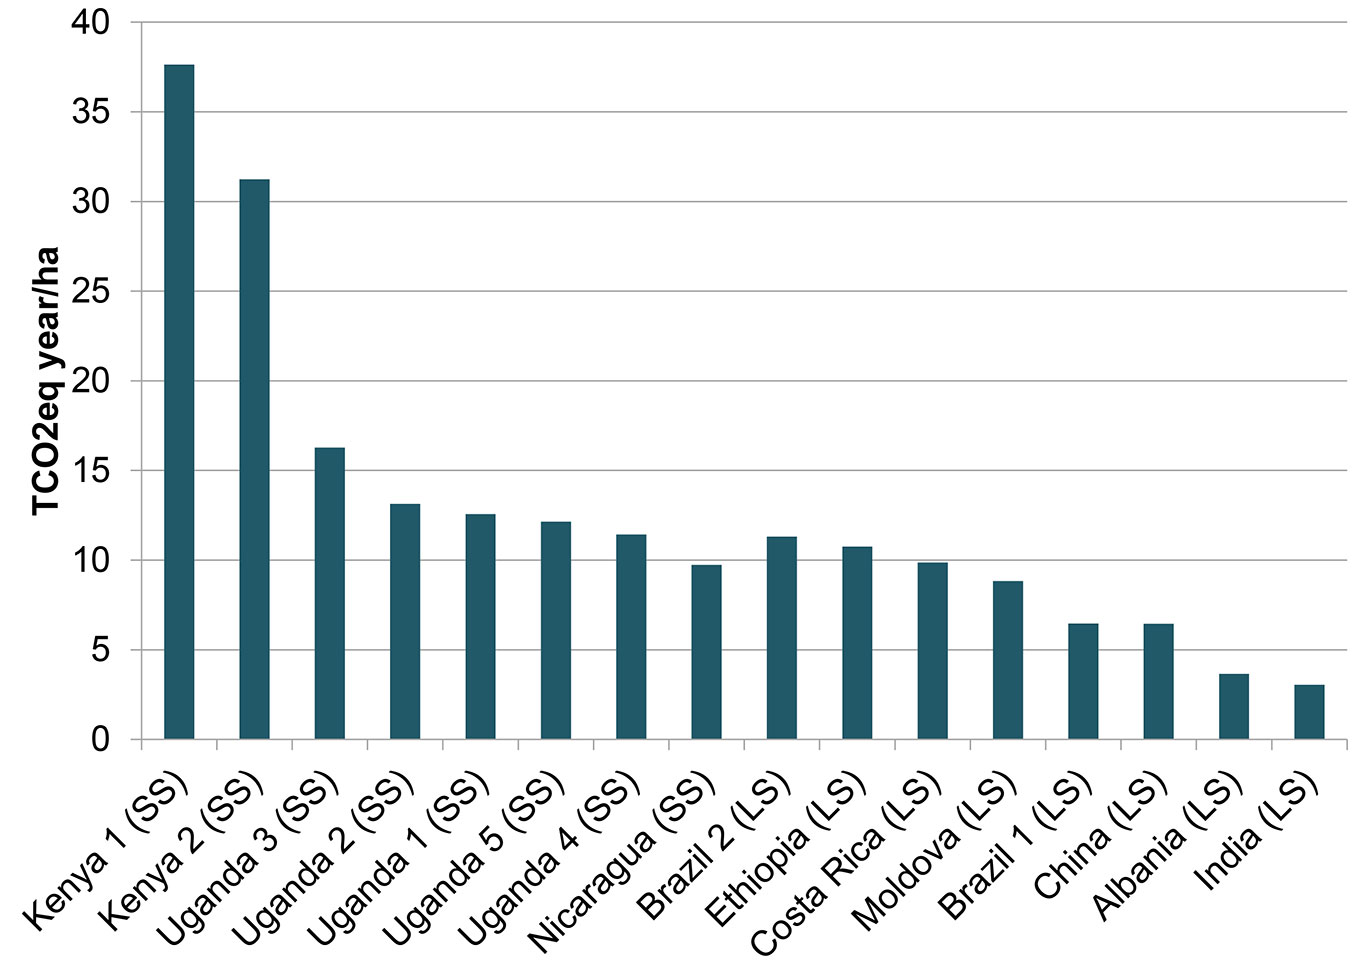
The amount of sequestration per hectare per year ranged widely across the projects, from 3 to 37 tCO2eq/ha/year. According to the PDDs, the Kenyan projects achieved the highest sequestration per hectare, while the Indian project had the lowest (Fig. 7). This wide range has been observed also across all BioCF A/R projects, and according to the World Bank ([37]) it mainly depends on the design and objectives of the project, the species used, and the productivity of the site.
Fig. 7 - Emission reductions per hectar per year in the Italian participated CDM registered forest projects, according to the statements in the PDDs. (LS): Large Scale; (SS): small Scale .
For all of the projects analyzed, the participants decided to use temporary CERs (tCERs) instead of long term CERs (lCERs). tCER is a certified emission reduction that expires at the end of the commitment period following the one during which it was issued; lCER is a CER that expires at the end of the crediting period for which it was issued ([24]). The decision of using tCER is in line with the international trend, which attests that the use of tCERs is largely preferred, because it is considered a more flexible commodity. From the buyer’s perspective, the shorter lifespan of tCERs seems to be more compatible with the carbon market and land-use-change dynamics and with the project risks, since determining prices for lCERs requires long-term information that is not always easily available ([37]).
By December 31st, 2012, not all of the projects had successfully secured their first issuance. This is in line with the international situation, and according to the World Bank ([37]) delays at registration and issuance are significant due to the stringent scrutiny of projects by the Executive Board of the CDM. Projects are subjected to a “completeness check”, and project developers are overwhelmed with the validation process and do not present the required documentation, therefore failing the process.
The first temporary CER was issued in a project in Brazil in April of 2012 (Brazil 1). The successful project, which consists in a reforestation of hybrid clones of Eucalyptus as a renewable source of wood supplies for industrial use, was registered in 2010 and in two years obtained 4.1 million issued tCERs. The quantity of tCERs issued from the Brazil1 project accounts for about 72% of the total of tCERs issued by the Italian A/R CDM projects.
Regarding the financing and the benefit sharing, the UNFCCC database shows that all the A/R CDM projects with Italian participation are funded by the BioCF, with the International Bank for Reconstruction and Development (IBRD) acting as the managing company, as a Trustee of the BioCF. One project (Moldova Soil Conservation Project) is also financed by another Fund, the Prototype Carbon Fund (PCF).
The Ministry for the Environment, Land, and Sea, on behalf of the Government of Italy, is the only authorized Italian participant in the BioCF. Thus in the BioCF there are no other Italian public or private entities involved. Italy’s participation in the first Tranche of the BioCF, and the Italian participation in other projects are all funded by this Tranche, with the exception of the two Kenyan projects and one of the Ugandan Projects (Nile Basin Reforestation Project No 4), for which there are no references in the BioCF database ([39]). However, we believe it was a documentation oversight.
The BioCF, through the Emission Reductions Purchase Agreements (ERPAs), purchases only a part of the carbon credits generated by the projects ([39]). The amount purchased is illustrated in Fig. 8, according to data of the BioCF database ([39]).
Fig. 8 - Proportion (%) of emission reduction purchased by BioCF, through the Emission Reductions Purchase Agreements (ERPAs), per project. Four Ugandan projects are considered by the BioCF database as a unique project. The database does not provide data about one of the Ugandan projects and the two Kenyan projects.
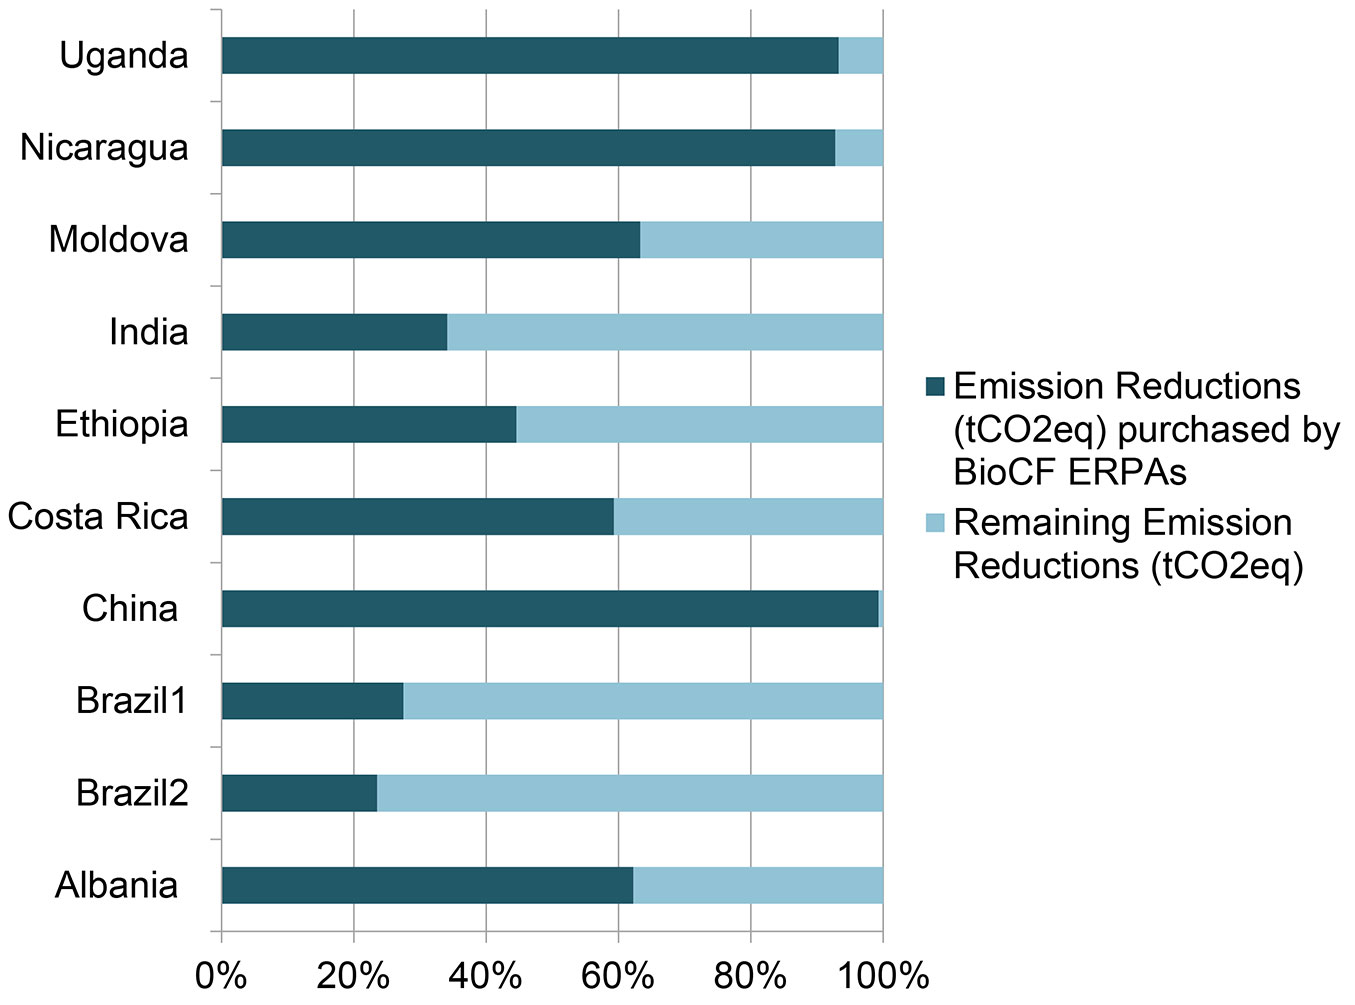
The remaining part of the emission reductions generated by the projects is sold by the other entities involved, according to the contractual agreement. For instance, in the Ethiopian project it is the local community that sells the remaining emission reductions not purchased by the BioCF ([38]). However, this kind of information was available for only a few of the projects assessed.
Regarding the management and the project participation, 69% of the projects with Italian participation are government and non-profit-led, while the remainder are private sector-led projects (Tab. S1 in Appendix 1). According to the World Bank ([37]), in most cases A/R CDM projects led by governmental agencies performed relatively less well than private sector-led projects, with the exception of the countries with centralized governance. In cases where the project developer is not the government, the World Bank states that success primarily depends on building a constructive collaboration with governmental entities. Private-public partnerships with clear responsibilities for each partner were stated as being the most effective arrangement.
According to a 2009 report of the Italian Supreme Audit Institution ([6]), Italy invested US$ 2.5 million in the BioCF (the minimum possible for entering the BioCF). There are no recent public data that report whether this financing has increased over time, so it has to be assumed that the Italian investment amount remains at the minimum of US$ 2.5 million. The same document report that the participation of Italy in the three WB Funds that finance CDM projects in which Italy is involved (Community Development Carbon Fund, Italian Carbon Fund and BioCarbon Fund) for the period 2008-2012, allowed Italy to receive back 4.5 Mt CO2 eq year-1. However, there is neither specification regarding the share of reduction attributable to each fund, nor to the distribution of tCERs between the parties involved. Consequently, is not possible to determine the exact amount of tCERs that Italy receives from the A/R CDM projects.
The exact amount of Italian-pertinent emission reductions is unknown. However, even accounting for the whole amount of estimated emission reductions produced by the A/R projects, such amount does not have a high impact when compared to the whole Italian CDM sector. In total, the Italian participation in CDM projects in all the sectors achieved a reduction of 55.6 MtCO2 eq per year, of which the A/R projects accounted for a very small part, less than 1%.
Regarding the analysis of statements related to sustainable development, Fig. 9 shows the number of projects that mentioned economic, social, and environmental indicators.
Fig. 9 - Number of Italian-participated CDM registered forest projects with sustainable development claims in PDDs, by indicator.
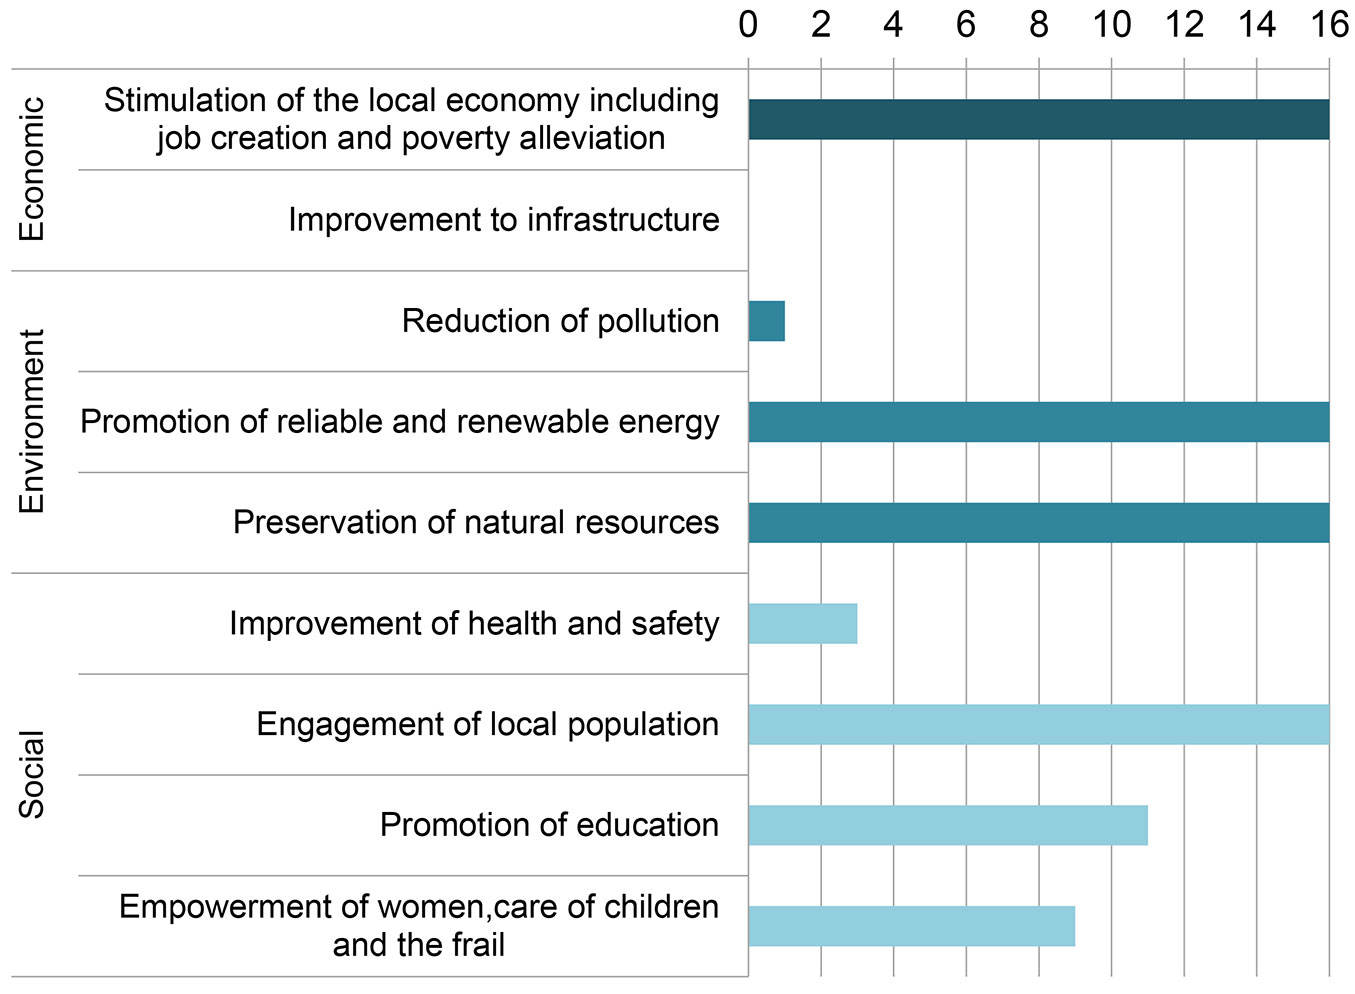
All of the projects analyzed claimed as co-benefit the “stimulation to the local economy, including job creation and poverty alleviation”, and the “engagement of local population”. This is in line with the international A/R CDM sector, in which these are the most cited benefits ([31]). In addition, all of the Italian projects claimed the “preservation of natural resources”, and the “promotion of reliable and renewable energy”. Nevertheless, it is important to consider some specifications. According to the PDDs, the “preservation of natural resources” is obtained through the shift from pressure over natural forest resources towards the newly planted forest. The A/R activity itself is seen as an action of preserving natural forests. Only a few projects also reported other environmental benefits, such as restoration of protected areas.
The “promotion of reliable and renewable energy” is typically attributed to increased production of fuelwood and firewood from new planted forests (e.g., “the project would start producing several benefits such as small timber and firewood”). No sources of renewable energy other than products from the new forests were claimed.
About half of the projects also claimed the creation of employment for women. As increased employment can lead to the enhancement of the position of women in society, it was considered in the indicator “empowerment of women, care of children and the frails”. However, the process of empowerment is difficult to measure directly ([16], [11]). The employment of women can be considered only as an indirect and weak proxy of empowerment. Further data and information should be made available to describe the changes in the level of empowerment to make a more accurate determination.
The “promotion of education’s” statements are related to the establishment of training services for people working on the project. These trainings are always only related to the project activities.
Two projects stated that the A/R activities are likely to mitigate the risk of landslides and floods, and therefore were considered relevant to the “improvement of health and safety” condition. One project claimed the benefit of “the restoration of a healthy ecosystem”. No project claimed the “improvement of infrastructures” (roads, bridges, etc.) benefit. Only one project specifically stated the benefit of “reduction of pollution” in water bodies.
It has to be mentioned that none of the projects had an official UNFCCC “CDM Sustainable Development co-benefits description report”. This report is voluntarily prepared by CDM project participants and managing entities to describe co-benefits in a consistent and structured way, using the sustainable development co-benefits tool ([34]).
The statements for technology transfer show that about 80% of the projects declared that they transferred knowledge through trainings, while about 20% did not claim any transfer, or claimed that technology transfer was not applicable. This is in line with the general assumption that planted forests projects are normally connected to the use of consolidated technologies ([9]) and have limited potential in the transfer of truly innovative products or processes, particularly when based on small scale investments ([20]).
Conclusions
This paper demonstrates that in the UNFCCC and BioCF databases an adequate amount of information is publicly available to build a picture of the technical, spatial, and financial aspects of the implemented projects, as well as their impacts in terms of carbon sequestration. When compared with other large scale planted forest programs promoted by public authorities, such as those financed since 1992 under the Rural Development Programs by the European Union, the transparency and accountability of forest CDM projects are much higher.
The Italian Government participates along with other 10 countries in a relatively high number of A/R CDM projects (16 in total), with a total of about 65 k ha planted in 10 host countries. The A/R sector is prominent in the Italian CDM portfolio, being the sector with the second highest number of projects after energy industries. From the UNFCCC and BioCF databases it was not possible to estimate the amount of Italian-pertinent emission reductions. However, even accounting for the whole amount of estimated emission reductions produced by the A/R projects per year (about 556 k tCO2eq), this accounts for less than 1% of the total emission reductions achieved by CDM projects with Italian participation in all sectors. This is intrinsic to forestry projects: as due to their uncertain nature, the amount of emission reductions achievable is relatively low.
The financing of 16 projects by the Italian government, through the BioCF, which amounts to a minimum of US$ 2.5 million, is based on three elements that differ substantially from the ongoing policy adopted for domestic forest programs in Italy:
- 55% of the 36 k ha of new forests were planted with non-native species, while planting of non-native trees is discouraged in Italy, in accordance with article 8(h) of the Convention on Biological Diversity and the policy defined by the national Framework Program for the Forestry Sector ([12]);
- half of the Italian CDM projects adopted a large scale approach, a practice that is not followed in Italy (mainly due to structural reasons), whereas public authorities financially support planted forests as small as 0.5 ha;
- the Italian Government has been relatively active in CDM forest project investments to generate CERs; on the contrary, domestically it has been indifferent to the development of carbon compensation schemes in general, and in the forest voluntary market ([13]) specifically. However, Italy accounts for the largest amount of credits from domestic LULUCF activities within the European Union for reaching the KP’s targets ([7]).
Regarding how Italian CDM forest projects meet the second objective of simultaneously contributing to sustainable development, all the projects claim that they stimulate the local economy, including short and long term employment in the project area, and that they engage the local population. Moreover, they state that they preserve natural resources and promote reliable and renewable energy. However, the achievement strategy is mainly attributed to the planting activities themselves, not to additional activities specifically implemented. The analysis of the statements related to technology transfer show that about 80% of the projects declared that they transfer knowledge through trainings, while about 20% do not claim any technology transfer.
The system of indicators developed by UNFCCC ([31]) does not provide a method for assessing how much a project contributes to sustainable development. Project participants might overcome this by using the official, voluntary UNFCCC tool “CDM Sustainable Development co-benefits description report” for describing co-benefits in a consistent and structured way ([34]). So far, none of the projects with Italian participation have made this effort, and integration of the available information from the Ministry for the Environment, Land and Sea would be particularly valuable, also considering the relevant financial involvement of Italy in these activities and the positive lessons to be learned from the ongoing experience in the light of the future development of the UNFCCC negotiations.
References
Gscholar
Gscholar
Gscholar
Gscholar
Gscholar
Gscholar
Gscholar
Gscholar
Gscholar
Gscholar
CrossRef | Gscholar
Gscholar
Gscholar
Gscholar
Gscholar
Gscholar
Gscholar
Gscholar
Gscholar
Gscholar
Gscholar
Gscholar
Gscholar
Gscholar
Gscholar
Authors’ Info
Authors’ Affiliation
Lucio Brotto
Davide Pettenella
Dipartimento Territorio e Sistemi Agro-Forestali, Università di Padova, v. Università 16, 35020 Legnaro, PD (Italy)
Istituto Superiore per la Protezione e la Ricerca Ambientale, v. Vitaliano Brancati 48, 00144 Roma (Italy)
Corresponding author
Paper Info
Citation
Corradini G, Brotto L, Ciccarese L, Pettenella D (2016). An overview of Italian participation in afforestation and reforestation projects under the Clean Development Mechanism. iForest 9: 720-728. - doi: 10.3832/ifor1654-009
Academic Editor
Silvano Fares
Paper history
Received: Mar 26, 2015
Accepted: Jan 11, 2016
First online: May 17, 2016
Publication Date: Oct 13, 2016
Publication Time: 4.23 months
Copyright Information
© SISEF - The Italian Society of Silviculture and Forest Ecology 2016
Open Access
This article is distributed under the terms of the Creative Commons Attribution-Non Commercial 4.0 International (https://creativecommons.org/licenses/by-nc/4.0/), which permits unrestricted use, distribution, and reproduction in any medium, provided you give appropriate credit to the original author(s) and the source, provide a link to the Creative Commons license, and indicate if changes were made.

Web Metrics
Breakdown by View Type
Article Usage
Total Article Views: 53498
(from publication date up to now)
Breakdown by View Type
HTML Page Views: 44642
Abstract Page Views: 3134
PDF Downloads: 4333
Citation/Reference Downloads: 40
XML Downloads: 1349
Web Metrics
Days since publication: 3708
Overall contacts: 53498
Avg. contacts per week: 100.99
Article Citations
Article citations are based on data periodically collected from the Clarivate Web of Science web site
(last update: Mar 2025)
Total number of cites (since 2016): 2
Average cites per year: 0.20
Publication Metrics
by Dimensions ©
Articles citing this article
List of the papers citing this article based on CrossRef Cited-by.
Related Contents
iForest Similar Articles
Research Articles
Assessing the carbon sink of afforestation with the Carbon Budget Model at the country level: an example for Italy
vol. 8, pp. 410-421 (online: 02 October 2014)
Research Articles
Reforestation and land use change in a drainage basin of southern Italy
vol. 6, pp. 175-182 (online: 08 May 2013)
Research Articles
Afforestation monitoring through automatic analysis of 36-years Landsat Best Available Composites
vol. 15, pp. 220-228 (online: 12 July 2022)
Short Communications
The Polish landscape changing due to forest policy and forest management
vol. 2, pp. 140-142 (online: 30 July 2009)
Research Articles
Carbon storage and soil property changes following afforestation in mountain ecosystems of the Western Rhodopes, Bulgaria
vol. 9, pp. 626-634 (online: 06 May 2016)
Research Articles
Predicting the effect of climate change on tree species abundance and distribution at a regional scale
vol. 1, pp. 132-139 (online: 27 August 2008)
Commentaries & Perspectives
Forest plantations with public subsidies: to harvest or not to harvest, this is the question
vol. 15, pp. 229-233 (online: 12 July 2022)
Research Articles
Impact of climate change on radial growth of Siberian spruce and Scots pine in North-western Russia
vol. 1, pp. 13-21 (online: 28 February 2008)
Research Articles
Shifting to a holistic approach in national wildfire management policies: the Italian case
vol. 18, pp. 163-175 (online: 01 July 2025)
Research Articles
Model-based assessment of ecological adaptations of three forest tree species growing in Italy and impact on carbon and water balance at national scale under current and future climate scenarios
vol. 5, pp. 235-246 (online: 24 October 2012)
iForest Database Search
Search By Author
Search By Keyword
Google Scholar Search
Citing Articles
Search By Author
Search By Keywords
PubMed Search
Search By Author
Search By Keyword


