Evaluation and correction of optically derived leaf area index in different temperate forests
iForest - Biogeosciences and Forestry, Volume 9, Issue 1, Pages 55-62 (2015)
doi: https://doi.org/10.3832/ifor1350-008
Published: Jun 11, 2015 - Copyright © 2015 SISEF
Research Articles
Abstract
In recent years optical techniques for rapid LAI measurements have been developed, but few studies have been performed to evaluate the accuracy of optical estimation of LAI in mixed deciduous-evergreen forest stands. In this paper, we assessed the accuracy of digital hemispherical photography (DHP) and the LAI-2000 for the estimation of effective LAI (Le) by comparison with litter collection LAI (LAIlit) in four mixed deciduous broadleaf and evergreen needleleaf forests and one deciduous needleleaf forest. We also evaluated the relative contribution of major error sources to the determination of LAI by optical methods, including the woody-to-total area ratio (α), the element clumping index (ΩE) and the needle-to-shoot area ratio (γE). Additionally, incorrect automatic photographic exposure has been considered for DHP. DHP Le underestimated LAIlit by an average of 44-70% in different forests, and the difference between LAIlit and DHP Le after correction for the automatic exposure, α, ΩE and γE ranged from 1% to 21% in five forest stands. In contrast, LAI values from LAI-2000 were more similar to the direct litter collection LAI. The LAI-2000 Le underestimated LAIlit by an average of 13-40% in these forests, while the accuracy of the best estimates of LAI using LAI-2000 methods is over 93% after considering α, ΩE and γE. The error caused by automatic exposure to DHP Le is larger than other factors in all forest stands, and the γE was the main uncertainty to LAI-2000 Le in most forest stands. Moreover, optical LAI (both DHP and LAI-2000) was significantly (P < 0.01) correlated with LAIlit, especially the corrected LAI obtained by the LAI-2000 (R2 = 0.83, RMSE = 1.04). Our results demonstrate that the above factors affect the estimation of LAI by optical methods, thus the species composition of a forest stand should be seriously considered in order to improve the accuracy of LAI by optical methods.
Keywords
Leaf Area Index (LAI), Digital Hemispherical Photography (DHP), LAI-2000, Woody Materials, Clumping Effects, Automatic Exposure, Litter Collection, Correlation
Introduction
The leaf area index (LAI), which is defined as half the total green leaf area per unit ground surface area ([7]), is an important canopy parameter required for many physiological and ecosystem studies ([31], [3], [1]). For instance, an accurate LAI estimation is essential for modeling light and precipitation interception, CO2 fluxes, evapotranspiration, and dry deposition ([24], [2], [19], [47]). In addition, LAI is commonly used to compare canopy development or structure over time or under different environmental conditions or disturbances ([32]). Therefore, accurately estimating the LAI is of great interest, especially in tall forest systems.
Recently, direct and indirect methods have been recommended to estimate the LAI in a forest stand. Destructive sampling, allometry, and litter collection are the most commonly used direct methods ([10], [4], [25]). Although the LAI value obtained is similar to the true values, such direct methods are time consuming and labor intensive, and especially destructive for the former two methods. In contrast, the litter collection method is the best choice for obtaining an accurate LAI in a forest stand, especially in protected areas. This method has traditionally been used to estimate the LAI in a deciduous forest that has a single leaf-fall season ([35], [15], [18], [23]). Recently, the annual maximum LAI of evergreen conifer forests with continuous leaf fall over years has been obtained by combining the annual litter fall values with the average life span of evergreen needles ([43], [22], [38]). However, litter collection is more laborious in comparison to indirect methods, especially for collecting and sorting the litter fall termly.
Indirect inference of LAI is based on the gap fraction or gap size distribution within a canopy using radiative transfer theories ([39]). Therein, digital hemispherical photography (DHP) and LAI-2000 plant canopy analyzer are the most widely used techniques for simultaneous measurements of the canopy structural characteristics from several zenith angles. However, the accuracy of the LAI from optical methods has typically been assessed using direct estimation of the LAI because the woody materials and foliage clumping effects (including beyond and within shoots) have also been identified as important issues associated with the use of these optical techniques in the field ([6], [10], [14], [30]). For this reason, the effective LAI (Le) has been proposed to describe optically derived LAI estimates in the literature ([7]). Additionally, recent studies reported that an incorrect exposure setting in DHP LAI estimation may be a significant source of error ([8], [5], [12], [1], [41]) by decreasing the contrast between the sky and foliage, further affecting the calculation of the LAI by DHP. Comparisons of the LAI estimated from DHP and the LAI-2000 techniques with those obtained from direct measurements have often been reported ([17], [10], [44], [33], [36]). However, the accuracy of the Le from DHP or LAI-2000 after correction for woody materials and clumping effects has rarely been evaluated based on non-destructive direct methods in different mixed deciduous-evergreen (i.e., deciduous broadleaf and evergreen needleleaf) and deciduous needleleaf forest stands.
In the present study, we directly estimated the LAI using a litter collection method in five different temperate forest stands in China, and these directly measured LAI values were used as a basis for validating optical measurements of LAI in the same sites. Our specific objectives were: (1) to evaluate the accuracy of the Le derived from the DHP and LAI-2000 methods in different forest stands; (2) to quantify the relative contributions of different sources of errors (e.g., woody materials, clumping effects within a canopy or automatic exposure) to LAI estimates by optical methods; and (3) to develop correlations between the optically determined Le and the litter collection LAI, and examine whether these relationships are improved after considering the other canopy structural factors (e.g., woody materials and the clumping effects within a canopy) in estimating the LAI using the optical methods.
Materials and methods
Study site
The study site is in the Liangshui National Nature Reserve, in northeastern China (47° 10′ 50″ N, 128° 53′ 20″ E). The site is characterized by a rolling mountainous terrain, ranging from 300 to 707.4 m a.s.l. with a typical slope of 10°-15°. The mean annual air temperature is -0.3 °C, and the mean annual rainfall is 676 mm. The area has a long history of community development with a variety of forest stands. These forests mainly include mixed broadleaved-Korean pine (Pinus koraiensis) forest (BK), selection cutting forest (SC), secondary birch (Betula platyphylla) forest (SB), Korean pine plantation (KP) and Dahurian larch (Larix gmelinii) plantation (DL). SC is derived from the Korean pine, where large DBH were cut in the BK that grew originally approximately 35 years ago; SB, KP and DL are forests developed on the harvested sites where BK grew originally. Specific information about the forest stands in this study is summarized in Tab. 1.
Tab. 1 - General status and species composition of the five forest stands under investigation in China.
| Forest stands | Major species | Density (trees ha-1) |
Mean DBH (cm) |
Basal area (m2 ha-1) |
Land-use history |
Age (year) |
|---|---|---|---|---|---|---|
| Mixed broadleaf-Korean pine forest |
Pinus koraiensis, Acer mono,
Tilia amurensis, Betula costata |
2373 | 7.4 | 42.3 | Virgin forest | >300 |
| Selection cutting forest | Pinus koraiensis, Betula costata, Fraxinus mandshurica, Ulmus japonica | 2010 | 8.7 | 26.9 | Selection cutting in virgin forest in 1980 ca. | 35 |
| Secondary birch forest | Betula platyphylla, Larix gmelinii, Picea spp. |
2854 | 7.2 | 23 | Regeneration forest after clear cutting in 1953 | 61 |
| Korean pine plantation |
Pinus koraiensis, Betula platyphylla,
Larix gmelinii |
1973 | 11.5 | 33.3 | Afforestation in 1954 | 60 |
| Dahurian larch plantation | Larix gmelinii, Fraxinus mandshurica, Acer mono |
1506 | 8.6 | 30.2 | Afforestation in 1954 | 60 |
Both BK and SB had one sampling plot (60 × 60 m). SC, KP and DL all had three sampling plots (20 × 30 m). Twenty litter traps were set randomly in both BK and SB plots. For SC, KP and DL, each plot was divided into 10 × 10 m subplots, and 6 litter traps were separately installed at the center of each subplot (i.e., a total of 18 litter traps for each forest stand). Each litter trap had a 0.5 or 1.0 m2 square aperture, and its base was approximately 0.5 m above the ground.
Litter collection leaf area index
Litterfall was collected monthly in each plot in 2013. Data collected in fall-winter were used for calculation of LAI in deciduous species, while data collected annually were used for calculation of LAI in evergreen species. In addition, we assumed that the new LAI for evergreen species is the same each year, a measurement of LAI in any year representing the average condition. Therefore, the LAI of evergreen species was obtained from multiplying the LAI from the litterfall within a certain period (one year) by the average life span of each species. The measurement of LAI at the plot was then obtained by summing such LAIs for all the major species.
SLA for major species and the average life span for evergreen species were essential for estimating LAI using litter collection. In the present study, the SLA for major species was measured once a month from August to November in 2012. The experimental details and SLA values reported by Liu et al. ([28]), and the mean SLA values over different periods were used to estimate LAI for major species in the litter collection method. It is worth noting that SLA can change along with falling of the leaves, thus the SLAs for major species were corrected using a shrinkage coefficient (ranging from 3.5 to 8.0%) estimated from a sub-sample of green leaves collected in the study forest plots. Potential interannual variability in the SLA was considered negligible. The average life span for Pinus koraiensis, Abies nephrolepis and Picea spp. was 3.07, 3.69 and 3.91 years, respectively ([28]).
Optical leaf area index
The effective LAI, Le can be usually measured using a DHP technique and LAI-2000 instruments based on the Miller ([34]) theory ([6] - eqn. 1):
where P(θ) is the measured canopy gap fraction at the zenith angle θ, which is the best when averaged over the entire azimuthal angle range.
DHP measurements
All hemispherical photographs were collected using a digital camera (Coolpix 4500, Nikon, Tokyo, Japan), with a 180° fisheye lens (Nikon FC-E8) in mid-July 2013. The camera was held 1.3 m above the ground using a tripod. All of the photographs were taken under an evenly overcast sky. We chose the following settings for the camera: (1) aperture priority mode with aperture set at F 5.3 (i.e., automatic exposure); (2) high image quality (2272 × 1704 pixels); and (3) fine JPEG format. The photographs were processed with the DHP software to derive the Le ([27]). A circular photograph was divided into concentric 6 rings spanning the zenith angle range from 0° to 90° (i.e., ring 1: 0°-15°; ring 2: 15°-30°; ring 3: 30°-45°; ring 4: 45°-60°; ring 5: 60°-75°; ring 6: 75°-90°), but according to LAI-2000 measurements, 0°-75° (i.e., 1-5 rings) zenith angle ranges was selected to derive Le and the Gamma function was set to 1 ([12]).
LAI-2000 measurements
Canopy gap fraction and Le were also estimated with LAI-2000 measurements (Licor Inc., Lincoln, NE, USA) at five concentric rings (ring 1: 0°-13°; ring 2: 16°-28°; ring 3: 32°-43°; ring 4: 47°-58°; ring 5: 61°-74°), with the same time and location as hemispherical photographs. A LAI-2000 unit was subsequently operated at the same photographic spots for comparison with DHP, and the second LAI-2000 unit, cross-calibrated with the former, was used to automatically record “above-canopy” readings from a nearby clearing. A 90° view cap was used on both units to avoid the influence of the operator on the sensor. The LAI-2000 data were processed using the available C2000 software for Le within all five rings.
Correction of optical LAI estimates
The error of optical estimated LAI caused by woody materials and clumping effects within canopies has often been realized ([10], [40], [12]). Therefore, the following parameters should be considered in order to obtain a more accurate LAI (denoted as L) based on Le ([10] - eqn. 2):
where α is the woody-to-total area ratio representing the woody materials (quantified by the woody area index, WAI) contribution to Le; Le is the effective LAI from optical instruments (DHP or LAI-2000); ΩE is the clumping index quantifying the effect of foliage clumping at scales larger than shoots; and γE is the needle-to-shoot area ratio quantifying the effect of foliage clumping within shoots. For broadleaf species, individual leaves are considered foliage elements, thus γE = 1.0, but for needleleaf species, γE is usually larger than 1.0. The caveat of these parameters (i.e., α, ΩE and γE) in eqn. 2 were measured only once, i.e., the same parameters were used to correct Le derived from both DHP and LAI-2000.
Woody-to-total area ratio (α)
In this study we measured the α value using the Adobe Photoshop® (PS) software package ([37]). For mixed deciduous-evergreen forest stands (i.e., BK, SC, SB and KP), we first obtained the Le of a photograph using the DHP software. Second, we replaced the green materials (mainly leaves and needles) with sky through the “Clone Stamp Tool” of PS, leaving only woody materials visible (mainly stems) on the image. We could then obtain the WAI of the photograph by DHP with the same threshold as above. Finally, the parameter α was then derived accordingly (α = WAI/ Le) in mixed deciduous-evergreen forest stands. For the deciduous forest stand (DL), we used a background method to remove the influence of woody materials on the optical estimation of LAI. Generally, the WAI is the summation of stem area index (SAI) and branch area index (BAI). In this study, we ignored the contribution of the BAI to the LAI. First, we collected photographs at each sample point in DL during a leafless period (May 1st). Second, we separated the stems from woody materials using the “Clone Stamp Tool” in PS, similar to the process in mixed deciduous-evergreen forests, replacing the branches with sky. Finally, we obtained the α value for DL. It is worth noting that using the above procedure the WAI only represents the stem area index.
Element clumping index (ΩE)
The ΩE was computed based on the gap size and fraction analysis ([9], [27] - eqn. 3):
where Fm (0,θ) is the measured accumulated gap fraction larger than zero (i.e., the canopy gap fraction), and Fmr (0,θ) is the gap fraction for the canopy when large gaps that are not theoretically possible in a random canopy have been removed for a given LAI and foliage element width. The advantage of this method to derive ΩE is that it can be applied to all types of plant canopies without the need for spatial pattern assumptions about canopy elements ([20]). The ΩE values were measured by DHP-TRAC software ([11], [31]) within the zenith angle range 0-75°.
Needle-to-shoot area ratio (γE)
The γE for the four needleleaf species (Pinus koraiensis, Abies nephrolepis, Picea spp. and Larix gmelinii) in the five forest stands was quantified using destructive sampling in the field. For each needleleaf species, 27 shoot samples were taken from three trees: one dominant (D, DBH ≥ 40 cm), one co-dominant (M, 20 ≤ DBH < 40 cm) and one suppressed (S, DBH < 20 cm). Samples were collected at three heights for each tree: top (T), middle (M) and low (L), creating nine classes containing three shoot samples each: DT, DM, DL, MT, MM, ML, ST, SM, and SL. These sample shoots were analyzed according to the volume replacement method proposed by Chen ([6]), and the implementation details are reported in Liu et al. ([29]). Finally, the γE in a plot was obtained by weighting the γE of the trees of different species (both broadleaf and needleleaf species) by their relative contribution to the total basal area in the plot.
In comparison to the LAI-2000 instrument, the accuracy of LAI measured using DHP is affected by the additional issue of photograph exposure setting. Therefore, we additionally corrected a systematic error in the DHP method due to incorrect automatic exposure (defined as E), based on the relationship between the DHP Le obtained by automatic exposure and LAI-2000 Le reported by Zhang et al. ([46]), i.e., y = 0.5611·x + 0.3586 (R2 = 0.77), where x is the Le estimated by LAI-2000, and y is the Le estimated by DHP within automatic exposure.
Bias analysis
For the DHP method, the sources of bias of LAI measurement were caused by α, ΩE, γE, and E, thus, LAI = fDHP (α, ΩE, γE, E). Then, we calculated the total bias (ΔLAI - eqn. 4):
where Δα = 0-α, ΔΩE = 1-ΩE, ΔγE = 1-γE and ΔE=1-E. For the LAI-2000 method, the sources of bias of LAI measurement were caused by α, ΩE, and γE, thus, LAI = fLAI-2000 (α, ΩE, γE). Then we calculated the total bias (eqn. 5):
Therein the calculation of Δα, ΔΩE and ΔγE were the same as in eqn. 4.
Results
Gap fraction estimation optical methods
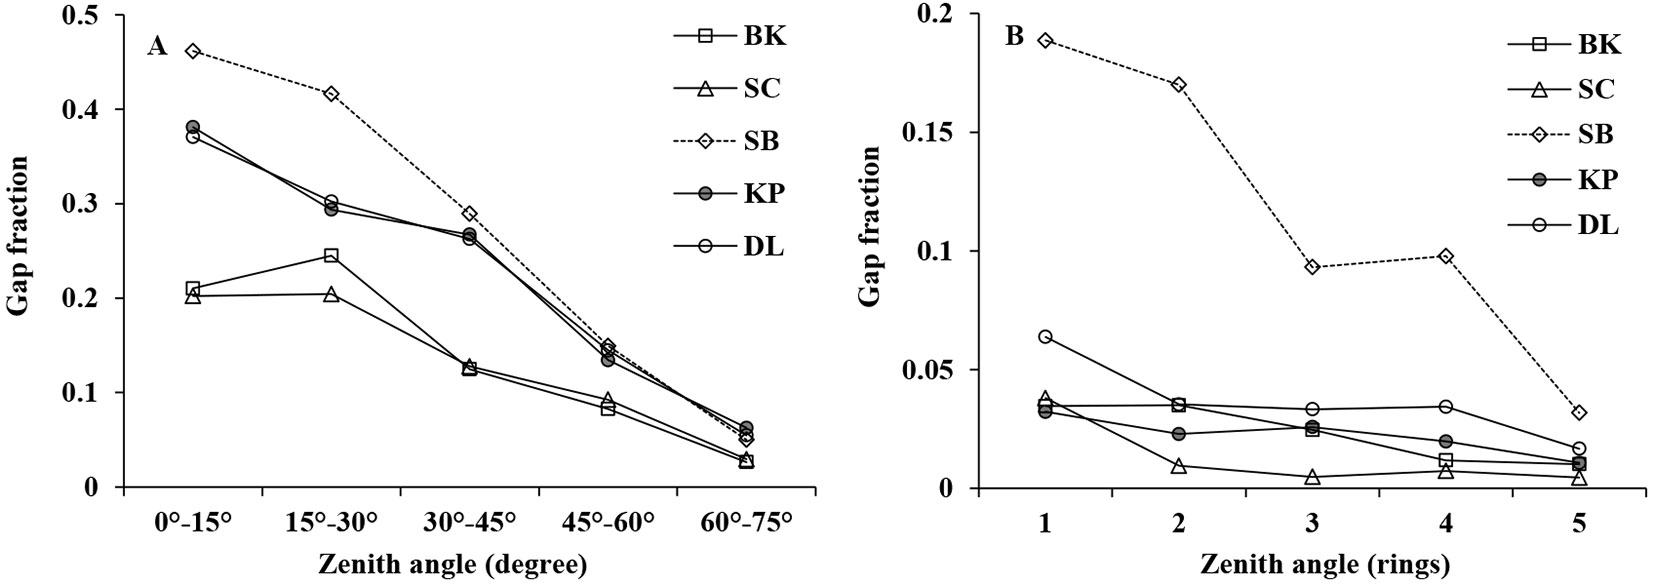
Generally, gap fraction measured by both DHP and LAI-2000 decreased with increasing zenith angle in different forest stands (Fig. 1), although DHP gave larger gap fraction values than that of LAI-2000, probably because of the incorrect automatic exposure set in DHP.
Fig. 1 - Gap fraction comparison among DHP (A) and LAI-2000 (B) in five forest stands.
Parameters for correcting optical LAI
All parameters required for LAI correction using eqn. 2 are summarized in Tab. 2. The woody-to-total area ratio (α) ranged from 3% to 8% in five forest stands. The clumping effects beyond shoots (ΩE) varied slightly with the forest stand; the largest ΩE was 0.92 in DL, and KP had the smallest ΩE with a value of 0.89. The KP had the largest clumping effects within the shoots (γE) with a value of 1.46. The γE for SB (with a value of 1.08) was lower than that obtained for the other four forest types, because the large proportion of broadleaf species increased the weight of γE for these species (γE = 1.0) in the overall γE calculated for the whole forest stand.
Tab. 2 - Correction factors for woody-to-total area ratio (α), clumping index (ΩE) and needle-to-shoot area ratio (γE) on optical LAI in five forest stands. (BK): mixed broadleaved-Korean pine forest; (SC): selection cutting forest; (SB): secondary birch forest; (KP): Korean pine plantation; (DL): Dahurian larch plantation.
| Factors | BK | SC | SB | KP | DL |
|---|---|---|---|---|---|
α (%) |
4 | 3 | 5 | 5 | 8 |
Ω E |
0.90 | 0.91 | 0.91 | 0.89 | 0.92 |
γ E |
1.41 | 1.28 | 1.08 | 1.46 | 1.27 |
Comparison of the LAI from direct and indirect methods
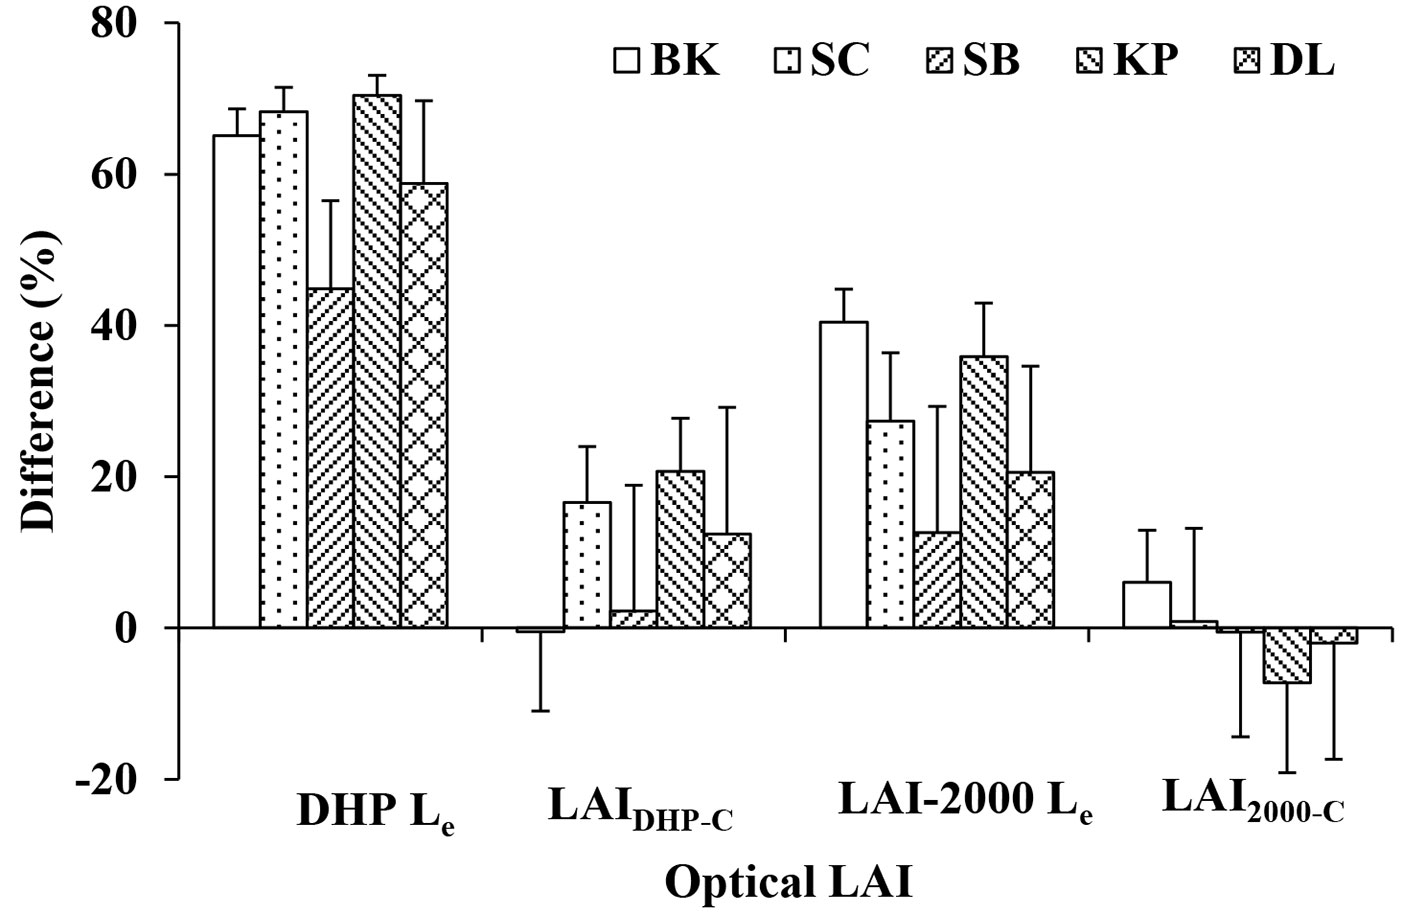
Based on the litter collection, the SC had the largest LAI, with a value of 9.42 ± 0.66 (SD), followed by BK, KP, DL and SB, with values of 8.84 ± 1.04, 7.95 ± 1.07, 5.59 ± 1.13 and 3.69 ± 0.48, respectively (Tab. 3). Generally, the optical LAI (both DHP Le and LAI-2000 Le) underestimated the LAIlit for each forest stand (Tab. 3, Fig. 2). DHP Le underestimated LAIlit by an average of 65%, 68%, 44%, 70% and 59% for BK, SC, SB, KP and DL, respectively, indicating that the difference between DHP Le and LAIlit are affected by the species composition of forest stands. However, the accuracy of DHP Le after correcting for the woody materials, clumping effects within canopies and incorrect exposure was greatly improved in all forest stands. The difference between the LAIlit and the corrected LAI from DHP was 1%, 2% and 12% in BK, SB and DL, respectively (Tab. 3, Fig. 2). However, the corrected LAI from DHP still underestimated LAIlit by 17% and 21% on average for SC and KP, respectively. In contrast, LAI-2000 Le underestimated LAIlit by 40%, 27%, 13%, 36% and 21% on average for BK, SC, SB, KP and DL, respectively. The accuracy of the LAI-2000 Le after correction for woody materials and clumping effects within canopies markedly improved in all five forest stands. The difference between the LAIlit and corrected LAI from LAI-2000 was less than 7% in all forest stands (Fig. 2), indicating that the correction scheme for LAI-2000 is reasonable and effective not only in deciduous but also mixed deciduous-evergreen forest stands. It is worth noting that the corrected LAI from the optical method showed larger LAI values than LAIlit in some forest stands. After correcting LAI from DHP, average overestimation was only 1% for BK, while it was lower than 7% for SB, KP and DL after correcting LAI from LAI-2000, based on comparison with LAIlit.
Tab. 3 - Comparison of the LAI from litter collection and optical (DHP and LAI-2000) methods in five forest stands. Means ± standard deviations are reported. (LAIlit): LAI from litter collection; (DHP Le): effective LAI derived from the DHP method; (LAIDHP-C): DHP Le after correction for automatic exposure, woody materials and clumping effects within canopies; (LAI-2000 Le): effective LAI derived from the LAI-2000 method; (LAI2000-C): represents LAI-2000 Le after correction for woody materials and clumping effects within canopies.
| Forest Type | LAI lit |
DHP Le |
LAI DHP-C |
LAI-2000 Le |
LAI 2000-C |
|---|---|---|---|---|---|
| BK | 8.84 ± 1.04 | 3.05 ± 0.18 | 8.81 ± 0.78 | 5.28 ± 0.85 | 8.33 ± 1.35 |
| SC | 9.42 ± 0.66 | 2.99 ± 0.36 | 6.82 ± 0.83 | 6.82 ± 0.77 | 9.31 ± 1.05 |
| SB | 3.69 ± 0.48 | 1.96 ± 0.12 | 3.47 ± 0.21 | 3.11 ± 0.41 | 3.57 ± 0.48 |
| KP | 7.95 ± 1.07 | 2.33 ± 0.19 | 6.09 ± 0.50 | 5.12 ± 1.04 | 8.56 ± 1.11 |
| DL | 5.59 ± 1.13 | 2.21 ± 0.29 | 4.69 ± 0.70 | 4.23 ± 1.43 | 5.43 ± 1.03 |
Fig. 2 - Differences between litter collection LAI and optical LAI (DHP and LAI-2000). All abbreviations are the same as in Tab. 2. Difference (%) = (LAIlit optical LAI)/ LAIlit ×100. Optical LAI includes the effective and corrected LAI from DHP and LAI-2000.
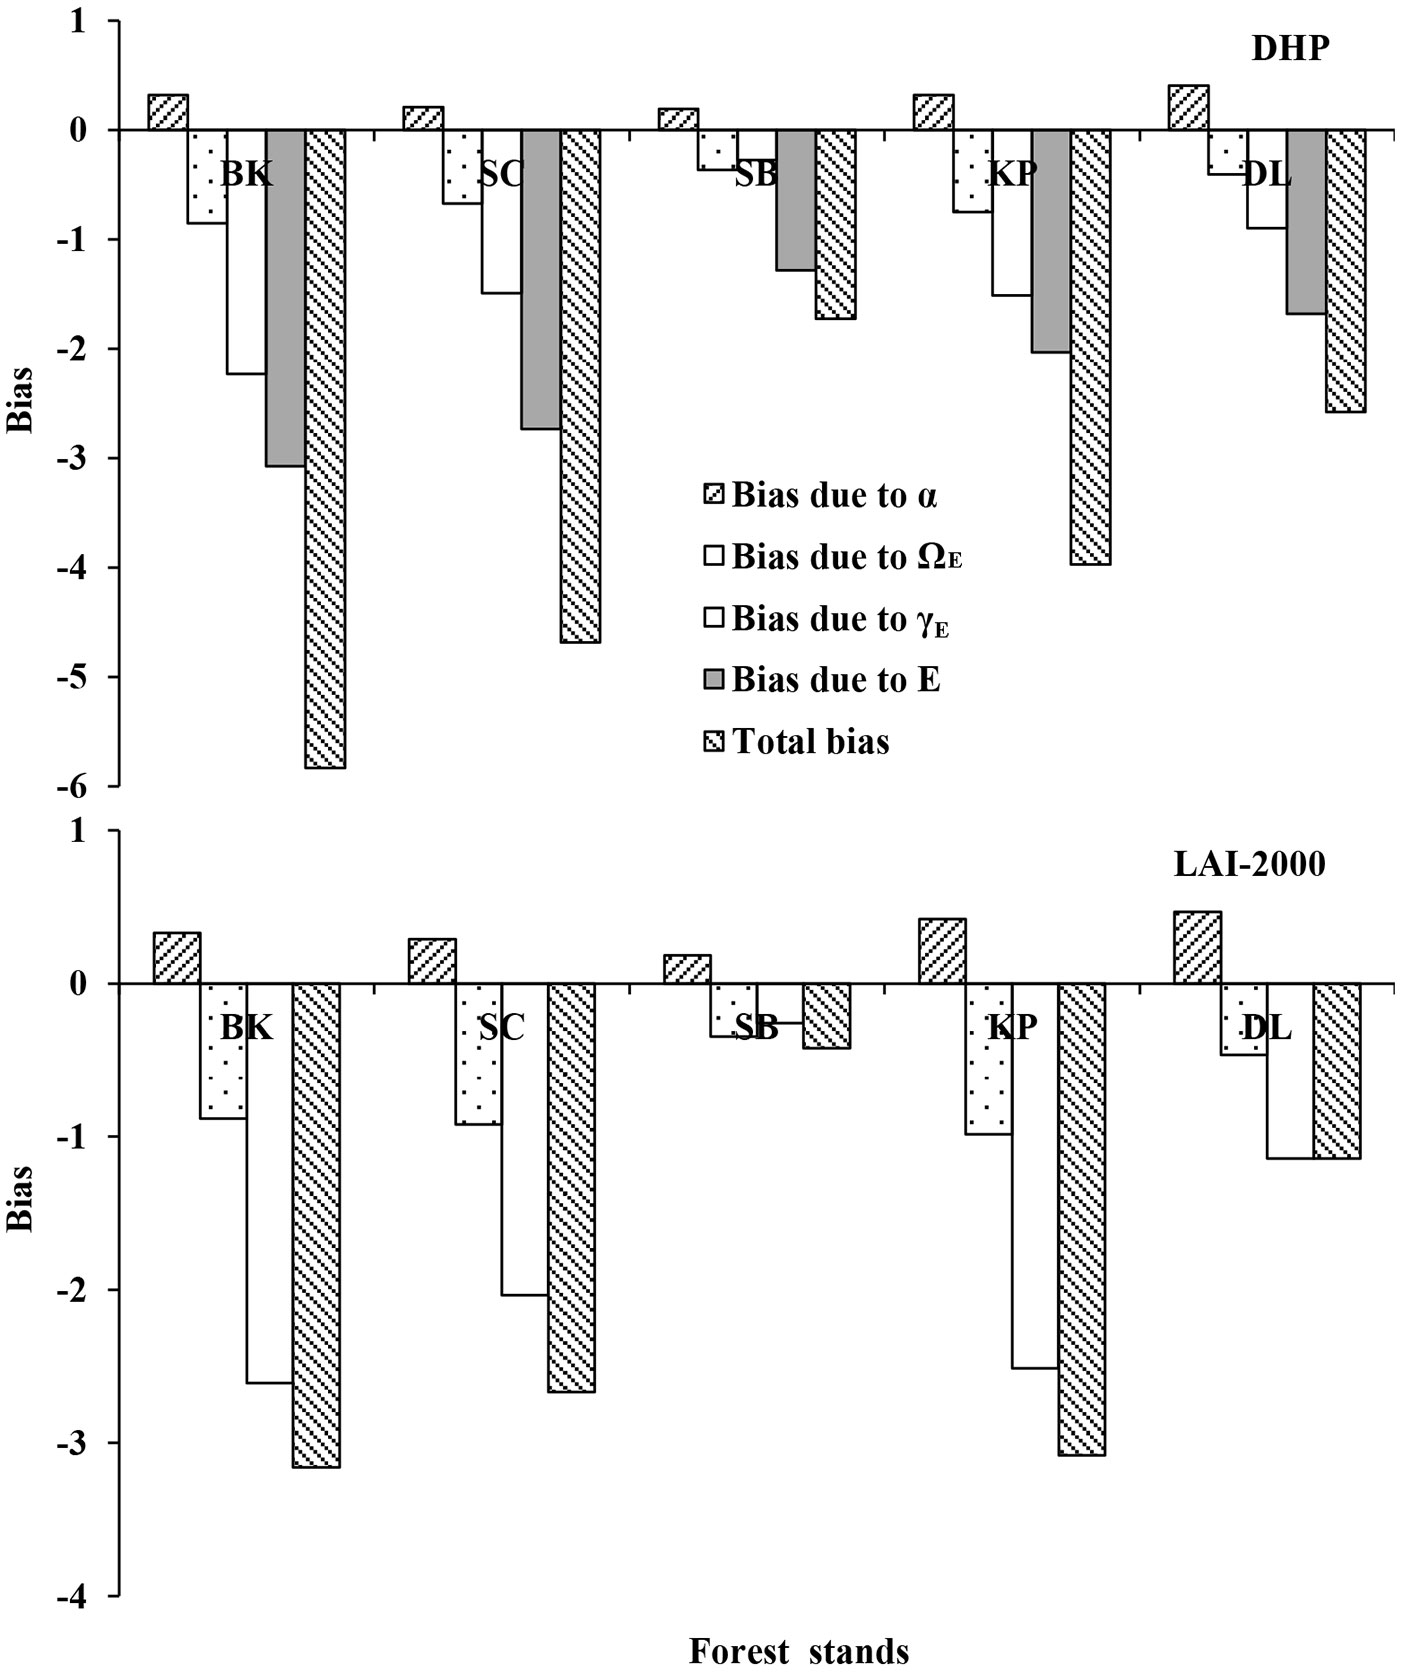
Overall, the bias due to each factor varied with forest stands more than optical measurement (i.e., DHP and LAI-2000), and the contribution of α to optical Le was opposite with other factors (e.g., ΩE, γE or E - Fig. 3). For DHP Le, the absolute bias due to automatic exposure was largest in different forests, followed by that due to γE. The total bias of DHP Le due to all factors were -5.83, -4.69, -1.72, -3.97, and -2.58 for BK, SC, SB, KP, and DL, respectively. In contrast, for LAI-2000 Le, the absolute bias due to γE was larger than those due to α and ΩE in most stands (except SB). For BK, SC, and KP, the absolute biases of LAI-2000 Le due to ΩE were larger than that of α, but for SB and DL, the biases of these factors showed different patterns. The total bias of LAI-2000 Le due to all factors were -3.16, -2.66, -0.42, -3.08, and -1.14 for BK, SC, SB, KP, and DL, respectively.
Fig. 3 - The biases caused by woody-to-total area ratio (α), clumping index (ΩE), needle-to-shoot area ratio (γE) or automatic exposure (E) for optical LAI (DHP and LAI-2000) in five different forest stands.
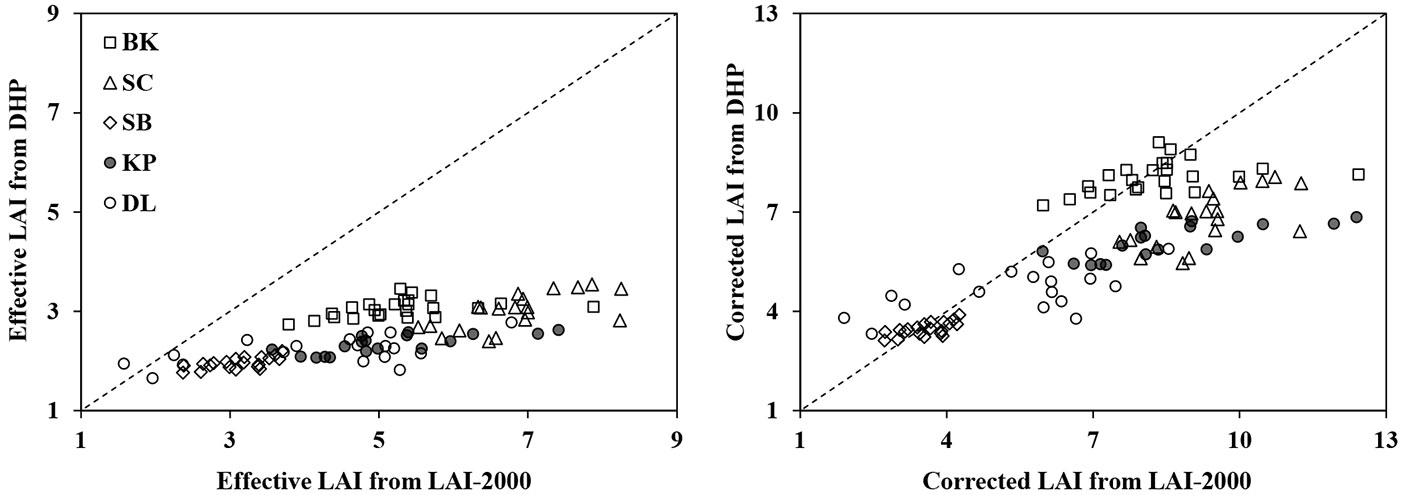
Generally, the DHP method gave smaller Le values than those obtained by LAI-2000 in all forest stand (Tab. 3, Fig. 4). DHP Le underestimated LAI-2000 Le by an average of 42%, 56%, 37%, 54% and 48% for BK, SC, SB, KP and DL, respectively. However, the DHP Le significantly correlated with LAI-2000 Le (R2 = 0.57, RMSE = 0.33 and P < 0.01 - Tab. 4). The correlation between DHP Le and LAI-2000 Le was enhanced after correcting for the parameters in eqn. 2 (Fig. 4), as indicated by the increased R2 value (0.66 - Tab. 4).
Fig. 4 - Scatter analysis of the LAI estimated by the LAI-2000 and DHP methods in five forest stands. The dotted line represents the 1:1 relationship.
Tab. 4 - Correlation between litter collection LAI (LAIlit) and optical LAI (DHP and LAI-2000). The expression used for regressions was y = ax + b. Coefficients of determination (R2), root mean squared errors (RMSE) and probability (P) of the regressions were reported. (*): regressions in which the intercept does not differ from zero and the slope does not differ from 1 (p <0.05). All abbreviations in LAI formats are defined in Tab. 2.
| LAI formats (x vs.y) | a | b | R 2 | RMSE | P |
|---|---|---|---|---|---|
LAI-2000 Le vs. DHP Le |
0.25 | 1.32 | 0.57 | 0.33 | < 0.01 |
| Corrected LAI from LAI-2000 vs. Corrected LAI from DHP | 0.56* | 1.99 | 0.66 | 1.02 | < 0.01 |
LAI from litter collection vs. DHP Le |
0.18 | 1.23 | 0.79 | 0.23 | < 0.01 |
| LAI from litter collection vs. Corrected LAI from DHP | 0.69* | 1.05* | 0.76 | 0.98 | < 0.01 |
LAI from litter collection vs. LAI-2000 Le |
0.52* | 1.07* | 0.75 | 0.76 | < 0.01 |
| LAI from litter collection vs. Corrected LAI from LAI-2000 | 0.90* | 0.81* | 0.83 | 1.04 | < 0.01 |
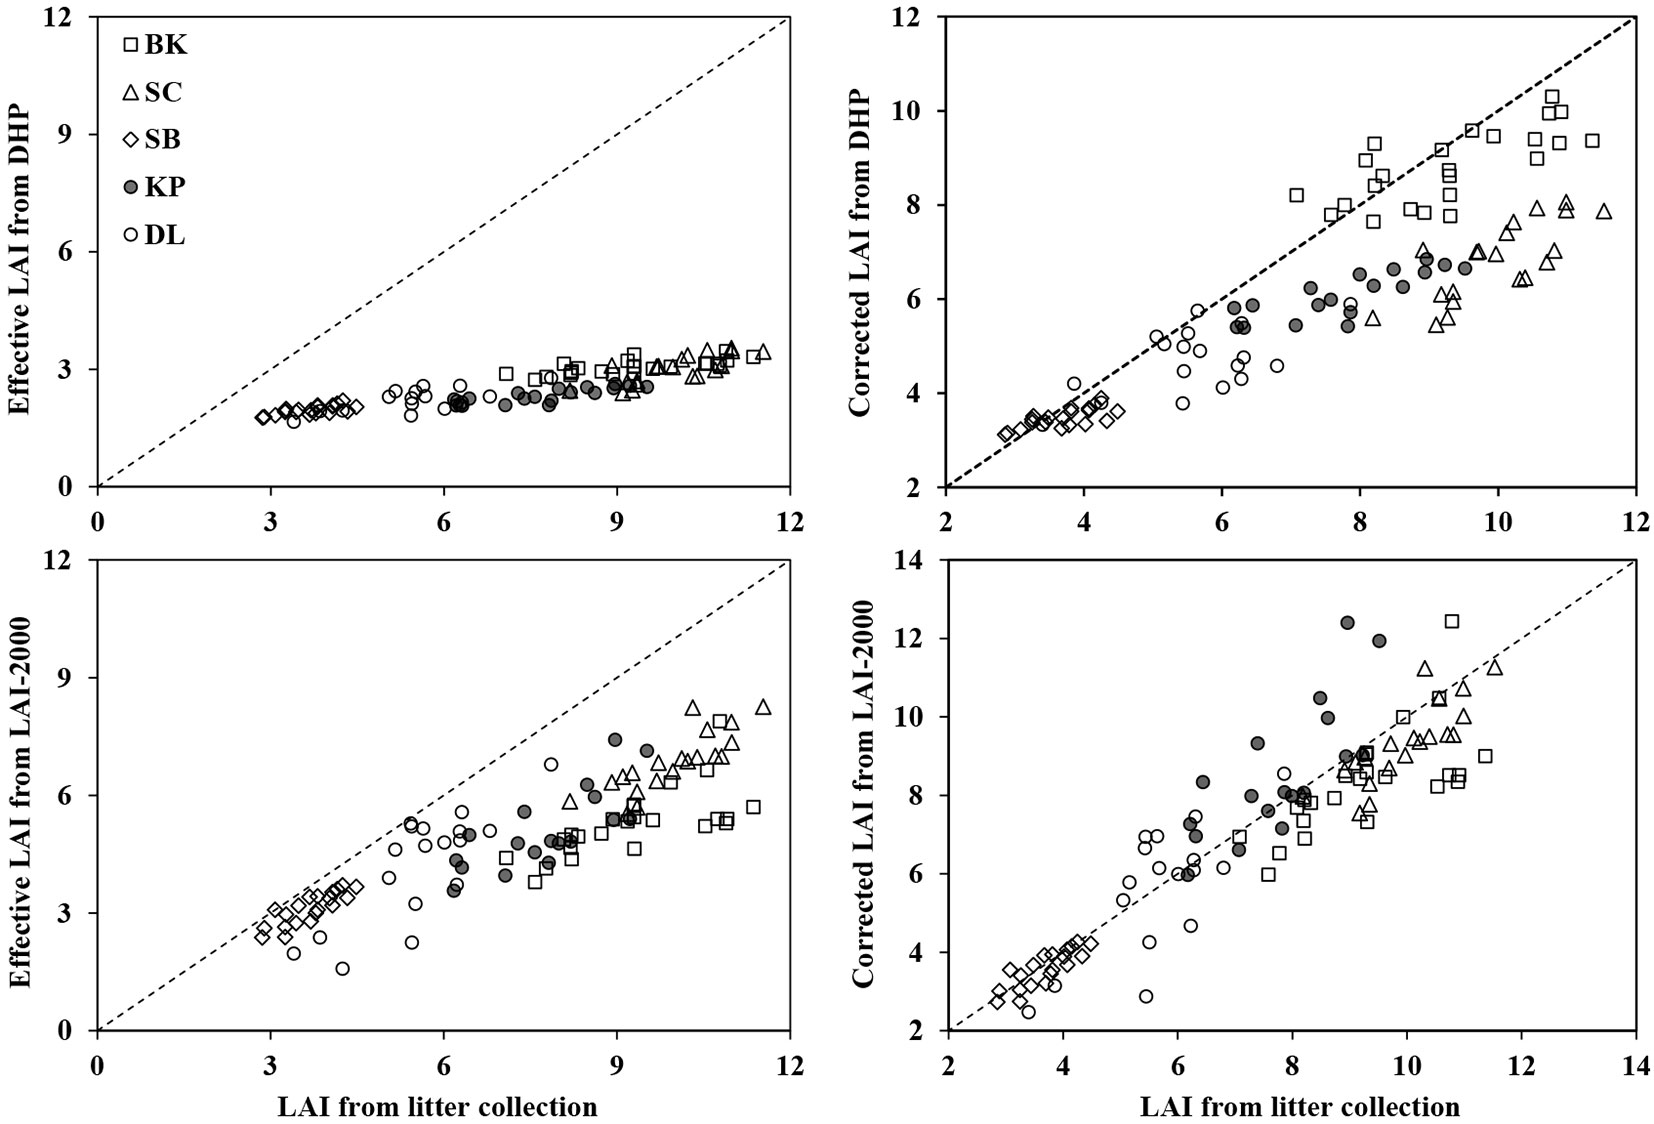
Fig. 5 illustrates the correlation between LAIlit and LAI from optical methods (both DHP and LAI-2000) in five different forest stands. A significant correlation (P < 0.01) between the LAIlit and uncorrected Le obtained by optical methods was observed (Tab. 4), with R2 = 0.79 and 0.75, RMSE = 0.23 and 0.76 for DHP and LAI-2000, respectively. For DHP Le, the correction for woody materials, clumping effects and incorrect exposure setting did not improved the correlation with LAIlit clearly. In contrast, the correction scheme on LAI-2000 was more effective, as indicated by the R2 value of 0.83. These results suggested that the error caused by woody materials and clumping effects within canopies (additional incorrect exposure for DHP) explained the majority of the error caused by estimating LAI by optical methods (e.g., DHP and LAI-2000).
Fig. 5 - Scatter analysis of the LAI estimated by litter collection and optical methods (DHP and LAI-2000) in five forest stands. Optical LAI includes effective and corrected LAI from DHP and LAI-2000. The dotted line indicates the 1:1 relationship.
Discussion
In this study optical methods (e.g., DHP and LAI-2000) gave lower LAI values than the litter collection method in different forest stands. DHP Le underestimated LAIlit by 44-70%, while underestimation ranged from 13% to 40% for LAI-2000 in these forest stands. Similar results have often been reported in previous studies. Jonckheere et al. ([24]) reported that the LAI-2000 underestimated the directly estimated LAI by 52%, and the underestimation for hemispherical photographs averaged 55%. Mason et al. ([33]) found that the LAI-2000 Le underestimated destructive sampling LAI in the range 30% to 60% in Pinus radiata plantations in New Zealand. Van Gardingen et al. ([45]) found the DHP Le underestimated the LAI by 50% relative to the harvesting method in a canopy of Gliricidia sepium in Mexico. However, we found a significant correlation between directly measured LAI and optical LAI in different forest stands (Tab. 4, Fig. 5). Similar relationships have been reported in the majority of published studies in different forest stands, e.g., Cutini et al. ([15]) in stands of the main broad-leaved forest species, Sonnentag et al. ([42]) in shrubs, Mason et al. ([33]) in Pinus radiata plantations and Chianucci & Cutini ([13]) in different deciduous forests.
The error in the estimation of LAI by optical techniques was mainly caused by woody materials and clumping effects within canopies. However, correcting for the clumping effects results in higher LAI values than the Le values alone, while correcting for the woody materials only gave lower values (Fig. 3). The α value has been widely measured by direct or indirect methods in previous studies. For instance, based on a destructive sampling method in different boreal forest species, Gower et al. ([21]) measured α values ranging from 0.05 to 0.35. Deblonde et al. ([16]) also reported α values of 0.08-0.12 for stands of Pinus resinosa by the direct method. However, this method is destructive and labor intensive, and too difficult to be used in the assessment of α values at a stand level. In contrast, the use of indirect techniques (e.g., DHP or LAI-2000) to estimate WAI in leafless periods and its subtractiion from the optical LAI in leafy periods is more practical. For example, Bréda ([4]) investigated 70 oak stands during the leafless and leafy periods within a year, finding that α ranged from 0.07 to 0.40. However, this method is only effective in deciduous forest stands since evergreen or mixed deciduous-evergreen forests have no leafless periods. Additionally, previous results are larger than ours (α in the scope of 0.03-0.08), probably because the seasonal variation of the contribution of woody materials to the LAI was not considered in most previous studies. Nevertheless, this contribution varies with the season as the expanded leaves mask some woody materials (e.g., branches), especially in peak LAI period. Similar viewpoints have been reported. For instance, Dufrêne & Bréda ([17]) reported that during the full-leaf period (as in this study), only stems accounted for the WAI. Kucharik et al. ([26]) also reported that branches generally do not significantly bias indirect LAI measurements, but the stems may not be preferentially shaded by leaves. These results provide theoretical support for the usage of the PS software for an effective quantification of the visible stem area. In addition, if the WAI was directly subtracted from the optical LAI in leafy periods in DL forest stands (deciduous forest), the error caused by woody materials was overestimated by 32% and 21% for DHP and LAI-2000, respectively. Therefore, it is very necessary to consider the seasonal changes of the contribution of woody materials in correcting the optically estimated LAI in further research.
As for a needleleaf forest stands, the clumping effects within canopies can be grouped into two levels, the clumping effects beyond (corrected by ΩE) and within shoots (corrected by γE). The determination of ΩE by DHP-TRAC has been previously recommended ([27], [11], [31]). In this study, ΩE ranged from 0.89 to 0.92 in different forest stands. Similar results have been reported in the majority of published studies in different forest stands. Chen et al. ([11]) reported that the ΩE values ranged from 0.88 to 0.96 by DHP-TRAC in different forest types. To date, measurement of the γE values often relies heavily on the destructive sampling method in the field. In the present study, γE ranged from 1.08 to 1.46, primarily depending on the relative abundance of broadleaf and needleleaf species in the stand. Similar values were reported by Chen ([6]) for six black spruce (Picea mariana) and jack pine (Pinus banksiana) stands (γE = 1.48) and by Kucharik et al. ([26]) for coniferous species (γE ranging from 1.2 to 2.0). Although the accuracy of the DHP LAI after correction for woody materials, clumping effects within canopies and automatic exposure was improved greatly, the corrected LAI from DHP underestimated the LAIlit by 21% in KP. In our opinion, such discrepancy is mainly due to the automatic exposure adopted, since the light level in KP is generally lower than in other forest stands because of the high proportion of evergreen needleleaf species. Indeed, such conditions may cause a LAI underestimation due to the automatic exposure larger than the exposure correction for the average light condition. In contrast, the difference between LAIlit and LAI-2000 Le was less than 7% in different forest stands after considering the woody materials and clumping effects within canopies. This result indirectly supports the viewpoint reported by Chen et al. ([10]), that optical measurements combined with shoot sample analysis can produce LAI values for conifer stands that are more accurate than destructive sampling results.
By contrast, the contribution of α and ΩE to optical LAI differed only slightly among forest stands, while a clear difference among different forest stands was detected for the contribution of γE to optical LAI (Fig. 3), probably because γE varies with species significantly. In addition, the contribution of α, ΩE and γE to optical LAI differed significantly in most forest stands, except for SB, where needleleaf species are largely less abundant than broadleaf species, the latter accounting for 92% of the total basal area. Therefore, species composition of a forest stand should be given more attention when improving the accuracy of LAI estimated by optical methods in future studies.
A significant correlation between the LAI estimates by DHP and by LAI-2000 is shown in Fig. 4. Similar relationships have been reported in other studies, e.g., Martens et al. ([32]) in a mixed conifer forest, Chen et al. ([10]) in boreal forests and Thimonier et al. ([44]) in 15 plots of the Swiss Long-Term Forest Ecosystem Research Programme. However, DHP Le underestimated LAI-2000 Le by an average of 37-56% (Tab. 3), probably because of the automatic exposure setting for DHP. Additionally, Fig. 3 showed that the largest uncertainty of DHP Le was the automatic exposure setting. Automatic exposure is used to create a certain brightness of the image; under low light conditions the exposure increases, causing overexposure of leaves that receive skylight at the top, and determining the underestimation of LAI using DHP. Zhang et al. ([46]) reported that automatic exposure can cause Le underestimations by 16-71% for medium- and high-density canopies. Therefore, not only the woody materials and clumping effects but also the correct exposure setting should be carefully considered estimating LAI using the DHP method in further research.
Conclusions
Based on litter collection, we directly estimated the LAI in four mixed deciduous-evergreen forests and one deciduous needleleaf forest. The results were used to evaluate two conventional indirect optical methods (DHP and LAI-2000). Optical LAI was significantly correlated with litter collection LAI (P < 0.01). However, DHP Le underestimated LAIlit by an average of 44-70% depending on forest stand. These underestimations range for LAI-2000 were 13-40%. Nevertheless, the difference between LAIlit and DHP Le after correction for the effect of automatic exposure, woody materials and clumping effects was less than 21%. In contrast, the accuracy of the best estimates of LAI using LAI-2000 was over 93% after considering woody materials and foliage clumping within shoots and the canopy in different forest stands, suggesting that this technique allows to estimate LAI accurately after careful correction. Additionally, the relative contribution of automatic exposure setting to the underestimation of LAI by the DHP technique is larger than other factors (α, ΩE, and γE) in all forest stands, and γE has the biggest relative contribution to underestimation of LAI using the LAI-2000 instrument in most forest stands. Such results suggest that species composition of forest stand should also be considered in estimating LAI by optical methods in future studies.
Acknowledgements
We thank Jing M. Chen for the comments of the revised manuscript. We also would like to express our gratitude to the anonymous reviewers for their constructive and valuable comments on the manuscript. This work was financially supported by the Ministry of Science and Technology of China (No. 2011BAD37B01), National Natural Science Foundation of China (No. 31270473) and the Fundamental Research Funds for the Central Universities (2572014AA01).
References
Gscholar
Authors’ Info
Authors’ Affiliation
Guangze Jin
Ming Zhou
Center for Ecological Research, Northeast Forestry University, Harbin 150040 (China)
Corresponding author
Paper Info
Citation
Liu Z, Jin G, Zhou M (2015). Evaluation and correction of optically derived leaf area index in different temperate forests. iForest 9: 55-62. - doi: 10.3832/ifor1350-008
Academic Editor
Giorgio Matteucci
Paper history
Received: May 13, 2014
Accepted: Mar 03, 2015
First online: Jun 11, 2015
Publication Date: Feb 21, 2016
Publication Time: 3.33 months
Copyright Information
© SISEF - The Italian Society of Silviculture and Forest Ecology 2015
Open Access
This article is distributed under the terms of the Creative Commons Attribution-Non Commercial 4.0 International (https://creativecommons.org/licenses/by-nc/4.0/), which permits unrestricted use, distribution, and reproduction in any medium, provided you give appropriate credit to the original author(s) and the source, provide a link to the Creative Commons license, and indicate if changes were made.

Web Metrics
Breakdown by View Type
Article Usage
Total Article Views: 54944
(from publication date up to now)
Breakdown by View Type
HTML Page Views: 44923
Abstract Page Views: 3661
PDF Downloads: 4828
Citation/Reference Downloads: 25
XML Downloads: 1507
Web Metrics
Days since publication: 4049
Overall contacts: 54944
Avg. contacts per week: 94.99
Article Citations
Article citations are based on data periodically collected from the Clarivate Web of Science web site
(last update: Mar 2025)
Total number of cites (since 2016): 9
Average cites per year: 0.90
Publication Metrics
by Dimensions ©
Articles citing this article
List of the papers citing this article based on CrossRef Cited-by.
Related Contents
iForest Similar Articles
Review Papers
Digital hemispherical photography for estimating forest canopy properties: current controversies and opportunities
vol. 5, pp. 290-295 (online: 17 December 2012)
Research Articles
The estimation of canopy attributes from digital cover photography by two different image analysis methods
vol. 7, pp. 255-259 (online: 26 March 2014)
Technical Advances
Thermal canopy photography in forestry - an alternative to optical cover photography
vol. 8, pp. 1-5 (online: 07 May 2014)
Short Communications
Estimation of canopy attributes of wild cacao trees using digital cover photography and machine learning algorithms
vol. 14, pp. 517-521 (online: 17 November 2021)
Research Articles
Mapping Leaf Area Index in subtropical upland ecosystems using RapidEye imagery and the randomForest algorithm
vol. 7, pp. 1-11 (online: 07 October 2013)
Research Articles
On the exposure of hemispherical photographs in forests
vol. 6, pp. 228-237 (online: 13 June 2013)
Research Articles
Estimation of forest leaf area index using satellite multispectral and synthetic aperture radar data in Iran
vol. 14, pp. 278-284 (online: 29 May 2021)
Technical Advances
A simplified methodology for the correction of Leaf Area Index (LAI) measurements obtained by ceptometer with reference to Pinus Portuguese forests
vol. 7, pp. 186-192 (online: 17 February 2014)
Research Articles
First vs. second rotation of a poplar short rotation coppice: leaf area development, light interception and radiation use efficiency
vol. 8, pp. 565-573 (online: 27 April 2015)
Research Articles
Relationships between overstory and understory structure and diversity in semi-natural mixed floodplain forests at Bosco Fontana (Italy)
vol. 9, pp. 919-926 (online: 21 August 2016)
iForest Database Search
Search By Author
Search By Keyword
Google Scholar Search
Citing Articles
Search By Author
Search By Keywords
PubMed Search
Search By Author
Search By Keyword


