
Spatial heterogeneity of light and tree sapling responses in the understory of disturbed montane forests
iForest - Biogeosciences and Forestry, Volume 8, Issue 4, Pages 448-455 (2014)
doi: https://doi.org/10.3832/ifor1195-007
Published: Oct 08, 2014 - Copyright © 2014 SISEF
Research Articles
Abstract
Attributes and frequency of forest gaps are usually described in reference to a one-dimensional gradient of light, which may relate to their disturbance dynamics. Similarly, species are customarily classified by their light response. We propose that a bi-dimensional light framework facilitates the understanding and comparison of forest systems and the understanding of plant responses to the complex light environment. This light plane is based on two spatially related components: 1) light received directly on a particular point (Focal); and 2) a statistical summary of the immediate environment representing the light conditions surrounding that point (Context). The contrast between these two values is null when Focal = Context and positive when Focal > Context or otherwise negative. Light was assessed using hemispherical photographs using a spatial arrangement of pictures spaced ~3 metres (m) in-between. Eight forest plots were surveyed, each with a central gap of different size. Sapling performance of Alnus acuminata, Cornus excelsa, Liquidambar styraciflua, Persea americana and Quercus laurina was also assessed within these plots. Measurements of stem height, basal diameter, and slenderness allometry were taken over a period of more than two years. We found in the light plane that plots were distributed in a pattern congruent with their estimated degree of disturbance (gap size), which spanned wide areas in the plane. Liquidambar styraciflua. and Quercus laurina were found to be sensitive to Focal light, irrespective of Context light. All species responded to Focal light under negative Contrast. Cornus and Persea grew taller and more slender as Focal light increased, particularly under null contrast. There is evidence suggesting that plant growth is dependent on the contrast measured. Thus, it would be relevant to devise a functional classification of tree species that considers their response to both direct light and luminosity of the immediate environment as measured by a contrast value.
Keywords
Cartesian Plane, Canopy Filter, Light Context, Shade Tolerance, Sunflecks, Light Plane
Introduction
Spatial heterogeneity is a constant characteristic of ecosystems. Incident sunlight is probably the most heterogeneous and dynamic factor affecting plants in the forest understory ([47]). The physical structure of the forest acts as a diffusing, filtering, and shading device with effects that differ depending on the size and location of openings in the canopy ([57]). Even in relatively uniform and dense canopy forest stands, significant spatial variation exists in light transmission to the understory ([46], [9], [34], [61]). Changes in forest structure produce light flecks of different size, from sunflecks up to gaps, whose incidence govern the duration and intensity of radiation and creates contrasting conditions below the canopy ([53], [6], [7], [43], [34]). While light heterogeneity on the forest floor influences the growth and survival of seedlings and saplings ([55], [40], [62]), accurate determination of the light environment to which individual plants are subject remains a challenge ([49]). Measurement of spatial and temporal variation in light environments associated with forest gaps is also technically challenging ([65], [2], [17], [36]) and is further complicated by the lack of an adequate descriptive framework for the depiction of gaps ([33]) and sunflecks ([48], [57]). Most gap models assume distinct gap phases with horizontally uniform light distribution at the small scale ([17], [42]). However, the common use of mean values means that these models fail to consider, for instance, shading interactions at the forest floor level ([5]).
A general characteristic of such gap models is their one-dimensionality, which spans from a given minimum to a given maximum value along an incident light axis ([29]). However, the need to better understand how the surrounding light environment either limits or enhances plant growth and survival has been widely recognized. Individual plants must cope with spatial variation of many resources, including light, and such functionally important heterogeneity is expected to be multidimensional. For instance, access to sunlight is generally negatively correlated with moisture and can shift the balance between the positive and negative effects of microsites or growth areas, with consequent effects on plant performance ([45], [59], [58], [25], [5]).
Some studies have addressed the plasticity of plant responses to changing environments, although incorporation of quantitative determinations of environmental heterogeneity in these studies is rare ([14]). In this paper, we consider “contrast” (defined in relation to the immediate environment of light and shade) to be an important component of the environmental variation to which an individual is exposed ([30]). We evaluate plant response to light, with an explicit consideration of surrounding light conditions or context. Instead of pooling a number of observations into one average value, we distinguish two components of the light environment at a given growth point: a reference value (focal point) and a context value, and refer to this bivariate representation as the “light plane”. We propose that measurement of the difference between these two values enables classification of the overall light environment into three contrasting types: (1) null (C=), where the values of both light components are equal; (2) positive (C+), where the focal light value is higher than the context value; or (3) negative (C-), when the focal light value is lower than that of the context. Conventional use of the light average assumes that Focal = Context. However, only where the contrast is null can spots or patches be aggregated in a larger, internally homogeneous environment, at either the high or low extremes of the light gradient. In these terms, we would expect an increasing frequency and intensity of disturbance to drive contrast values towards zero, i.e., where the contrast is null and highly lit, patches are abundant in the environment. However, null contrasts would be rare in old-growth understory, while positive and negative contrasts would be frequent and associated with the presence of uneven deep shade, intermittently broken by sunflecks. We hypothesize that a homogeneous environment (e.g., low light levels in the understory) may intensify local stress, while some amount of contrast (e.g., low light levels within a gap) may have a balancing effect on plant performance. Plant response to direct light therefore differs in positive, null, and negative contrasts depending on the shade-tolerance attributes of each species. Species that respond positively to increasing light in null contrast growth areas will be considered more heliophilous than those responding to light in negative contrast areas, which will, in turn, be more heliophilous than species responding to positive contrasts.
To explore the functional effects of light heterogeneity, we assessed the early life-stage performance of five tree species native of southern Mexico (Alnus acuminata, Cornus excelsa, Liquidambar styraciflua, Persea americana, and Quercus laurina). Previous studies in the area indicated that these species differ in terms of shade-tolerance and thus offer a range of plant responses suitable to explore the effects of light heterogeneity in their immediate growing environment. We suggest that plant responses to homogeneous and contrasting conditions can contribute to a more profound understanding of shade tolerance variation between species. The spatial light contrasts defined in this study are the result of a number of forest attributes, including stem density, basal area, mean tree height and, crown cover (Tab. 1), that can be related to natural or induced disturbance patterns.
Tab. 1 - Proposed relationships between forest structural attributes and ecological interactions in trees and saplings within focal and context areas, presented in a hypothetical, successional gradient: shadeC= denotes null contrast under permanent shade; C- denotes negative contrast; C+ denotes positive contrast; lightC= denotes null contrast under permanent light; (H): relatively high values; (I): intermediate values; (L): relatively low values.
| Structural attributes |
Interactions | shade C = | C + | C - | light C = | References | ||
|---|---|---|---|---|---|---|---|---|
| Focal | Focal | Context | Focal | Context | Focal | |||
| L | L | H | H | L | H | - | ||
| Canopy filter |
Basal area | H | L | H | H | L | L | Ediriweera et al. ([18]), Comeau ([12]) |
| Crown cover | H | L | H | H | L | L | - | |
| Stem density | H | L | I-H | H-I | L | L | Comeau ([12]) | |
| Crown height | I-L | H | I-L | L-I | H | H | Ediriweera et al. ([18]), Comeau ([12]) | |
| Physical condition |
Root competition | H | L | H | H | L | L | Chapin et al. ([8]), Huante et al. ([24]), Coomes & Grubb ([13]) |
| Nutrient availability | L | I-H | L | L | I-H | I-H | Chapin et al. ([8]), Huante et al. ([24]), Coomes & Grubb ([13]), Bazzaz ([2]) |
|
| Light availability | L | H | L | L | H | H | Pearcy et al. ([48]), Smith et al. ([56]) | |
| Air temperature fluctuation |
L | H | L | L | H | H | Leakey et al. ([32]) | |
| Soil moisture | H | L | H | H | L | L | Chapin et al. ([8]), Huante et al. ([24]), Coomes & Grubb ([13]) |
|
| Plant Reaction |
Shade tolerance | H | H | L | L | H | L | Montgomery & Chazdon ([38]), Canham ([6]) |
| Risk of photoinhibition | L | L | H | H | L | H | Powles ([50]) | |
| Light use efficiency | H | H | L | L | H | L | Pearcy et al. ([48]), Küppers ([31]) | |
| Water use efficiency | L | L | H | H | L | H | Hanba et al. ([23]) | |
Methods
Study site
We conducted the study at Rancho Merced-Bazom, a private farm in the central highlands of Chiapas (Mexico), 2350-2400 m a.s.l., 16° 44′ N, 92° 29′ W]. The regional climate is temperate-subhumid, with mean annual temperature of 12-14 °C; mean annual rainfall of 1250 mm ([19]). Most (85%) of the rainfall occurs from May through October, and nocturnal frosts can be common at ground level in open areas from December to March. The soils are moderately deep loams, clay loams, or sandy-clay loams and are derived from Tertiary limestone. The original forest cover corresponded to associations of oak forest, pine-oak forest, and evergreen cloud forest ([3]). The moderately disturbed stands at the study site comprise many (30-35) canopy and understory tree species, whose upper crowns are often well illuminated due to the sparse distribution of large canopy trees (>35 m in height - [21]). The crowns and branches are typically highly colonized by epiphytes as ferns, orchids and bromeliads.
Plots and forest gaps
We located eight gaps within a forested area of approx. 50 hectares (ha), each surrounded by a belt of forested habitat. The E to W width of such habitats was at least equivalent to the longest gap axis (d); thus, plot size was proportional to gap size. The majority of the plots were located > 100 m apart (only plots 1 and 2 were 60 m apart). We erected a barbed-wire fence around each plot to prevent grazing and trampling. We established E to W transects, located 3 m apart within each plot, with intersection points marked every 2.5 m. The coordinates of each intersection provided the spatial reference for both seedling transplantation and hemispherical photography, both of which were carried out at the center of the resulting area (7.5 m2), referred to as the growth area (GA).
Light assessment
Hemispherical photographs were taken between 07:00 and 11:00 a.m. in overcast daylight in April 1999, coinciding with the annual maximum openness of the forest canopy. The plot perimeter was included in the series of photographs. The camera was positioned 1.2 m above the ground, at approximately twice the initial height of the tallest transplanted seedling, and oriented so that the upper portion of the picture was north. We used a reflex Pentax camera with a Sigma 8-mm hemispherical lens and black and white film (Ilford 400 ASA). The images were digitized with a scanner at 75 dots per inch (dpi). We set the gray level threshold at the middle of the gray scale (256 classes). Hemispherical photographs were analyzed using the software HEMISOFT® v.5 ([60]), obtaining the Direct Site Factor (DSF, %), which is the proportion of the full above-canopy sunlight reaching the understory (considered in this study to be 1.2 m above the forest floor).
Spatial light variation
Light variation was described using the DSF obtained for each photograph, which represented the focal light (Focal); the context value (Context) is the average of the DSF values of the eight surrounding points (a total of 60 m2). Both values are included in the light contrast (C) equation (eqn. 1):
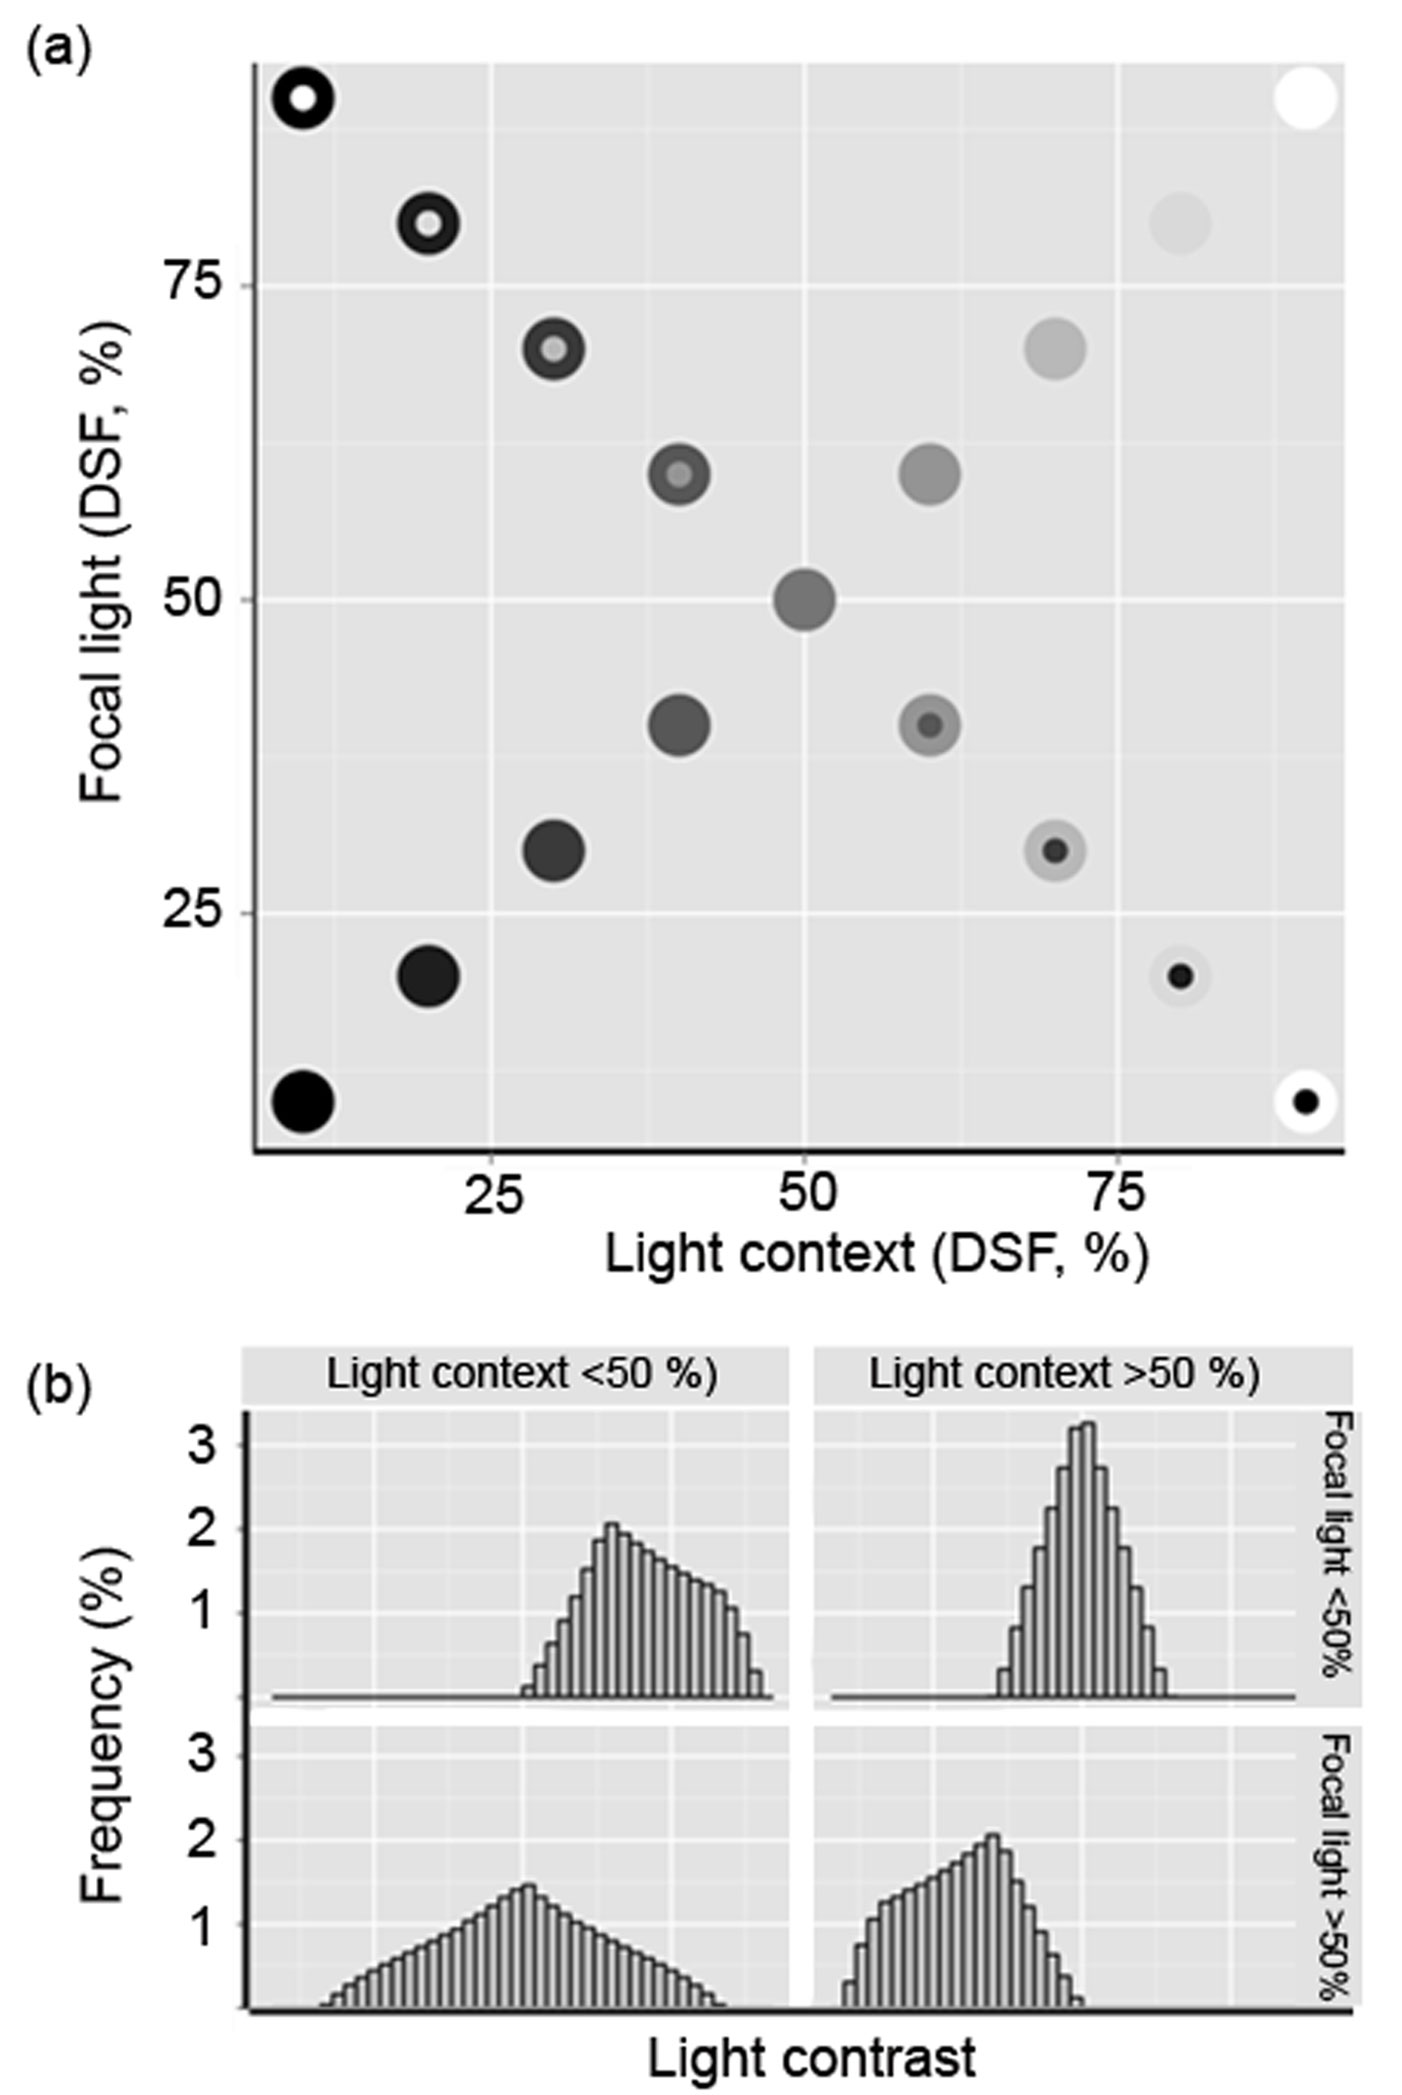
Based on this expression, and with the Focal values in the ordinate and Context values in the abscissa, we mapped the light contrast determined for each pair of values (Fig. 1) in the understory of the eight forest stands. We used this contrast to characterize light environments as either negative (C- < -0.01), null (-0.01≤ C= ≤ 0.01) or positive (C+ > 0.01).
Fig. 1 - Spatial heterogeneity of light conditions. (a) Hypothetical light plane with focal light ranging from DSF < 5% to DSF = 100% (completely open; upper right panel) and the corresponding light context values. The diagonal represents the identity line. Negative and positive light contrasts are located below and above the line, respectively; (b) Frequency distribution of expected light contrast types in each of the four Cartesian plane quadrants in (a), which can be related to varying levels of canopy openness due to disturbance.
Transplanted species
In March 1999, we transplanted one-year-old seedlings of five common native tree species of cloud forests in Mexico ([22]). The species used were (in hypothesized increasing order of shade-tolerance, based on seed size correlation - [44]): Alnus acuminata Kunth (n = 92), Liquidambar styraciflua L. (n = 124), Cornus excelsa Kunth (n = 124), Quercus laurina Bonpl. (n = 131), and Persea americana Mill. (n = 125). Seedlings were planted following a random sequence of species. We measured individual stem height (SH) and basal stem diameter (BSD) at 15 months and 27 months after transplantation. These variables were used to assess plant performance and were combined in an allometric shape ratio expression in order to describe the relative stem height in relation to stem thickness (stem slenderness, SS - eqn. 2):
Statistical analysis
We used covariance models, classified by contrast type, allowing for either a linear or quadratic relationship. Stem height (SH), basal stem diameter (BSD), both log transformed, or stem slenderness (SS) at 15 and 27 months after transplantation, served as response variables and focal light was an independent variable. This approach allowed us to compare the effects of light on plant performance within different light environments by performing separated regressions within each contrast type, when warranted by an omnibus covariance test. All statistical analyses were performed using IBM-SPSS version 19 ([26]), R ([51]), and RStudio ([54]).
Results
Light plane
The range and relative frequencies of possible contrast values are illustrated in Fig. 1. The upper right quadrant represents the most open and disturbed forest conditions, where highest Focal and Context values are likely to be found (strong C= dominance). This may happen when disturbance has just created a gap. The lower right quadrant includes shaded patches surrounded by lighted areas (C- dominance). This condition may result from tall plants remaining in a gap after disturbance or because of incipient secondary vegetation growth. The upper left quadrant features conditions where focal light is high, but the surroundings are dark (C+ dominance). This could be due to the loss of one or more branches of some well-developed trees or a forest that has been selectively harvested but is fairly well developed. The lower left quadrant depicts the set of values that are likely to be found under well-preserved forest conditions (greatest contrast evenness). Our study plots were located in this region.
Light heterogeneity in the study area
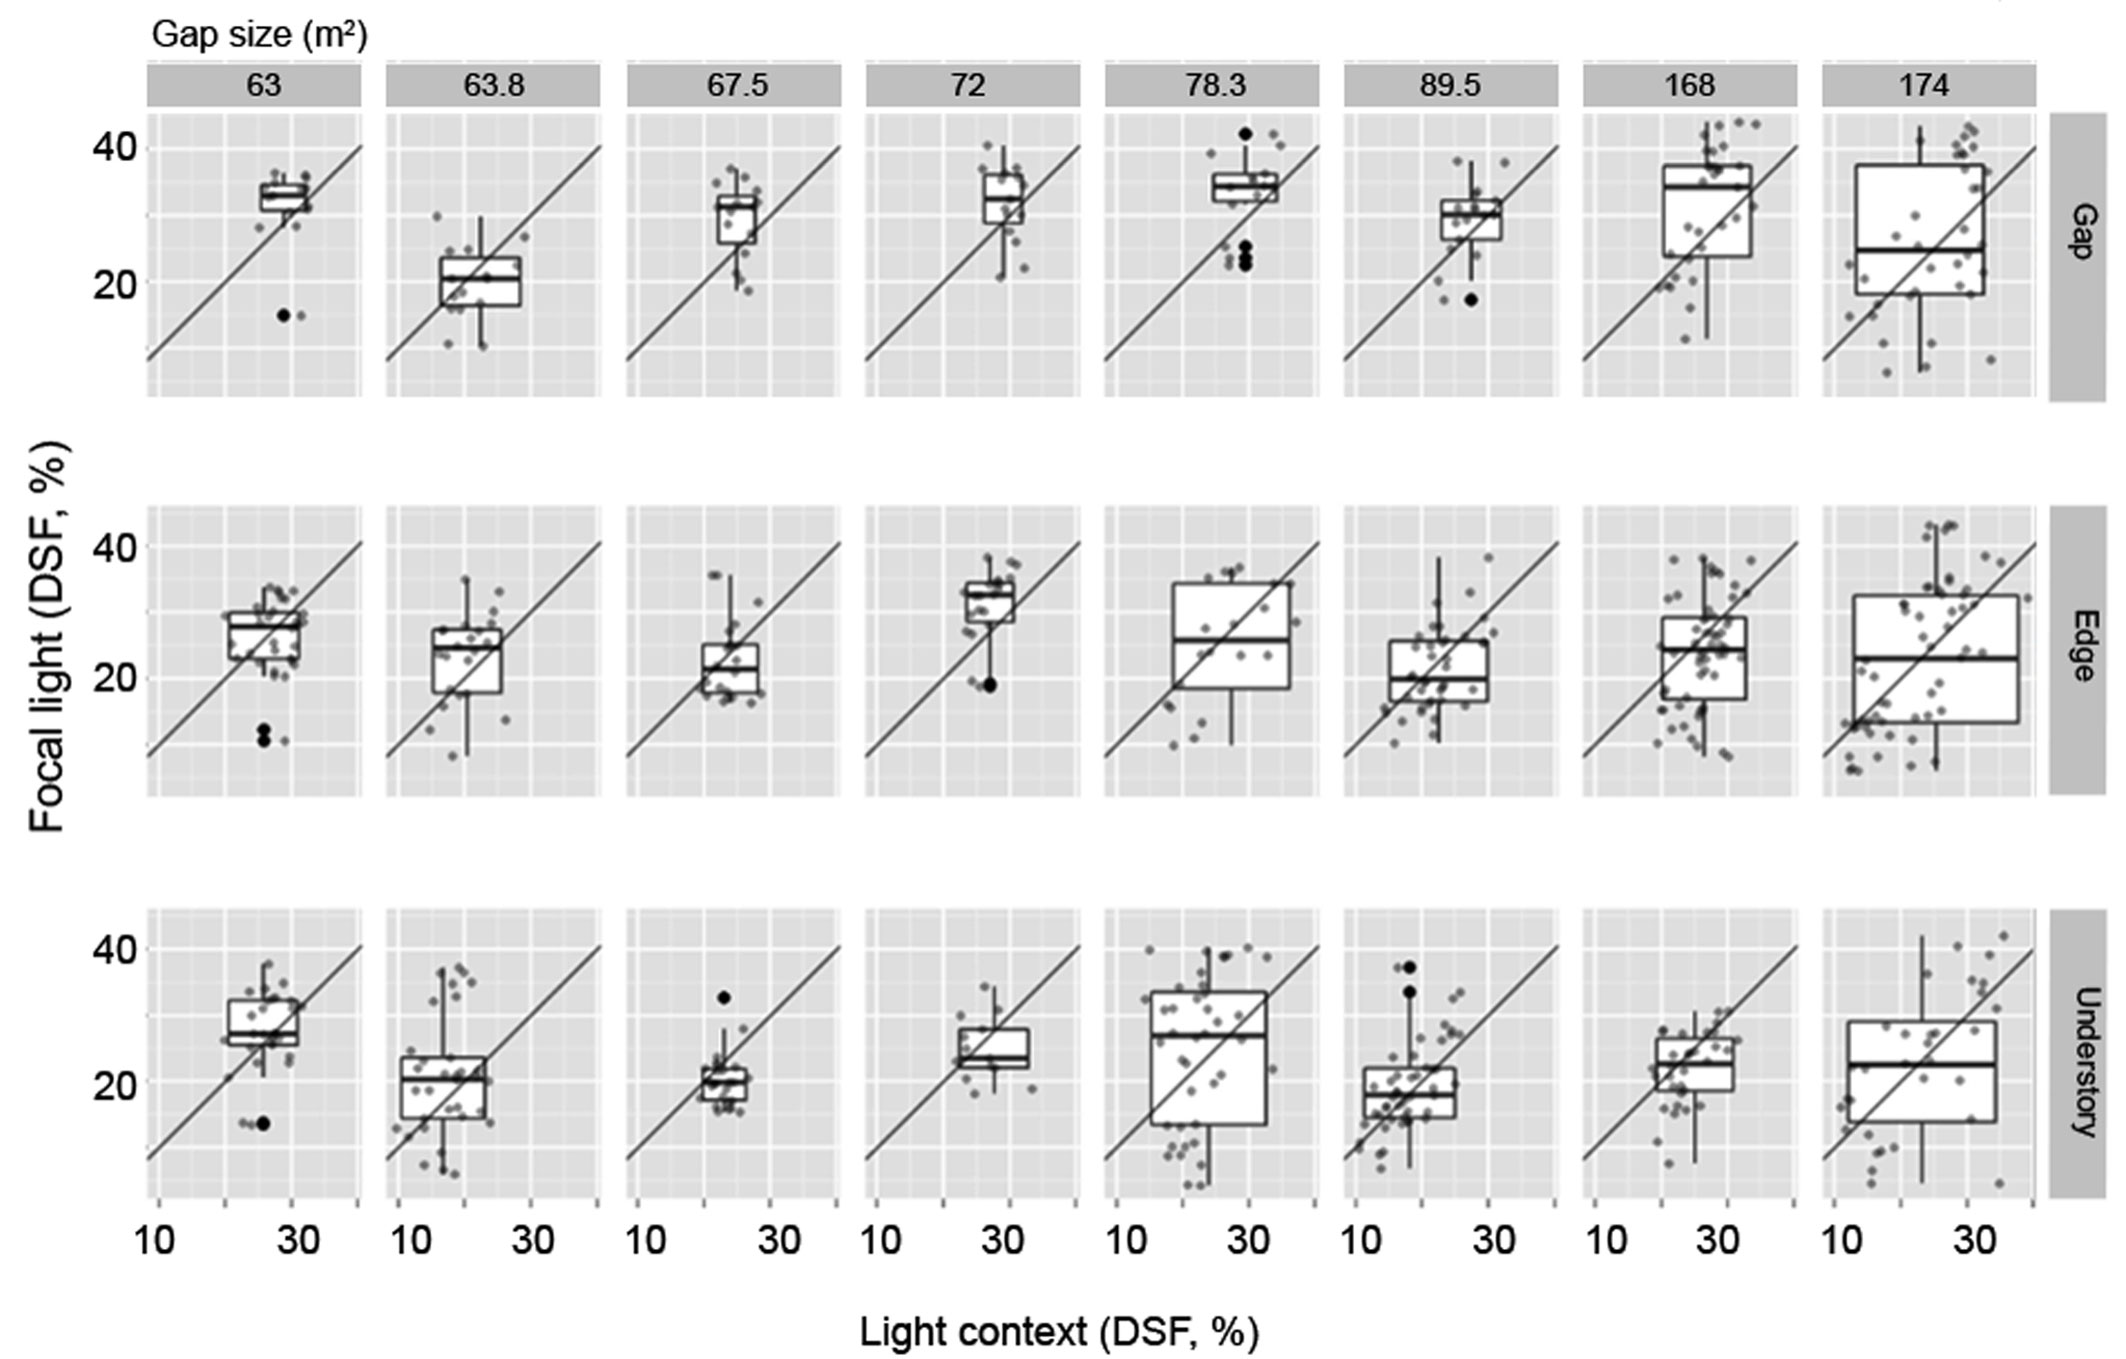
We found no Focal values with a DSF >45% in any of our study plots (Tab. 2), and only 27% of the patches could be considered to be internally homogeneous (Focal = Context, close to the identity line in Fig. 1). Positive contrasts (Focal>Context) accounted for 39% of the points found above the identity line, while negative contrasts (33.8%) were confined to the area below the identity line (Focal<Context). Estimates of DSF decreased with increased distance from the center of the gap (linear regression: F[2, 681] = 49.08, R2 = 0.126). Fig. 2 shows the bivariate distribution for each plot and condition (understory, edge, and gap). The light-contrast fields of gaps are confined, as expected, to the upper right quadrant, and are mostly found in small gaps (except in plot 2). Plots 5 and 3 have larger and more heterogeneous gaps (Tab. 2). In general, we observed that the understory provides a more heterogeneous condition, with the exception of plots 1, 5 and 6. We found that was not confined to the lower left quadrant.
Tab. 2 - Description of eight study plots at Rancho Merced-Bazom, in the central highlands of Chiapas (Mexico). Size of forest gaps, total plot size, and mean light direct site factor (DSF ± SE) in each plot are presented. Values of DSF that share the same letter do not differ significantly at P<0.05. (n): number of samples taken in each habitat condition.
| Characteristics | Plot | |||||||
|---|---|---|---|---|---|---|---|---|
| 1 | 2 | 3 | 4 | 5 | 6 | 7 | 8 | |
| Gap area (m2) | 89.5 | 63.8 | 174 | 78.3 | 168 | 67.5 | 63 | 72 |
| Plot area (m2) | 682.5 | 450 | 945 | 577 | 892.5 | 472.5 | 577.5 | 375 |
n (Gap+Edge+Us) |
17+40+47 | 15+22+33 | 36+58+32 | 15+22+40 | 31+56+32 | 15+22+26 | 15+32+28 | 15+22+13 |
DSF (%) |
20.9 ± 0.67b | 17.7 ± 0.86a | 21.7 ± 0.81b | 23.7 ± 1.05b | 25.8 ± 0.63c | 22.7 ± 0.62b | 27.1 ± 0.59c | 26.0 ± 0.89c |
| Latitude | 16° 44′ 06″ | 16°44′ 08″ | 16°44′ 22″ | 16°44′ 25″ | 16°44′ 26″ | 16°44′ 21″ | 16°44′ 21″ | 16°44′ 25″ |
| Longitude | 92° 29′ 18″ | 92°29′ 19″ | 92°29′ 21″ | 92°29′ 18″ | 92°29′ 24″ | 92°29′ 27″ | 92°29′ 27″ | 92°29′ 27″ |
| Altitude (m a.s.l.) | 2420 | 2390 | 2420 | 2410 | 2410 | 2400 | 2410 | 2460 |
| Slope | 4 | 9 | 4 | 5 | 5 | 2 | 14 | 5 |
| Aspect | SW | SW | SE | W | N | NE | SW | W |
Fig. 2 - The framework proposed to characterize the light landscapes in forest systems, applied to each habitat type as defined by the distance d to the center of the gap, with main radius r: Gap (d ≤ r), Edge (r <d≤ 2r), Understory (2r<d≤ 3r) in eight plots. Plots were arranged along an axis of disturbance that was deemed to correlate with gap size. The plots are light-contrast fields, mapping data into a space defined by its conditions of illumination, where context light is plotted on the x-axis and DSF on the y-axis.
Plant response to light heterogeneity
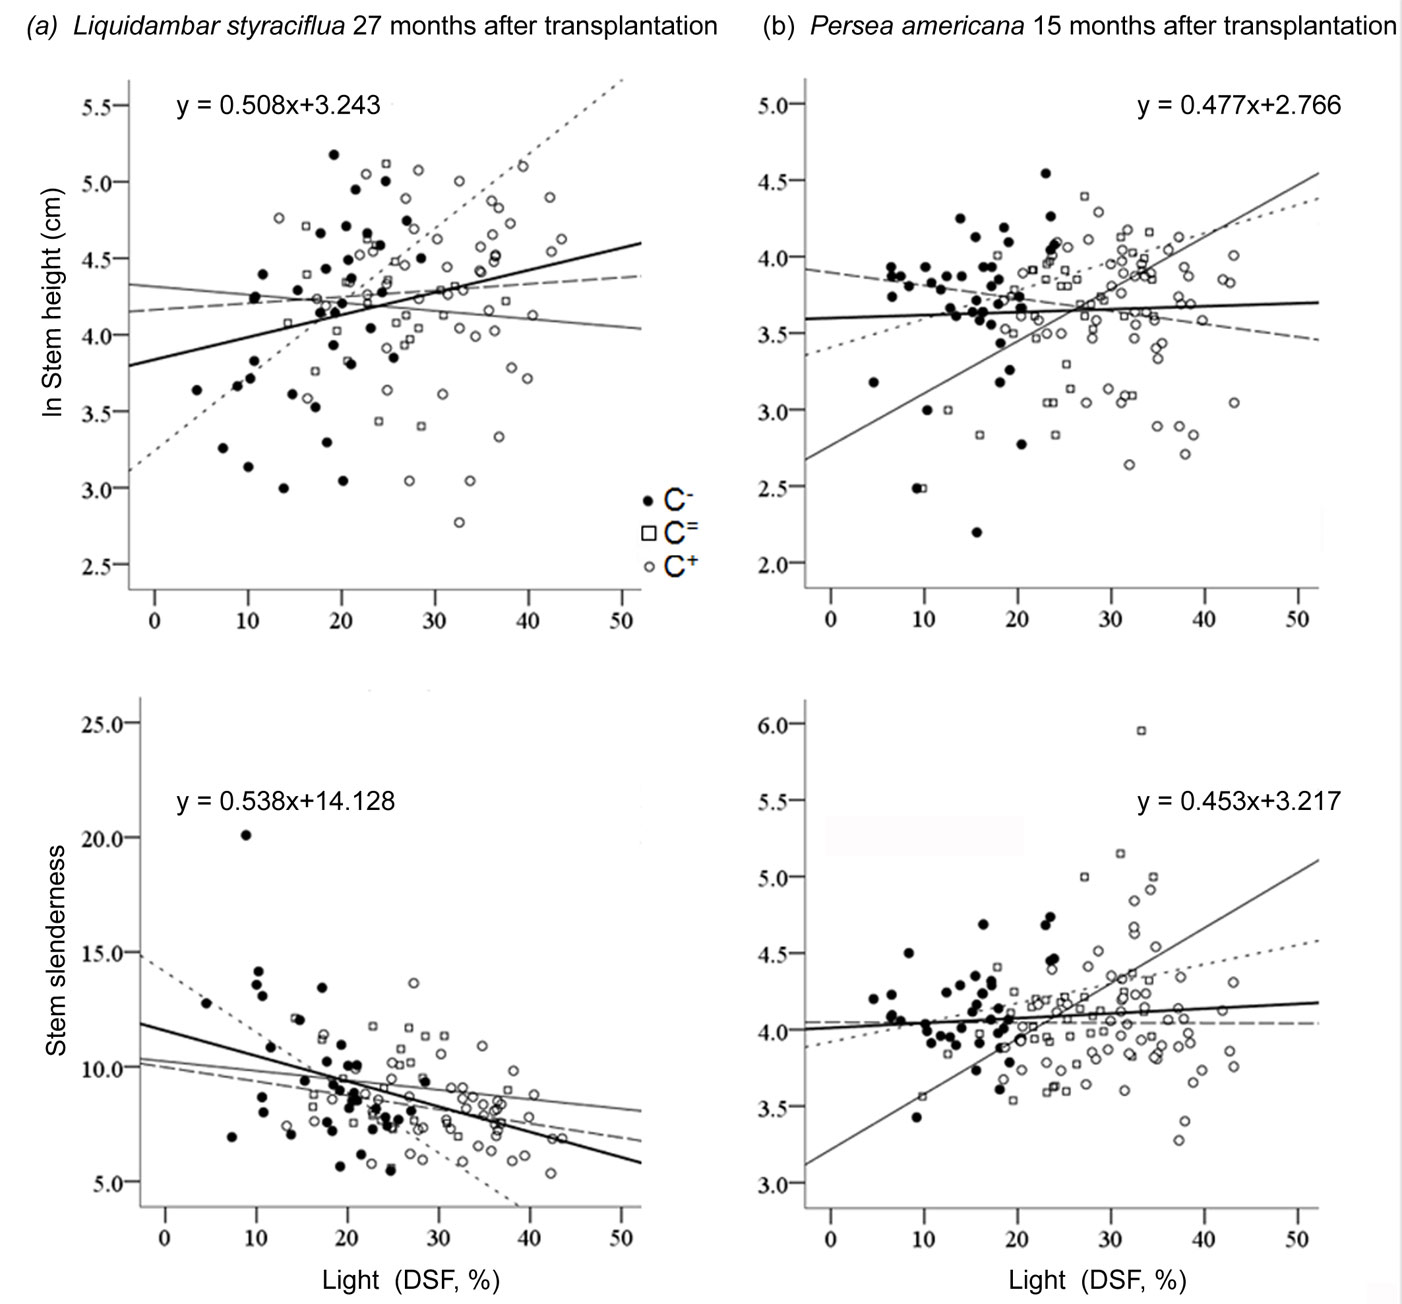
Only the performance of Liquidambar and Quercus could be explained by focal light, independently of Context. After 27 months of growth in understory locations that received more direct sunlight, Liquidambar (Fig. 3) grew taller (F[1, 105] = 6.67, P = 0.011, R2 = 0.05) with thicker stems (F[1, 105] = 16.61, P<0.001, R2 = 0.13), and the plants were less slender overall (F[1, 105] = 23.94, P < 0.001, R2 = 0.18). Similar trends were observed at the first evaluation (15 months). However, stem slenderness was not found to be related to DSF at that point. Quercus developed slightly slender stems at higher values of DSF, but this was only detectable at the first evaluation of growth, 15 months after transplantation (F[1, 105] = 6.16, P = 0.014, R2 = 0.04). None of the study species responded to focal light within a C+, but significant effects of the other two contrast types were found. In the case of Liquidambar, the omnibus covariance test revealed the presence of a significant interaction between focal light and contrast type (all P < 0.038), which suggests that distinct regressions can be used under each contrast type. In the case of Persea, this interaction was also significant but only at the first growth evaluation for stem height (P < 0.028) and stem slenderness (P < 0.001). In the case of Cornus, this same interaction was only found to be significant at the second evaluation of stem height (P < 0.029). On the other hand, Alnus and Quercus did not respond to contrast type interactions in any of the cases.
Fig. 3 - Linear regression of sapling response as a function of focal light in different light contexts: negative contrast (dotted line), null (black thin line), and positive contrast (dashed line). (a) Response of Liquidambar, 27 months after transplantation; (b) Response of Persea, 15 months after transplantation.
Shade in brighter ontext (C-)
Plant performance of all species, except Cornus, was explained by focal light (DSF), when seedlings were exposed to negative contrasts during growth. The effect of focal light was observed in the first evaluation of SH in Alnus (quadratic regression: F[2, 18] = 5.38, P = 0.015, R2 = 0.32) and of SS in Persea (linear regression: F[2, 35] = 4.85, P = 0.013, R2 = 0.21 - Fig. 3). Quercus BSD and SS responded to focal light at 27 months after transplantation in this C- (quadratic regression: F[1, 25] = 3.49, P = 0.046, R2 = 0.16 and F[1, 25] = 9.05, P = 0.001, R2 = 0.37, respectively). Significant effects of focal light on Liquidambar were found at both evaluations but only in the C- (Fig. 3). Both SH (F[1, 41] = 4.86, P = 0.03, R2 = 0.08) and BSD (F[1, 41] = 3.99, P = 0.052, R2 = 0.07) were positively related to light (linear regression). At 27 months after transplantation, similar trends were observed in Liquidambar SH (linear regression: F[1, 33] = 11.50, P = 0.002, R2 = 0.24) and BSD (F[1, 33] = 13.55, P = 0.001, R2 = 0.27); at this evaluation, focal light also explained a negative response in SS (F[1, 33] = 13.42, P = 0.001, R2 = 0.27 - Fig. 3).
Similar light (C=)
Stem height of saplings of Cornus showed a positive relationship to DSF at the first evaluation (quadratic regression: F[2, 34] = 6.23, P = 0.005, R2 = 0.23). At 27 months after transplantation, the SS of Cornus could be explained by focal light (quadratic regression: F[2, 33] = 3.15, P = 0.056, R2 = 0.11). The response of Persea to focal light was observed at the first evaluation under null Contrast in both SH and SS (linear regression: F[1, 35] = 5.55, P = 0.024, R2 = 0.11, and F[2, 33] = 7.93, P = 0.008, R2 = 0.16), with positive effects presented in both response variables (Fig. 3).
Discussion
Forest structure and understory light environments
As Veblen ([63]) and Denslow et al. ([16]) found in southern temperate and tropical forests, estimates of relative direct sunlight were negatively correlated with the distance of each point to the center of the gap. However, the low level of explained variance (about 10%) suggests the existence of a potentially large number of fine-scale multivariate microhabitats. In our study, this heterogeneity was expressed in the low proportion of null contrasts. Gap habitats are dominated by C+ (50%) contrasts and not, as expected, by those of C=. This result is understandable when considering that the small study gaps mostly featured a shade context, where incident light was higher than that of a sunfleck but lower than that of a gap. While Focal values that are higher than those of Context imply positive contrasts, only the lower portion of Context values (Fig. 1 - lower left quadrant) include the shade conditions implied in the definition of a sunfleck ([10]). Moderate natural or human disturbance regimes contribute to spatial light heterogeneity within uneven-aged stands, where a large number of fine-scale microhabitats are possible. More extreme Contrast values may be less frequent but occur as the result of the low-intensity but chronic disturbance regime undergone by the study plots in recent decades. Our study allowed to explore predictions of the model only in the lower portion of the focal light and context gradients, indicating the need for further investigation in larger forest gaps and (or) less dense forest stands, in order to encompass the entire potential range of values.
To date, the spatial structure of understory microhabitats has not been satisfactorily described ([1], [57]), and inconsistencies in the choice, interpretation, and implementation of thresholds have led to inconsistent estimates of the relevance of key features, such as forest gaps, forest edge, and sunflecks, as well as the understory or null gaps ([33], [56], [48], [32], [57]). Our results suggest that the light plane and contrasts, which are relatively easily obtained from field measurements or observations, may help distinguish the relative role of transient light on plant performance within a particular spatial scale.
Plant responses to light environments
In open habitats, C- may have supplementary effects on Liquidambar and Quercus, since these species responded to C- by producing longer and stronger stems (Liquidambar). High rates of net carbon gain in shade-intolerant species allow seedlings to grow rapidly in height and, thereby, outcompete slower-growing neighbors ([64]). However, certain species are unable to fully exploit periods of extremely strong light ([55]), probably due to low relative humidity and/or high leaf temperature load ([66], [41], [37], [4]) or photoinhibition ([50], [28] - Tab. 1). Thus, while Liquidambar is regarded as a typical heliophilous (shade-intolerant) species, analysis of its performance as a function of some of the proposed light heterogeneity metrics provides an insight into its more complex responses to spatially and temporally varying environments.
Outside the gaps, the response to C- in forests with low-disturbance levels could be explained where species tend to avoid focal shade and utilize intermittent radiation from neighboring sunflecks. In this regard, it has been suggested that a given sunfleck can increase the use efficiency of a subsequent sunfleck, provided that the period of low light between the two sunflecks is short ([48]).
On the other side of the shade-tolerance spectrum, Quercus and Persea presented the expected early allocation of resources to stem diameter (and possibly below-ground growth) that has been reported for shade-tolerant species ([27], [35]). Persea responded positively to the focal light, when its context was similarly illuminated (null contrast). This finding suggests that this species may take advantage of the availability of light in patches that are larger than its growth area, such as a small gap (i.e., focal area + context area = 67.5 m2), where the response of Persea could be even more rapid than that presented by Liquidambar. This agrees with previous studies of Persea americana, which is considered to be a light-demanding, fast-growing climax species that presents a high-light saturation point for photosynthesis (more related to heliophilous species), a rapid response to sunflecks, and considerable drought tolerance. It has been interpreted that these functional traits provide this species with an adaptive advantage for colonizing small gaps, when the forest canopy is disturbed, and will tolerate shade conditions during regeneration in old-growth forests ([15], [67]). Spatial heterogeneity can affect performance at any stage of the plant’s life, but the consequences may be more severe in early life cycle stages ([20]). The plasticity observed in Persea agrees with that reported in previous studies ([46], [52]), suggesting that shade-tolerant climax species may display a wider plasticity because of the significant ontogenetic changes that occur throughout their life cycle. This finding also suggests that established saplings of shade-tolerant species can increase their investment in foliage, increasing plant size at the expense of roots, while species that are intolerant of shade cannot ([39], [35]).
This study presents a novel way to quantify at stand level the notion of complementary patches that represent possible temporal and spatial shifts in the balance between the positive and negative effects of microsites ([45], [59], [58], [25]).
We recognize that measuring forest light environments with hemispheric photography implies high spatial correlation if the images are separated by only a few meters. However, in our study site the abundant presence of epiphytes, vines and lianas, along with a dense shrub layer, produce considerable variation in light conditions within the regeneration stratum that is not necessarily detectable when using neighboring photographs. Moreover, light conditions were evaluated at each location at the beginning of the study but not at the end. Secondary succession in these forests may be highly dynamic, and the abiotic conditions experienced by the plants at the beginning of the study may differ considerably from those prevalent after a period of 27 months. In addition to light availability, plant performance is determined by ecological interactions between standing trees and saplings, in terms of above and below-ground resource availability. The spatial light contrasts defined in this study reflect a number of forest structural attributes at the canopy and understory levels, including stem density, basal area, mean tree height, and crown cover, that collectively determine the forest light filter (Tab. 1). Regardless of how light is measured, or even how other environmental variables such as slope angle or soil humidity are assessed, it is possible to extract the focal and context spatial components in order to generate the Cartesian plane. Our study shows that taking the direction of light variation into account provides strong support to the proposition that light contrast provides a valuable and informative measure for the characterization of species response to light environment and represents an improvement over the traditional one-dimensional light gradients that are customarily in use.
The heterogeneity model proposed in this study warrants further exploration, including analysis of additional computation expressions. For instance, the examination of contrasts of focal light with the minimum light context or maximum light context, or contrast in time between initial and final value recorded within a given neighborhood. Experimental studies on the effects of spatial light contrasts could profitably be conducted with young plants, as well as herbs, over shorter time-spans, under field, common garden, and controlled growth conditions. We recognize the need to further explore the effect of the light environment heterogeneity on physiological responses at the level of the photosynthetic apparatus, incorporating a larger number of plant species in order to reflect a wider shade-tolerance gradient.
Conclusions
Plant performance very likely depends on the relative conditions of the light environment within their habitat. The results of this study suggest that, in addition to taking point-level data regarding the direct light received at the growing spot, it is useful to consider light variation measured in context environments within the forest understory. The response of plant species to different light contrasts suggests that responses to changing light may prove effective in plant species functional classification schemes, providing a framework for a more detailed functional account than that represented by the common extremes of high-light demand and shade-tolerance. Such an increased variety of criteria in the recognition of functional types of tree (or shrub and herb) species may be of value in managing highly diverse forests, where ecological theory related to gap-phase regeneration and abrupt habitat transitions may not necessarily apply in a conveniently straightforward manner. An integrated study of plant performance could also include additional gradients of the resources (e.g., water stress) and regulators (e.g., heat load) that interact in numerous ways with light availability and its heterogeneity. Careful examination of long-term ontogenetic trends may enhance our understanding of the ability of plants to respond to environmental heterogeneity through successional change ([11], [35]).
Acknowledgements
We thank A. Luna-Gómez, M. Martínez-Icó, H.E. Castañeda-Ocaña, and I. Romero-Nájera for their help during fieldwork, and K. McMillan for comments and a revision of the English language. The Consejo Nacional de Ciencia y Tecnología (CONACYT) provided a scholarship to GMD (Ref. no. 124319). Research was supported by the European Commission through the SUCRE Project (ERBIC-18TC 970146; INCO-DC Programme, Framework 4), the BIOCORES Project (ICA4-TC-2001-10095; INCO Programme, Framework 5), the FOREST Project (Alpha Programme of the European Commission, 2005-2007), and by Federal subsidies to MGE at ECOSUR (from 1997 and thereafter).
References
Gscholar
Gscholar
Gscholar
Gscholar
CrossRef | Gscholar
Gscholar
Gscholar
Gscholar
Authors’ Info
Authors’ Affiliation
Miguel Equihua
Red de Ambiente y Sustentabilidad, Instituto de Ecología A.C. (INECOL), Apartado Postal 63, 91000 Xalapa, Veracruz (Mexico)
Departamento de Conservación de la Biodiversidad, El Colegio de la Frontera Sur (ECOSUR), Apartado Postal 63, 29290 San Cristóbal de Las Casas, Chiapas (Mexico)
Corresponding author
Paper Info
Citation
Méndez-Dewar G, González-Espinosa M, Equihua M (2014). Spatial heterogeneity of light and tree sapling responses in the understory of disturbed montane forests. iForest 8: 448-455. - doi: 10.3832/ifor1195-007
Academic Editor
Francesco Ripullone
Paper history
Received: Dec 04, 2013
Accepted: Jul 24, 2014
First online: Oct 08, 2014
Publication Date: Aug 02, 2015
Publication Time: 2.53 months
Copyright Information
© SISEF - The Italian Society of Silviculture and Forest Ecology 2014
Open Access
This article is distributed under the terms of the Creative Commons Attribution-Non Commercial 4.0 International (https://creativecommons.org/licenses/by-nc/4.0/), which permits unrestricted use, distribution, and reproduction in any medium, provided you give appropriate credit to the original author(s) and the source, provide a link to the Creative Commons license, and indicate if changes were made.

Web Metrics
Breakdown by View Type
Article Usage
Total Article Views: 55376
(from publication date up to now)
Breakdown by View Type
HTML Page Views: 46134
Abstract Page Views: 3522
PDF Downloads: 4184
Citation/Reference Downloads: 27
XML Downloads: 1509
Web Metrics
Days since publication: 4308
Overall contacts: 55376
Avg. contacts per week: 89.98
Article Citations
Article citations are based on data periodically collected from the Clarivate Web of Science web site
(last update: Mar 2025)
Total number of cites (since 2015): 3
Average cites per year: 0.27
Publication Metrics
by Dimensions ©
Articles citing this article
List of the papers citing this article based on CrossRef Cited-by.
Related Contents
iForest Similar Articles
Research Articles
Use of overburden waste for London plane (Platanus × acerifolia) growth: the role of plant growth promoting microbial consortia
vol. 10, pp. 692-699 (online: 17 July 2017)
Research Articles
Growth, morphology, and biomass allocation of recently planted seedlings of seven European tree species along a light gradient
vol. 13, pp. 261-269 (online: 03 July 2020)
Research Articles
Growth and physiological acclimation to shade in young plants of Adesmia bijuga Phil., a critically endangered species in central Chile
vol. 14, pp. 307-312 (online: 01 July 2021)
Research Articles
Distribution of juveniles of tree species along a canopy closure gradient in a tropical cloud forest of the Venezuelan Andes
vol. 9, pp. 363-369 (online: 08 December 2015)
Research Articles
Optimum light transmittance for seed germination and early seedling recruitment of Pinus koraiensis: implications for natural regeneration
vol. 8, pp. 853-859 (online: 22 May 2015)
Research Articles
Light acclimation of leaf gas exchange in two Tunisian cork oak populations from contrasting environmental conditions
vol. 8, pp. 700-706 (online: 08 January 2015)
Research Articles
Quantifying the vertical microclimate profile within a tropical seasonal rainforest, based on both ground- and canopy-referenced approaches
vol. 15, pp. 24-32 (online: 27 January 2022)
Research Articles
Effects of mild drought on the morphology of sun and shade needles in 20-year-old Norway spruce trees
vol. 12, pp. 27-34 (online: 10 January 2019)
Research Articles
Needle traits of understory Silver fir, Norway spruce, and Scots pine in response to increased canopy openness in a birch-dominated stand
vol. 18, pp. 273-282 (online: 14 October 2025)
Research Articles
The impact of seed predation and browsing on natural sessile oak regeneration under different light conditions in an over-aged coppice stand
vol. 9, pp. 569-576 (online: 04 April 2016)
iForest Database Search
Search By Author
Search By Keyword
Google Scholar Search
Citing Articles
Search By Author
Search By Keywords
PubMed Search
Search By Author
Search By Keyword


