Disassociating tree species associations in the eastern United States
iForest - Biogeosciences and Forestry, Volume 7, Issue 4, Pages 248-254 (2014)
doi: https://doi.org/10.3832/ifor1159-007
Published: Mar 13, 2014 - Copyright © 2014 SISEF
Research Articles
Abstract
Ecologists have a long history of describing species associations including oak-hickory, one of the predominant associations in the eastern United States. But historically, oak composition did not appear particularly related to hickory composition. I assessed the relevance of the oak-hickory association and other associations using older and recent (c. 1981 and 2007) USDA Forest Service surveys. For common hickory and oak species, I determined percent composition (i.e., percent of total stems ≥12.7 cm in diameter, relative density or abundance) in ecological subsections, changes in composition throughout ranges, and compared composition of oaks and hickories and other potential associations using correlation and ordination. Oaks were among the most abundant species while hickories were minor species. Hickory composition was stable while the trajectory of oak continued to decrease during the survey intervals from presettlement dominance. Rank-order correlation between oaks and hickories throughout their ranges was about the maximum as for other species (0.55 and 0.42 during the two survey periods) and in the Oak-Hickory forest region, correlation between oaks and hickories was 0.04 (older surveys) and 0.16 (recent surveys). Oaks were not associated with hickory in the “oak-hickory” forests of Missouri during the mid-1800s, nor were oaks associated with hickory more recently beyond correlations that occur between other eastern forest species. Oak-hickory association in particular is not an informative term for either historical open oak ecosystems or current eastern broadleaf forests. Mixed mesophytic associations, perhaps not best termed as an association, are eastern broadleaf forests where many tree species dominate forested ecosystems in the absence of filtering disturbance. Associations, even if species share similar traits, generally are not strong, stable in time, or extensive in space; differences between species result in different and changing distributions in response to the environment, land use, disease, and other influential factors.
Keywords
Eastern Broadleaf Forests, Mixed Mesophytic, Oak-Hickory, Southern Mixed Forests, Sugar Maple-Beech
Introduction
Plant ecologists have spent well over a century defining plant associations along successional pathways ([29], [31]). Clements ([5]) influenced plant classifications in both the United States and Great Britain ([38]), and Braun ([2]) applied Clementsian classifications throughout the eastern United States. Initial terminology for species associations and other vegetation units became elaborate with many competing terms ([26], [1]). For example, a hierarchical system for the vegetation unit of formations incorporated associations, which in turn were further subdivided into fasciations, lociations, followed by societies of sociation, lamination, sation, and clan, along with seral units of associes-facies-locies-socies-lamies-saties-colony-family, and moreover, different serules ([5]). Although complex terminology has fallen into disuse (due to “hopeless confusion” combined with “inadequate terminology” - [1]), the term association, which is composed of a few genera or species that grow together, remains current, but also may be outdated. Further modifications of vegetation classifications tend to maintain Braun’s associations, with the exclusion of oak-American chestnut (Castanea dentata), due to near extirpation of chestnut (e.g., [12], [25], [9]).
Oak and hickory species are one of the predominant associations throughout the eastern United States since at least 1898 ([29], [21], [12], [25], [9], [34], [28], [7], [11]). Originally, oak-hickory associations may have specified Quercus rubra-Carya ovata forests present in Missouri and in other states near grassland ecosystems, but by 1914 oak-hickory associations had been generalized throughout eastern forests ([22], [13], [27], [5]). Sampson ([30]) stated that before 1900 over 30 well-described associations including oak-hickory existed for Ohio.
Oak and hickory species are more abundant in upland forest rather than floodplain forests and hydric soils; therefore, oak-hickory associations generally refer to species in upland, mesic to xeric sites ([30], [31]). The most common species of oak in the central eastern and southeastern regions (hot continental and subtropical divisions - [10], USDA Forest Service - Fig. 1) of the eastern United States are white oak (Quercus alba, 4.6% of total stems - B. Hanberry unpublished data from USDA Forest Service Forest Inventory and Analysis), chestnut oak (Q. prinus, 2.3%), northern red oak (Q. rubra, 2.1%), black oak (Q. velutina, 2.0%), and post oak (Q. stellata, 1.9%). The most common species of hickories are pignut hickory (Carya glabra, 1.3%), mockernut hickory (C. tomentosa, 1.2%), shagbark hickory (C. ovata, 0.8%), black hickory (C. texana, 0.5%), and bitternut hickory (C. cordiformis, 0.4%). Because there are numerous species of oak and hickories, with unique species attributes, not only may oaks not be associated with hickories, but hickories may not be associated with other hickories and oaks may not be associated with other oaks. For example, bitternut hickory typically is located in floodplain and riparian forests ([3]).
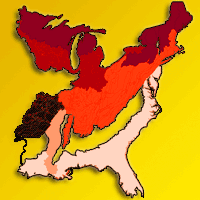
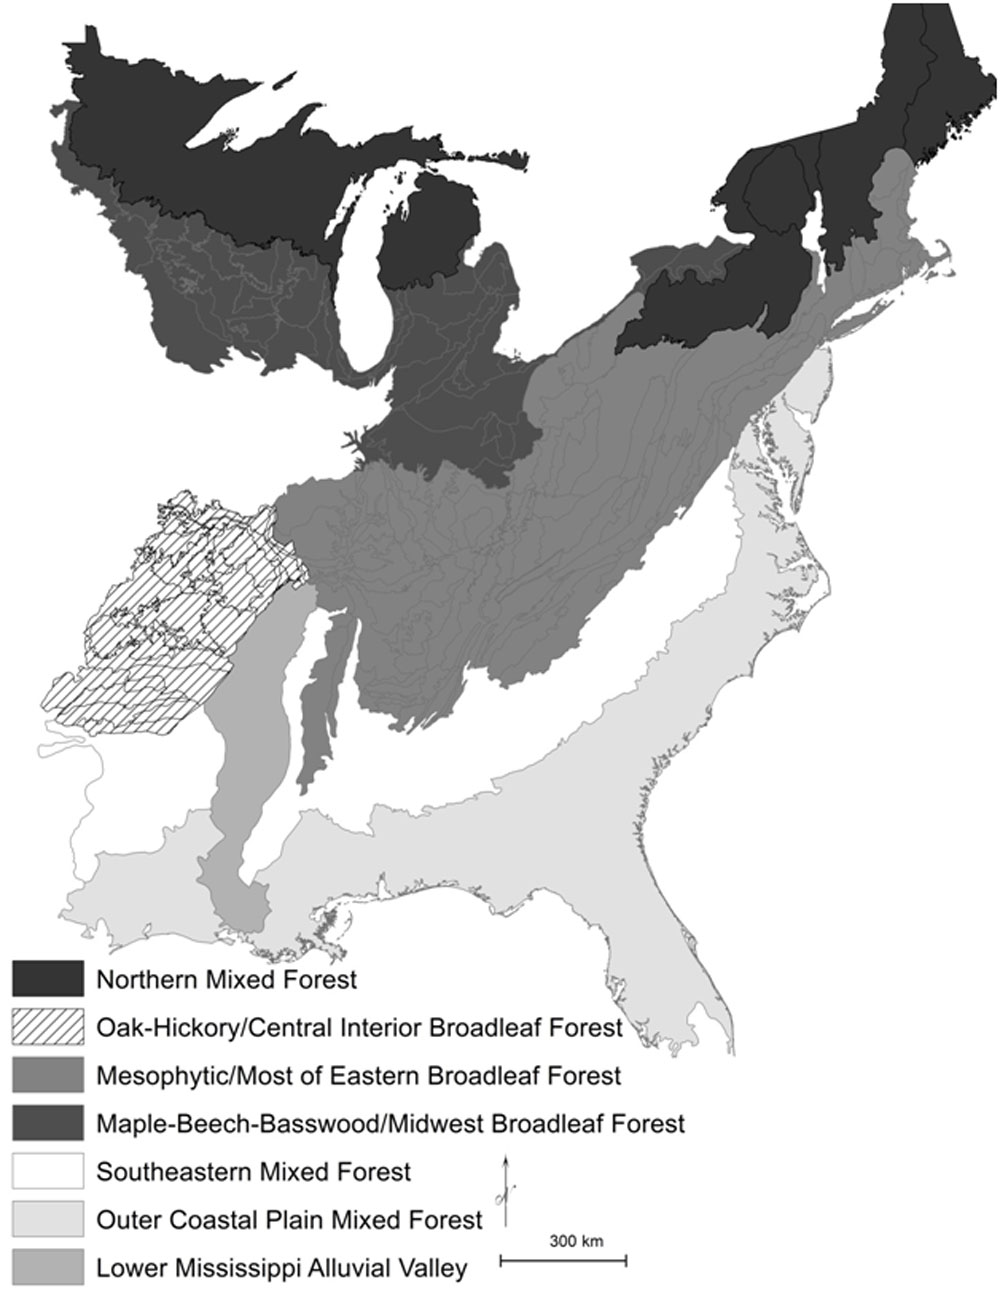
Fig. 1 - The Northern Mixed Forest (warm continental division shaded black), Eastern Broadleaf Forest (hot continental division shaded in darker gray colors and striped), and Southern Mixed Forest (subtropical division shaded in lighter gray colors and white) regions of the United States ([10], USDA Forest Service). The Eastern Broadleaf Forest is divided into an “Oak-Hickory” forest region, a Maple-Beech-Basswood forest region, and a Mesophytic forest region, following Braun ([2]). The Southern Mixed Forest is divided into three ecological provinces of Outer Coastal Plain Mixed Forest, Southeastern Mixed Forest, and Lower Mississippi Alluvial Valley.
Indeed, “oak-hickory” forests were not dominated by oak-hickory during the early- to mid-1800s. Rather, these forest types were open oak savannas and woodlands ([18], [20]). In the stronghold of Braun’s Oak-Hickory forest region in the Missouri Ozarks landscape (Fig. 1), forest composition (i.e., percent of total stems, relative density or abundance) was 26% white oak, 23% post oak, 19% black oak, and 7% blackjack oak, or 75% oak from four species, with a total of 79% oak including all species of oak ([17]). Furthermore, the Missouri Ozarks includes some riverine ecological subsections (Fig. 2 displays ecological subsections), where oak was 10 to 15% of composition, and conversely, in two subsections oaks were 95% of composition. In contrast, all combined hickory records were 5.5% of total composition. In four ecological subsections, hickory reached 8% to 10% of composition, and hickories were the most abundant after oaks where shortleaf pine was not present. However, the hickory genus in Missouri consists of the five common hickory species, and a few more species in addition, and thus each species probably contributed no more than 5% of composition. Based on imbalanced composition, it seems more reasonable to label these forest types as oak or by dominant species of oak rather than as oak-hickory. Moreover, in the Missouri Ozarks, rank-order correlation between percent composition of the two genera was -0.09 and inclusion of all Missouri resulted in a correlation of -0.17 (B. Hanberry, unpublished data).
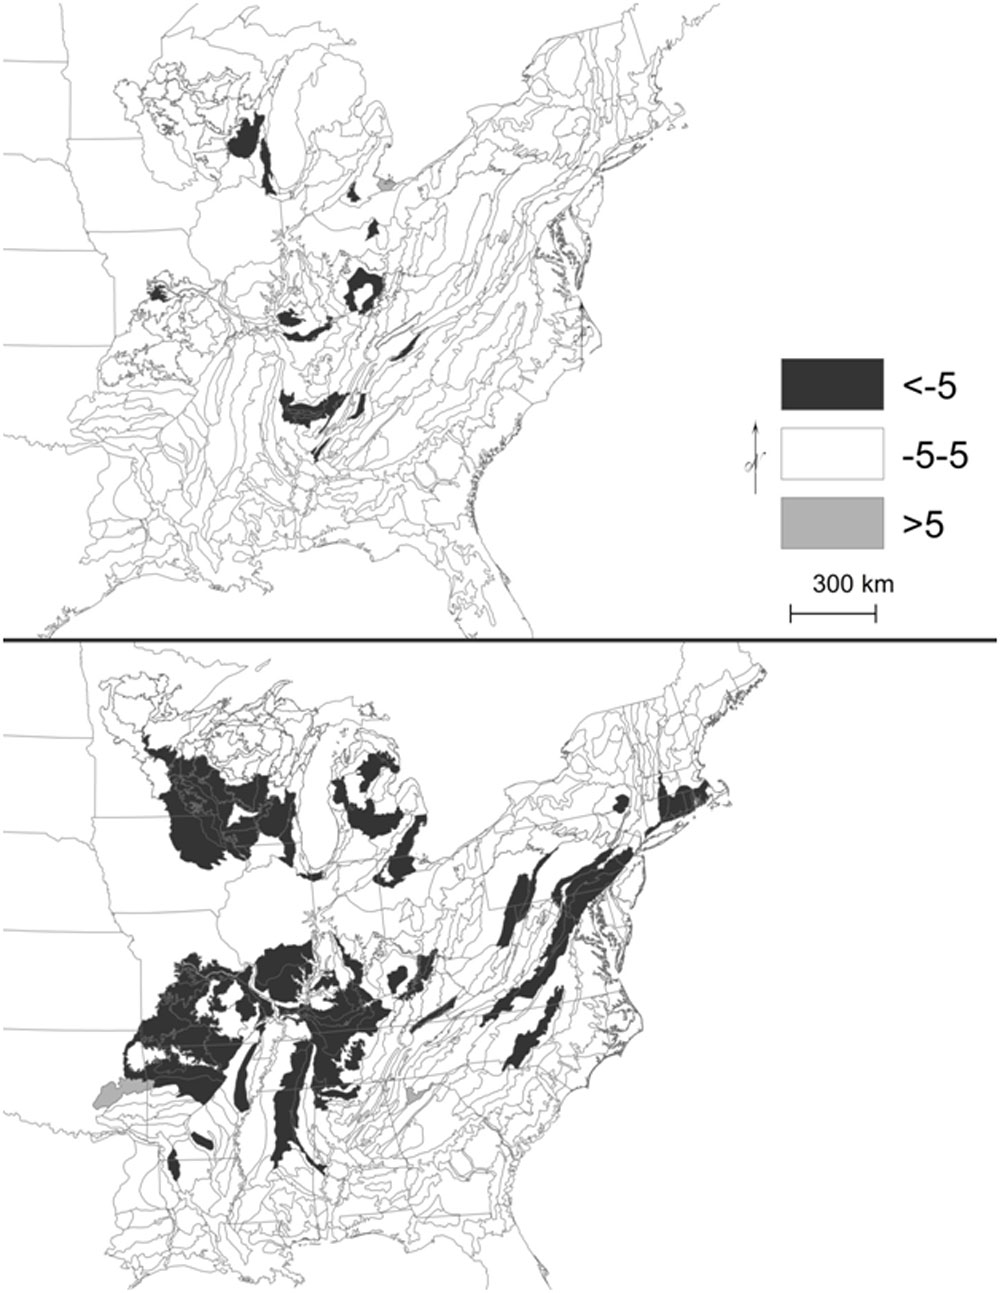
Fig. 2 - Change in percent composition of hickory (upper panel) and oak (lower panel) ranges (five most common species combined). Outlined ecological subsections represent current range (% composition ≥0.5).
Given the lack of any particular balance or correlation between oak and hickory composition historically and differing dynamics and traits between the genera, I evaluated the validity of oak-hickory associations at large extents, including their ranges in the eastern US (Fig. 1), using the oldest USDA Forest Service Forest Inventory and Analysis (FIA) surveys and the most recently completed cycles. Associations should be composed of species that are dominant, whether by coverage, density, or biomass, and additionally, associated species should share similar traits, resulting in similar changes in composition in response to the environment. Do oaks and hickories have dominant composition and share compositional trajectories throughout oak and hickory ranges or in Braun’s Oak-Hickory forest region (Fig. 1)? If oaks were not associated by correlation with hickory in the “oak-hickory” forests of Missouri during the mid-1800s, were oaks associated by correlation or ordination with hickory more recently throughout oak and hickory ranges or in the Oak-Hickory forest region specified by Braun ([2])? Is there a strong association between any eastern forest species, for example oak-red maple (Acer rubrum) or oak-pine or sugar maple (Acer saccharum) -American beech (Fagus grandifolia) or red spruce (Picea rubens)-balsam fir (Abies balsamea)?
Methods
The USDA Forest Service Forest Inventory and Analysis (FIA DataMart, ⇒ http://www.fia. fs.fed.us/tools-data) records data from long term forest plots located about every 2000-2500 ha across the country. Each plot contains four 7.3 m radius subplots, arranged as a central subplot surrounded by three outer subplots. Starting in 1999, plot designs and inventory cycles became standardized, with 20% of plots measured each year in the eastern US. Small trees <12.7 cm in diameter are sampled in smaller areas within subplots and thus, I limited the study to trees ≥12.7 cm in diameter.
From the eastern US regions (warm continental, hot continental, and subtropical divisions - [10]; Fig. 1), I selected the most recently completed cycles, ranging from 2001 to 2012 (mean = 2007, SD = 2.2) and the oldest surveys, ranging from 1968 to 1995 (mean = 1981, SD = 7.6). I retained ecological subsections that matched spatially between the oldest surveys and most recent cycles. Ecological subsections are the smallest ecological unit provided in FIA surveys (mean area = 700 000 ha, SD = 682 000 - [10]; Fig. 2). I calculated percent composition (i.e., percent of total stems; adjusted for diameter bias present in variable radius plot sampling in older surveys) for all plots combined in each ecological subsection to determine dominance and changes in percent composition to assess trajectories for combined hickories and oaks, and other common species, by ecological regions and provinces, modified to better match Braun’s forest regions. I mapped ranges (≥0.5% of total species composition in ecological subsections to exclude transient presence or recent naturalization or plantings outside of ranges that may not become permanent) and changes in range, to examine trajectories in composition spatially. Because unidentified hickories in older surveys became identified in current surveys, I combined the most common five species of each genus and assigned all of the unknown hickory species to the five most common hickory species, which accounted for 95% of hickory stems. The five most common oak species accounted for 65% of oak stems.
I used Spearman rank-order correlation analysis (PROC CORR, SAS software, version 9.1, Cary, NC, USA) to statistically compare composition. I also correlated composition in the Oak-Hickory forest region (Fig. 1). I examined other correlations with oaks, including a combined pine genus (excluding commercial pines such as loblolly, Pinus taeda) and other common species, as well as correlations among sugar maple-American beech-eastern hemlock (Tsuga canadensis) and red spruce-balsam fir associations. I also used non-metric multidimensional scaling (NMS) ordination to represent species composition along axes based on the Sørensen/ Bray-Curtis distance measure (“ecodist” package in R - [16]).
Results
In the Eastern Broadleaf Forest region, the five most common oak species combined were 27% of composition in older surveys and declined to 22% of composition in more recent surveys. Four of the five oak species contributed 4% to 7% of composition, and thus, oaks were among the most abundant species, in the following order of decreasing abundance: red maple, white oak, sugar maple, chestnut oak, yellow-poplar, northern red oak, and black oak. The five most common hickory species combined were 7% to 8% of composition during both survey intervals. Pignut hickory was the most common species at 2% of composition.
By ecological province/forest region, oak composition also declined while hickory composition remained relatively stable. Indeed, in Braun’s Oak-Hickory forest region, oaks declined from 48% to 40% of composition, while hickories were about 11% of composition during both survey intervals (Tab. 1). Similarly, hickory composition throughout its range overall was stable relative to oak (Fig. 2).
Tab. 1 - Compositional percent (percent of total stems ≥12.7 cm in diameter) of common hickory and oak species and relevant species in older (approximately 1984 for each genus) and recent (approximately 2007) FIA surveys by ecological province ([10]) and forest region ([2]).
| Province/Forest Region | Genus or species | Older (%) |
Recent (%) |
Change |
|---|---|---|---|---|
| Midwest Broadleaf Forest/ Sugar maple-basswood-beech |
hickory | 4.47 | 4.66 | 0.19 |
| oak | 16.15 | 11.17 | -4.98 | |
| American basswood | 3.99 | 4.24 | 0.25 | |
| American beech | 0.65 | 0.58 | -0.07 | |
| sugar maple | 4.36 | 5.26 | 0.90 | |
| Eastern, Appalachian, and eastern Central Interior Broadleaf Forest/Mesophytic |
hickory | 8.32 | 7.34 | -0.98 |
| oak | 30.13 | 24.33 | -5.80 | |
| American basswood | 0.52 | 0.59 | 0.07 | |
| American beech | 1.63 | 1.83 | 0.20 | |
| pines | 9.87 | 7.70 | -2.16 | |
| red maple | 7.44 | 10.69 | 3.25 | |
| sugar maple | 3.95 | 4.75 | 0.80 | |
| tuliptree | 4.38 | 4.88 | 0.50 | |
| yellow buckeye | 0.06 | 0.25 | 0.20 | |
| Western Central Interior Broadleaf Forest, Arkansas Ozarks and Ouachita and Valley/Oak-Hickory |
hickory | 11.19 | 11.04 | -0.16 |
| oak | 47.45 | 39.78 | -7.67 | |
| Southeastern Mixed Forest | hickory | 4.54 | 3.66 | -0.88 |
| oak | 12.17 | 9.40 | -2.77 | |
| Outer Coastal Plain Mixed Forest | hickory | 1.24 | 0.71 | -0.53 |
| oak | 3.58 | 2.05 | -1.53 | |
| Lower Mississippi Alluvial Valley | hickory | 2.41 | 2.29 | -0.12 |
| oak | 3.99 | 2.82 | -1.18 |
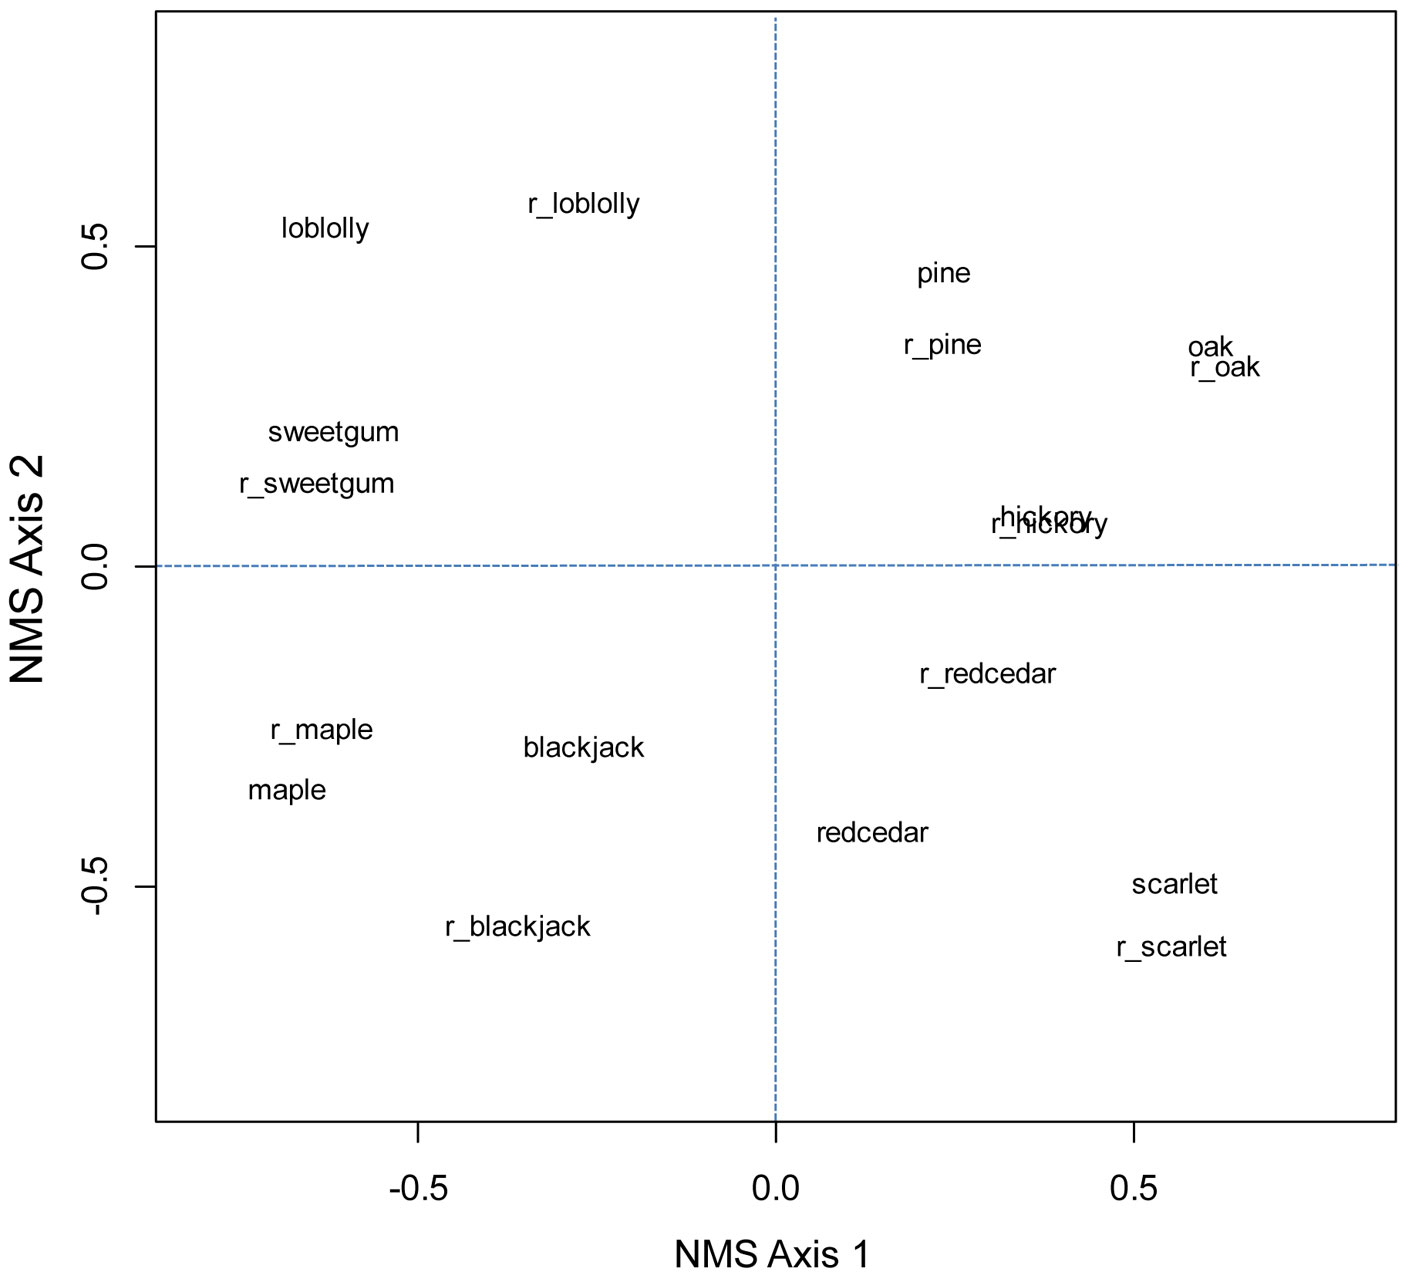
Throughout the eastern US, rank-order correlation values in general were weak (<0.4 - Tab. 2 and Tab. 3). After butternut (Juglans cinerea), hickories had the greatest correlations with oaks, of r = 0.55 in older surveys and r = 0.42 in more recent surveys. In the Oak-Hickory forest region, correlation between oaks and hickories was 0.04 (older surveys) to 0.16 (recent surveys) and not significant. Correlations between sugar maple and American beech were 0.52 in older surveys and 0.42 in recent surveys. Beech had slightly stronger correlations with yellow birch and significant but weak correlations with eastern hemlock. Correlation between red spruce and balsam fir in both surveys was about 0.75 and significant. Ordinations, which account for similar values in composition, did not show that oak and hickory were more similar than oak and pine in either the eastern US or Oak-Hickory forest region (Fig. 3 and Fig. 4).
Tab. 2 - Significant correlations ≥ 0.4 among oak (five most common species), hickory (five most common species), pine (excluding commerical pine species), and red maple. (n/a): not applicable.
| Survey | Species/genus | Oaks | Hickories | Pines | Red maple |
P-value oaks |
P-value hickories |
P-value pines |
P-value red maple |
|---|---|---|---|---|---|---|---|---|---|
| Older surveys |
oaks | 1.00 | 0.55 | 0.20 | -0.08 | n/a | <0.01 | <0.01 | 0.15 |
| butternut | 0.57 | 0.28 | -0.89 | -0.44 | 0.05 | 0.43 | 0.01 | 0.18 | |
| hickories | 0.55 | 1.00 | -0.06 | -0.29 | <0.01 | n/a | 0.37 | <0.01 | |
| scarlet oak | 0.49 | 0.09 | 0.21 | 0.01 | <0.01 | 0.33 | 0.03 | 0.94 | |
| sourwood | 0.48 | 0.02 | 0.12 | 0.48 | <0.01 | 0.93 | 0.52 | 0.01 | |
| yellow-poplar | 0.47 | 0.30 | -0.07 | 0.25 | <0.01 | <0.01 | 0.40 | 0.00 | |
| blackjack oak | 0.42 | 0.00 | 0.16 | -0.26 | 0.01 | 0.99 | 0.35 | 0.19 | |
| eastern redcedar | 0.00 | 0.39 | -0.24 | -0.07 | 0.99 | <0.01 | 0.02 | 0.52 | |
| eastern hemlock | -0.05 | -0.53 | 0.25 | 0.50 | 0.64 | <0.01 | 0.01 | <0.01 | |
| red maple | -0.08 | -0.29 | -0.31 | 1.00 | 0.15 | <0.01 | <0.01 | n/a | |
| black cherry | -0.09 | -0.16 | -0.25 | 0.44 | 0.18 | 0.04 | 0.00 | <0.01 | |
| red mulberry | -0.36 | -0.30 | 0.24 | 0.51 | 0.09 | 0.17 | 0.44 | 0.03 | |
| Recent surveys |
oaks | 1.00 | 0.42 | 0.11 | -0.05 | n/a | <0.01 | <0.01 | 0.51 |
| butternut | 0.54 | -0.24 | -0.41 | -0.75 | <0.01 | n/a | 0.42 | <0.01 | |
| blackjack oak | 0.48 | 0.21 | -0.18 | -0.32 | <0.01 | 0.02 | <0.01 | <0.01 | |
| hickories | 0.42 | 1.00 | -0.06 | -0.24 | <0.01 | <0.01 | 0.02 | 0.01 |
Tab. 3 - Significant correlations ≥0.4 among sugar maple, American beech, red spruce, balsam fir, and eastern hemlock. (n/a): not applicable.
| Survey | Species/genus | Sugar maple |
American beech |
Red spruce |
Balsam fir |
Eastern emlock |
P-value sugar maple |
P-value beech |
P-value spruce |
P-value fir |
P-value hemlock |
|---|---|---|---|---|---|---|---|---|---|---|---|
| Older surveys |
sugar maple | 1.00 | 0.52 | 0.01 | -0.06 | 0.09 | n/a | <0.01 | 0.94 | 0.58 | 0.35 |
| American beech | 0.52 | 1.00 | 0.15 | 0.15 | 0.24 | <0.01 | n/a | 0.34 | 0.28 | 0.02 | |
| yellow birch | 0.43 | 0.58 | 0.30 | 0.16 | 0.13 | <0.01 | <0.01 | 0.05 | 0.17 | 0.19 | |
| flowering dogwood | 0.40 | 0.11 | 0.00 | 0.00 | -0.83 | <0.01 | 0.40 | <0.01 | <0.01 | 0.01 | |
| red maple | 0.20 | 0.39 | -0.43 | -0.31 | 0.50 | <0.01 | <0.01 | <0.01 | <0.01 | <0.01 | |
| white ash | 0.13 | -0.02 | -0.60 | -0.40 | 0.45 | 0.08 | 0.79 | <0.01 | <0.01 | <0.01 | |
| white spruce | 0.10 | -0.04 | 0.30 | 0.46 | -0.16 | 0.46 | 0.81 | 0.22 | <0.01 | 0.30 | |
| red spruce | 0.01 | 0.15 | 1.00 | 0.76 | -0.47 | 0.94 | 0.34 | n/a | <0.01 | <0.01 | |
| balsam fir | -0.06 | 0.15 | 0.76 | 1.00 | -0.28 | 0.58 | 0.28 | <0.01 | n/a | 0.02 | |
| paper birch | -0.15 | 0.02 | 0.47 | 0.36 | -0.35 | 0.12 | 0.89 | <0.01 | <0.01 | <0.01 | |
| Recent surveys |
sugar maple | 1.00 | 0.42 | 0.10 | -0.05 | 0.11 | n/a | <0.01 | 0.53 | 0.61 | 0.24 |
| American beech | 0.42 | 1.00 | 0.10 | 0.01 | 0.35 | <0.01 | n/a | 0.51 | 0.97 | <0.01 | |
| yellow birch | 0.41 | 0.55 | 0.42 | 0.34 | 0.21 | <0.01 | <0.01 | <0.01 | <0.01 | 0.04 | |
| white ash | 0.32 | 0.05 | -0.59 | -0.45 | 0.45 | <0.01 | 0.51 | <0.01 | <0.01 | <0.01 | |
| red spruce | 0.10 | 0.10 | 1.00 | 0.74 | -0.43 | 0.53 | 0.51 | n/a | <0.01 | 0.01 | |
| eastern redbud | 0.00 | 0.48 | 0.00 | 0.00 | 0.00 | 1.00 | 0.04 | <0.01 | <0.01 | <0.01 | |
| balsam fir | -0.05 | 0.01 | 0.74 | 1.00 | -0.27 | 0.61 | 0.97 | <0.01 | n/a | 0.03 | |
| paper birch | -0.11 | 0.13 | 0.61 | 0.58 | -0.07 | 0.26 | 0.31 | <0.01 | <0.01 | 0.56 |
Fig. 3 - Ordination of five most common oak species (oak), five most common hickory species (hickory), (red) maple, pine species excluding loblolly and slash, sugar maple, (American) beech, (eastern) hemlock, (balsam) fir, (red) spruce, and (tuliptree) yellow-poplar for older and recent (prefix of r_ added) FIA surveys.
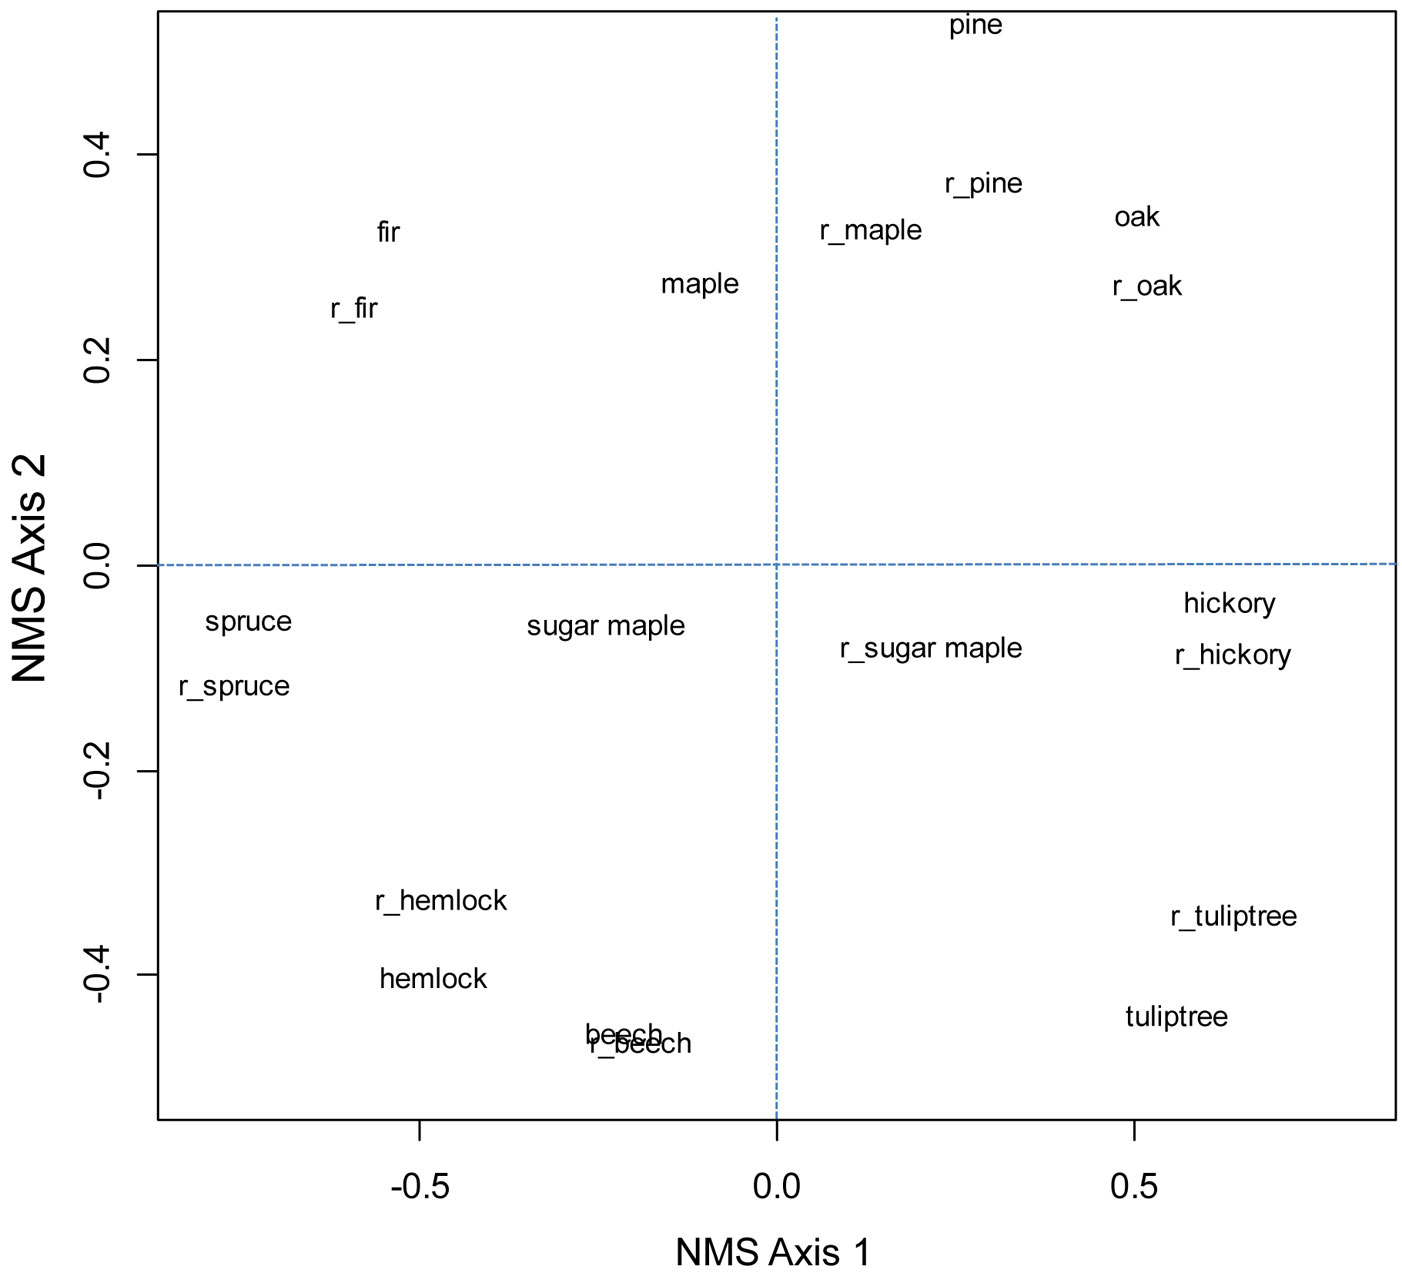
Fig. 4 - Ordination of five most common oak species (oak), five most common hickory species (hickory), (red) maple, pine species excluding loblolly and slash, loblolly pine, (eastern) redcedar, sweetgum, blackjack oak, and scarlet oak for older and recent (prefix of r_ added) FIA surveys in the Oak-Pine forest region.
Discussion
Associations, even if significant, generally are not strong or stable. Associations are difficult to define consistently in space and time, particularly as spatial and temporal scales increase ([15]). Although correlation values between the most common oak and hickory species increased from historical forests of Missouri, which contributed the major extent of Braun’s Oak-Hickory forest region, during the mid-1800s to current forests, r values (i.e., 0.42 to 0.55) and ordinations did not show particular association between oaks and hickories. Ranges of the common oaks and hickories were similar, but otherwise oak composition was about three times as great as hickories and hickory composition was stable while the trajectory of oak continued to decrease from presettlement dominance.
When oak-hickory forest associations were described in the late 1800s, there may have been a greater compositional balance and spatial association of oak to hickory. Extensive harvest of interior eastern forests, which probably were open oak ecosystems where oaks dominated in the presence of frequent surface fires, occurred rapidly during approximately 1880-1920 due to advances in industrialization ([19], but see [24]). Generally, harvest was somewhat selective based on economics to provide certain species and size classes to sawmills; dominant, large diameter oaks probably were the first tree removals. After forest harvest, effective fire suppression began about 1920. Although lack of disturbance initially favored dominant oak trees that were present and regenerating, ultimately, lack of fire allowed colonizing, fire-sensitive species to remain established (but see [24]). Forests increased in stem density, but oaks lost ground compared to numerous fire-sensitive species and are now 55% of the Missouri Ozarks ([19]). Hickories were not particularly favored by fire and have increased in the Missouri Ozarks to 11% of composition.
Perhaps when oak declines to composition levels similar to hickory, correlation will increase, despite differences in life history traits. Nevertheless, it is not informative to name a forest ecosystem type based on two genera with composition no greater than numerous species or genera that are present. Rather, this type of association is termed “mixed mesophytic”, or an association of numerous species (>20 species of many genera - [1]). Mixed mesophytic associations are diverse forests composed of varying species with no particular dominance or shared traits, aside from tolerance to current land use. Mixed mesophytic forests in the central eastern United States, where numerous broadleaf species are present, may be more typically named by location, composition, and vegetation state as eastern broadleaf forests, with “mixed” reserved for mixtures of broadleaf and needled species rather than a mixture of species ([10] - Fig. 1).
Mixed mesophytic forests currently are composed of species that historically were limited to sites protected from disturbance, which filtered species by traits. Historical disturbances otherwise created alternative states, for example, open oak or pine ecosystems in ecological provinces where there was frequent fire disturbance (but see [24]) or floodplain forests where there was flooding disturbance. Mesic sites are not as important for “mesophytic” species as disturbance-free areas, except in sites of extreme moisture stress in very xeric or hydric soils ([17]). The stress of fire and flooding removes establishment of colonizing fire-sensitive and flooding-sensitive species. When species are released from disturbance stress because of fire suppression and river regulation, a wide range of disturbance-sensitive species establish and eventually dominate areas where there used to be an active disturbance regime. Currently, in areas where urbanization and forestry are major land uses, moderately shade-tolerant species such as red maple (see Tab. 1) are most abundant and in areas where intensive agriculture is the major land use, species that are tolerant to exposure are more abundant ([20]).
Other widespread associations in the United States include sugar maple-American beech that developed over hundreds of years without disturbance. There appears to be evidence from historical records that sugar maple-beech was a more representative association than oak-hickory because both sugar maple and beech were dominant and long-lived species with similar traits that represent forests after long periods without disturbance, perhaps a true “climax” association ([32], [14], [4], [23], [6], [37], [36], [35]). Additionally, in the northern lower peninsula of Michigan, historical rank-order correlation was 0.87 (B. Hanberry, unpublished data). Nevertheless, the association was not consistent throughout the eastern US because the two species have different distributions. American beech range extends south to Mexico and used to extend across the country, but now is more limited than sugar maple range, which extends further west. In the northeast, eastern hemlock may have had greater correlation with beech whereas sugar maple gained other tree associates such as American basswood in western regions outside of current beech distribution ([4], [6], [37]). Because long periods without disturbance by current land use (i.e., tree removals occur more frequently than the lifespan of most tree species) are not present in the landscape, sugar maple and beech were not likely to continue as a dominant association; indeed, current correlation between the two species was not particularly strong and American beech currently is a minor species. Sugar maple has increased whereas beech has declined, probably due to multiple factors including forestry selection against beech and larger gaps that favors sugar maple, poor beech dispersal after harvest, and beech back disease (Cryptococcus fagisuga and Neonectria - [8], [33]). Likewise, the oak-chestnut association of the eastern side of eastern broadleaf forests has been disassociated by chestnut blight and subsequent preemptive harvest that removed potentially resistant genotypes. At smaller scales, red spruce-balsam fir may be one of the strongest associations (r = 0.75) due to shared traits, dominance in high elevation or latitude distributions, and similar trajectories.
Conclusions
We have inherited ecological terminology, some of which may never have been essential, including association-segregate, consociation, fasciation, lociation, formation, associes, associes-segregate, and developmental unit ([1]). Oak-hickory association, which is still in use, is not descriptive of either historical open oak ecosystems or current eastern broadleaf forests. The mixed mesophytic association additionally may better align with current terminology by use of the term broadleaf or even deciduous forest rather than refer to an association composed of many species of no particular dominance or shared traits. Many disturbance-sensitive species are present in forested ecosystems in the absence of disturbance, but forest types of multiple species can be specified by location (i.e., eastern, southern, western, northern) and taxonomy (i.e., broadleaf or needled, angiosperm or gymnosperm, or deciduous or evergreen, and mixed to indicate balance between angiosperms and gymnosperms rather than a mixture of species - see Fig. 1). Forest implies a closed state, and in historical forest ecosystems, the open state may be incorporated with composition (i.e., open oak or pine forest ecosystems).
Although tree species share some overlapping traits and consequently, occupy similar sites, because of species-specific differences in traits and general lack of dominance by two species over a large shared extent, strong associations probably are limited in time and space. Additionally, because of differing species dynamics in response to driving factors such as land use and disease, associations do not persist and consequently, it is important not to model future forests based on transitory and weak current associations, i.e., project future movement by groups of species, when species will have different responses to environmental change. Even though more permanent than associations, forest ecosystem types also are not stable; without disturbance, open oak and pine ecosystems transitioned to closed forest composed of numerous species that are fire-sensitive. Mesophytic associations will endure indefinitely, but more simply termed eastern broadleaf forest in the eastern United States where angiosperms are dominant.
Acknowledgments
I thank anonymous reviewers who helped develop this manuscript.
References
Gscholar
Gscholar
Gscholar
Gscholar
Gscholar
Gscholar
Gscholar
Authors’ Info
Authors’ Affiliation
University of Missouri, 203 Natural Resources Building, 65211 Columbia, MO (United States of America)
Corresponding author
Paper Info
Citation
Hanberry BB (2014). Disassociating tree species associations in the eastern United States. iForest 7: 248-254. - doi: 10.3832/ifor1159-007
Academic Editor
Marco Borghetti
Paper history
Received: Oct 22, 2013
Accepted: Feb 24, 2014
First online: Mar 13, 2014
Publication Date: Aug 01, 2014
Publication Time: 0.57 months
Copyright Information
© SISEF - The Italian Society of Silviculture and Forest Ecology 2014
Open Access
This article is distributed under the terms of the Creative Commons Attribution-Non Commercial 4.0 International (https://creativecommons.org/licenses/by-nc/4.0/), which permits unrestricted use, distribution, and reproduction in any medium, provided you give appropriate credit to the original author(s) and the source, provide a link to the Creative Commons license, and indicate if changes were made.

Web Metrics
Breakdown by View Type
Article Usage
Total Article Views: 57678
(from publication date up to now)
Breakdown by View Type
HTML Page Views: 48981
Abstract Page Views: 3178
PDF Downloads: 3905
Citation/Reference Downloads: 18
XML Downloads: 1596
Web Metrics
Days since publication: 4506
Overall contacts: 57678
Avg. contacts per week: 89.60
Article Citations
Article citations are based on data periodically collected from the Clarivate Web of Science web site
(last update: Mar 2025)
Total number of cites (since 2014): 1
Average cites per year: 0.08
Publication Metrics
by Dimensions ©
Articles citing this article
List of the papers citing this article based on CrossRef Cited-by.
Related Contents
iForest Similar Articles
Research Articles
Classification and mapping of Spanish Mediterranean mixed forests
vol. 12, pp. 480-487 (online: 14 October 2019)
Research Articles
Towards a functional phytosociology: the functional ecology of woody diagnostic species and their vegetation classes in Northern Italy
vol. 14, pp. 522-530 (online: 22 November 2021)
Research Articles
Drought effects on the floristic differentiation of Greek fir forests in the mountains of central Greece
vol. 8, pp. 786-797 (online: 08 April 2015)
Research Articles
Changes in aboveground biomass following alternative harvesting in oak-hickory forests in the eastern USA
vol. 8, pp. 652-660 (online: 13 January 2015)
Technical Reports
Remote sensing of american maple in alluvial forests: a case study in an island complex of the Loire valley (France)
vol. 13, pp. 409-416 (online: 16 September 2020)
Research Articles
Changes in tree layer and altitudinal distribution of herbaceous species in temperate old-growth forests over 30 years
vol. 15, pp. 206-212 (online: 11 June 2022)
Research Articles
Typology and synecology of aspen woodlands in the central-southern Apennines (Italy): new findings and synthesis
vol. 13, pp. 202-208 (online: 19 May 2020)
Technical Reports
Evaluating humus forms variation in an unmanaged mixed beech forest using two different classification methods
vol. 5, pp. 272-275 (online: 24 October 2012)
Research Articles
The cork oak in the Mountains of Palermo (Italy): ecological insights from the south-eastern edge of its distribution range
vol. 13, pp. 336-344 (online: 07 August 2020)
Research Articles
Influences of mature Pinus nigra plantations on the floristic-vegetational composition along an altitudinal gradient in the central Apennines, Italy
vol. 13, pp. 279-285 (online: 03 July 2020)
iForest Database Search
Search By Author
Search By Keyword
Google Scholar Search
Citing Articles
Search By Author
Search By Keywords
PubMed Search
Search By Author
Search By Keyword


