Estimating changes in soil organic carbon storage due to land use changes using a modified calculation method
iForest - Biogeosciences and Forestry, Volume 8, Issue 1, Pages 45-52 (2015)
doi: https://doi.org/10.3832/ifor1151-007
Published: Jun 17, 2014 - Copyright © 2015 SISEF
Research Articles
Abstract
Carbon sources and sinks have been widely scrutinized over the last ten years as a result of the Kyoto Protocol. In this paper we added a new concept (standardized reference depth, DSR) to the current calculation method in order to assess and compare the soil organic carbon (SOC) storage changes due to three major land use changes with a certain historical relationship (from primary rain forest to fallow land to natural secondary forest and finally to rubber plantations - Hevea brasiliensis) in a northern tropical ecosystem in southwest China. Over 30 years, the soil organic carbon storage did not decrease significantly with a land use change from primary rain forest to fallow land (approximately 10.3%). However, it did increase significantly (approximately 49.3%) due to conversions to natural secondary forest and rubber plantations (approximately 41.6%). In this region, the soil carbon sequestration at rubber plantations is similar to that of natural secondary forests. Compared with the modified method, the current method overestimated carbon storage on fallow land by 8.8% more than the actual storage (calculated reference depth of 13.9 cm, Dr - DSR = 13.9, without the reference depth standardization process), overestimated carbon storage at rubber plantations by 3.6% (calculated reference depth of 4.9 cm), and underestimated the natural secondary forest carbon storage by 6.4% (calculated reference depth of 9.7 cm). Thus, the modified process using the standardized reference depth for the current method is necessary for the evolution and comparison of soil carbon or other nutrient storage changes.
Keywords
Soil Organic Carbon Storage, Land Use Change, Modified Calculation Method, Rubber Plantation, Tropical Forest, Kyoto Protocol
Introduction
As a result of the Kyoto Protocol, which was established at the United Nations Framework Convention on Climate Change in 1997, all of the signatory countries have their own periodic Kyoto carbon trading quotas and goals for reducing CO2 emissions levels based on the global periodic average quota and their own country’s carbon storage. The identification of plant-soil ecosystems that promote carbon sequestration is therefore of considerable importance ([40]). The quantity and rate of accumulation of carbon in different ecosystems have been widely studied over the last ten years, and the requirement for accuracy in estimating soil carbon storage is increasing. The practice involves the equity and reasonability of each country’s periodic Kyoto carbon trading quotas and goals for reducing CO2 emissions levels in the future.
There are three main reservoirs that regulate the global carbon cycle. From 1750 to 2011, the cumulative anthropogenic CO2 emissions were about 2035 Gt from fossil fuel combustion, cement production, and land use change. Of these cumulative anthropogenic CO2 emissions, 43.24% have accumulated in the atmosphere, 28.83% have accumulated in natural terrestrial ecosystems and 27.93% have been taken up by the ocean ([34]).
Although the natural terrestrial ecosystem is not the largest accumulation reservoir, it can be changed markedly by the direct impact of human activities and is potentially more labile than other reservoirs in the short-term ([2]). It is generally recognized that soils represent the largest proportion of the terrestrial carbon reservoir (approximately 1500 Gt - [2], [3]), and soils contain more organic carbon than the atmosphere and biosphere combined ([27]). The carbon balance of soil inputs and outputs has a critical influence on the concentration of atmospheric CO2; the release of greenhouse gases from the soil could enhance the “greenhouse effect” and, possibly, cause global climatic anomalies, which, in turn, could cause a series of ecological problems and influence the health of ecosystems that support human civilization ([10], [14]).
Land use change is an important factor that controls soil organic carbon storage because it affects the amount, location and composition of the litterfall input, decomposition and processes of organic matter stabilization ([14]). Land use changes, therefore, can change the total amount of soil organic carbon that is stabilized as well as the soil’s environmental factors, such as temperature, moisture, and the accessibility of energy sources for soil organisms ([10]). Land use change, such as deforestation, caused approximately one fourth of the anthropogenic CO2 emissions from 1985-2005 ([1]). Changes in land use and vegetation type also cause soil carbon depletion by influencing soil respiration and carbon fluxes in the soil ([32]). The patterns and dynamics of ecosystem carbon storage after land use changes are of particular interest in estimating the gains and losses of soil carbon at a regional scale ([40], [44]).
Many studies have made great contributions to establishing a more accurate calculation method for soil organic carbon storage (e.g., [15], [4], [33], [35], [19]). Usually, soil organic carbon storage is calculated by multiplying the soil organic carbon content, soil bulk density and soil thickness ([15], [4], [19], [27]). An example of this calculation approach was previously described by Meersmans et al. ([27]).
However, in our opinion, such current calculation method is still insufficient for assessing soil organic carbon storage correctly, because it still lacks the strict sense of comparability among different land uses, especially when different land uses have certain historical relationships. The current method lacks a simple but indispensable parameter, the standard reference depth (DSR). A depth of 100 cm was selected as the most common reference depth (Dr) in order to facilitate comparisons with international literature in related studies ([27]). DSR is the true comparative depth of Dr for land use changes that are due to disturbance or other reasons. The specific standardization process to convert Dr to DSR is described below.
Here, we use an extreme example to explain the great scientific significance and the necessity of reference depth standardization. On a common farmland, if we trample the surface continuously for 10 hours, soil bulk density would increase, and the original thickness of the farmland soil would decline to less than 100 cm (e.g., 80 cm). Using the current method to calculate and compare the soil carbon storage without the reference depth standardization step, we will come to the interesting conclusion that trampling can increase the soil carbon storage. This conclusion is obviously wrong, however, because additional carbon storage was added with the 20 cm of soil depth in addition to the original 100 cm thickness. In fact, the amount of soil organic carbon did not increase or decrease after trampling the soil. To resolve this discrepancy, the equivalent mass basis was used for calculating soil carbon storage to compare different land use types (e.g., [39], [10], [42]). The standardization of the new reference depth is necessary for more accurate calculations if we sample each of the soil layers for bulk density, rather than some of the soil layers only.
Economic tree plantations have been a significant element of land-use conversions ([22]). Globally, the total plantation area was approximately 1.39×10⁸ ha in 2005 and is still expanding rapidly at an approximate annual rate of 2% ([11], [38]). Rubber trees (one of the most economic tree species, primarily originating from Brazil) have been planted in many countries over the past 100 years. The total rubber plantation area globally was approximately 1.01×10⁷ ha in 2010 and 91% of it was located in south and southeast Asia (approximately 9.16×10⁶ ha - [12]). Rubber plantations have expanded rapidly over the past 20 years in tropical Asia and their impacts on regional carbon cycling have drawn worldwide attention. The rate of plantation expansion is similar in tropical China (at the northern margin of tropical SE Asia). With the rapid economic development and the increased demand for natural resources, such as rubber latex, 139 576 ha of natural forest were cleared between 1976 and 2003 in Xishuangbanna. The area of natural forest decreased from 70% in 1976 to 50% in 2003, largely due to the expansion of rubber plantations ([20]). The total rubber plantation area was approximately 4.0×10⁵ ha in Xishuangbanna ([41]). However, even with the large expansion in the area of rubber plantations in Xishuangbanna, and despite of the world’s first crown of the rubber yield production ([48]), the status of soils at rubber plantations as either carbon “sinks” or “sources” is currently unknown.
This study focuses on changes in soil organic carbon storage during primary land use changes in the northern tropical ecosystem (primary rain forest, fallow land, natural secondary forest and monoculture rubber plantation). The main objective was to quantify the changes in soil organic carbon storage using a modified calculation method by including a new concept, the standardized reference depth (DSR), in the calculation for the conversion of primary rain forest to other land uses under heavy human activity in Xishuangbanna. It was expected that the modified method would be useful for accurately estimating soil organic carbon or nutrient storage in terrestrial ecosystems that are experiencing changes in land management.
Materials and methods
Study site
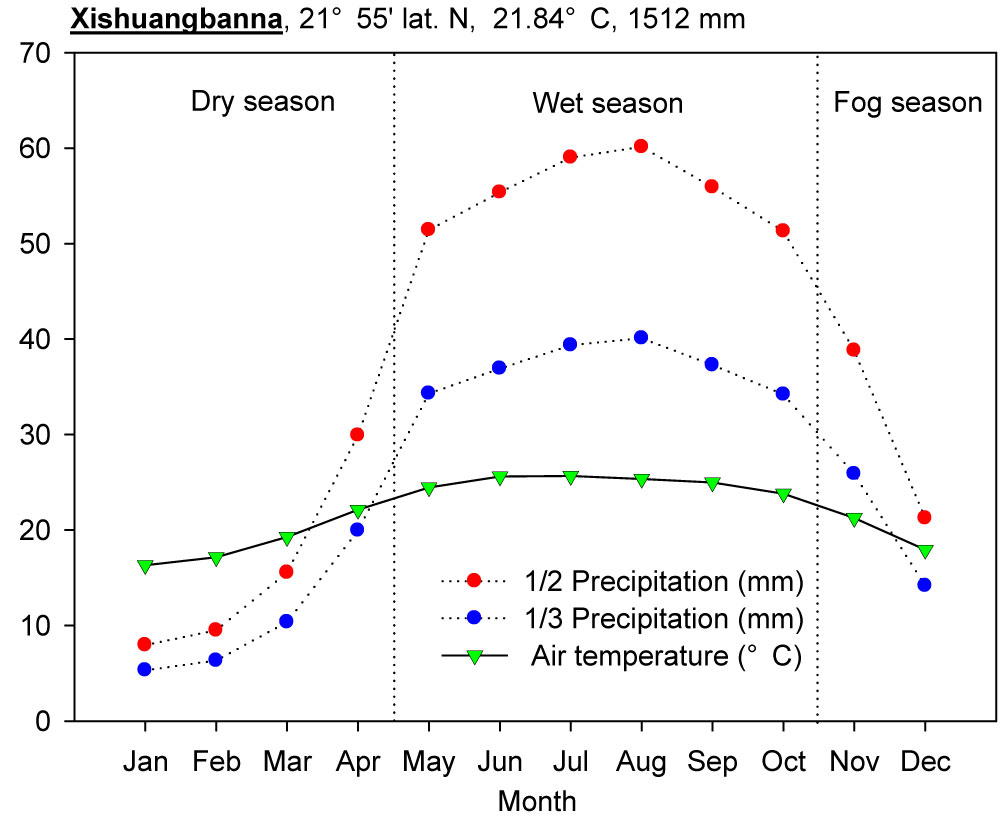
The study was conducted in the Xishuangbanna National Tropical Rain Forest Reserve (21° 09′ - 22° 33′ N, 99° 58′ - 101° 34′ E) in southwestern China, at the northern edge of tropical SE Asia. Located in the East Asian monsoon region, Xishuangbanna is dominated by warm, wet air masses from the Indian Ocean in the summer and continental air masses from the subtropical regions in the winter, resulting in a highly seasonal environment ([7], [24]). Mean annual rainfall was 1512 mm (1980-2008) and mean monthly temperature was 21.7°C (1980-2008 - weather data from the Xishuangbanna Station for Tropical Rain Forest Ecosystem Studies). The climatic ombrothermic diagram is illustrated in Fig. 1.
Fig. 1 - Bagnouls-Gaussen ombrothermic diagram of Xishuangbanna (1980-2008). When monthly precipitation P>100 mm, P is denoted as P’ in the diagram, and P’=100 + (P-100)/10.
The experimental design consisted of four land use types, including primary rain forest (PRF), fallow land (FL), natural secondary forest (NSF), and monoculture rubber plantation (RP) with three replicate profiles at each site. All of the sites were located on yellow latosol, which developed from purple sandstone at elevations of between 560 and 750 m. The map of study sites was previously published by Li et al. ([21]). The main vegetation characteristics, management techniques and the historical relationships among them are described in Tab. 1 ([21]).
Tab. 1 - Vegetation characteristics of the four study sites. (PRF): primary rain forest; (FL): fallow land; (NSF): natural secondary forest; (RP): rubber plantation. Study sites are the same as in Li et al. ([21]).
| Characteristics | PRF | FL | NSF | RP |
|---|---|---|---|---|
| Forest age (year) | >200 | 4~5 | 30 | 30 |
| Canopy height (m) | 35~40 | 2~3 | 10~12 | 18~20 |
| Dominant species | Pometia pinnata, Terminalia myriocarpa, Semecarpus reticulata | Eupatorium doratum, Digitaria ciliaris | Litsea mollis, Litsea umbellate, Castanopsis indica | Hevea brasiliensis |
| Litter-fall (kg ha-1 yr-1) | 10.800 | 6.500 | 14.200 | 7.000 |
| Litter-fall decomposition (kg ha-1 yr-1) | 8.800 | 5.900 | 13.400 | 2.100 |
| Management | No | No | No | Fertilization 2 times yr-1; Mixed fertilizer (N, P, K) 180 kg ha-1 yr-1; Weeding 3~4 times yr-1 |
| Annual harvest | No | No | No | Dry rubber latex 2 600 kg ha-1 |
| Historical land use type | Unknown | PRF | FL | FL |
Soil sampling and analysis
Soil samples were collected in November 2010 from three profiles after the litterfall and grass layer were carefully removed at three slope positions (up slope, middle slope, and down slope) for each type of site. The cores were divided into eight depth intervals: 0-10, 10-20, 20-30, 30-40, 40-60, 60-80, 80-100 and 100-120 cm. The soil bulk density was measured using the cutting ring method ([23]). After removing the visible plant debris, including roots and stones, soil samples were sieved (2 × 2 mm) and dried at room temperature (~20 °C) for approximately 2 weeks. The air-dried samples were stored at room temperature in an air-tight container for chemical analysis. The soil total organic carbon content was analyzed using the wet digestion method ([28], [23]).
Calculation of soil total organic carbon storage
Data from different land uses are listed in Tab. 2. Two different methods were used to calculate the storage of soil organic carbon (SOC) using the same datasets for each land use type. We used the primary rain forest as reference land type since the other three types were all transformed from primary rain forest. The first method was the current method, described by Meersmans et al. ([27]). The second (modified) method is described below.
Tab. 2 - Soil bulk density and soil organic carbon content in the different land uses.
| Replicate profiles |
Soil depth (cm) |
Layer No. |
Soil bulk density (g cm-3) |
Soil organic carbon content (g kg-1) |
||||||
|---|---|---|---|---|---|---|---|---|---|---|
| PRF | FL | NSF | RP | PRF | FL | NSF | RP | |||
| No.1 | 0-10 | 1 | 1.18 | 1.36 | 1.25 | 1.38 | 38.22 | 22.78 | 28.53 | 30.2 |
| 10-20 | 2 | 1.25 | 1.48 | 1.29 | 1.42 | 17.98 | 13.94 | 22.36 | 20.47 | |
| 20-30 | 3 | 1.4 | 1.59 | 1.32 | 1.48 | 11.09 | 10.66 | 20.07 | 12.96 | |
| 30-40 | 4 | 1.36 | 1.62 | 1.33 | 1.45 | - | - | - | - | |
| 40-60 | 5 | 1.34 | 1.69 | 1.34 | 1.51 | 9.91 | 7.06 | 13.88 | 11.21 | |
| 60-80 | 6 | 1.44 | 1.58 | 1.18 | 1.45 | 8.27 | 5.67 | 11.96 | 10.51 | |
| 80-100 | 7 | 1.47 | 1.64 | 1.23 | 1.47 | - | - | - | - | |
| 100-120 | 8 | 1.48 | 1.64 | 1.29 | 1.49 | - | - | - | - | |
| No.2 | 0-10 | 1 | 1.05 | 1.26 | 1.12 | 1.38 | 28.37 | 29.58 | 46.92 | 37.22 |
| 10-20 | 2 | 1.32 | 1.48 | 1.16 | 1.37 | 14.54 | 21.63 | 25.29 | 24.97 | |
| 20-30 | 3 | 1.33 | 1.48 | 1.17 | 1.39 | 8.93 | 11.9 | 18.96 | 20.38 | |
| 30-40 | 4 | 1.33 | 1.6 | 1.26 | 1.45 | - | - | - | - | |
| 40-60 | 5 | 1.45 | 1.62 | 1.22 | 1.45 | 8.84 | 5.71 | 13.27 | 12.53 | |
| 60-80 | 6 | 1.42 | 1.58 | 1.28 | 1.45 | 7.47 | 4.73 | 10.81 | 10.7 | |
| 80-100 | 7 | 1.48 | 1.69 | 1.25 | 1.39 | - | - | - | - | |
| 100-120 | 8 | 1.46 | 1.68 | 1.29 | 1.48 | - | - | - | - | |
| No.3 | 0-10 | 1 | 1.1 | 1.34 | 0.91 | 1.42 | 27.12 | 19.91 | 51.45 | 27.28 |
| 10-20 | 2 | 1.25 | 1.48 | 1.13 | 1.33 | 18.34 | 12.15 | 29.35 | 17.93 | |
| 20-30 | 3 | 1.29 | 1.41 | 1.11 | 1.36 | 14.1 | 11.6 | 22.04 | 22.47 | |
| 30-40 | 4 | 1.25 | 1.52 | 1.09 | 1.29 | - | - | - | - | |
| 40-60 | 5 | 1.3 | 1.5 | 1.23 | 1.35 | 9.14 | 9.42 | 17.45 | 18.81 | |
| 60-80 | 6 | 1.38 | 1.54 | 1.25 | 1.43 | 8.29 | 8.62 | 12.47 | 13.47 | |
| 80-100 | 7 | 1.45 | 1.54 | 1.25 | 1.43 | - | - | - | - | |
| 100-120 | 8 | 1.42 | 1.51 | 1.42 | 1.42 | - | - | - | - | |
If we define A as a soil sampling profile of the primary rain forest and B as a soil sampling profile of one of the three land uses (fallow land, natural secondary forest or rubber plantation), then for an equal soil mass, the soil mass of A with a reference depth (Dr = 1 m of n layers) is equal to the mass of B with a standardized reference depth (DSR of k layers). Hence, we can easily obtain the following inequality (I - eqn. 1):
where ρi is the soil bulk density of the i-th layer of A or B (kg m-3), and Ti is the thickness of the i-th layer of A or B (m).
Using the experimental data for from A and B and the known layer number of n in the Inequality (I), we can calculate k (the last layer number of B). Then, we can obtain the last layer to a standardized reference depth of B (T’Bk) using the following equations (eqn. 2, eqn. 3):
According to results from the literature ([15], [4], [19], [27]), the thickness of the last layer to the reference depth (Dr = 1 m) of A can be calculated as follows (eqn. 4):
where Tn is the thickness of the last (n-th) layer to the reference depth (m).
Based on the same principle as eqn. 4, the thickness of the last layer to a standardized reference depth (DSR) of B can be calculated as follows (eqn. 5):
From eqn. 5, we can obtain the standardized reference depth (DSR, the true depth of the disturbed reference depth - eqn. 6).
If the Ti from the field sampling was the same in the profiles of A and B, with the calculated k, we can deduce that:
- If k > n, then DSR > Dr, suggesting that the soil structure of
Bbecame looser than that ofA. - If k < n, then DSR < Dr, suggesting that the soil structure of
Bbecame tighter than that ofA. - If k = n, then DSR = Dr, suggesting that the soil structure of
Bdid not change from that ofA.
Each layer’s SOC density can be calculated using the following relationship based on previous research ([15], [4], [19], [27] - eqn. 7):
where SOCDi is the SOC density of the i-th layer (kg m-3), SOCi is the SOC content of the i-th layer (g g-1), and K is the correction factor for the carbon analysis method.
The per unit surface area SOC mass of profile A can be calculated using the eqn. 8. The soil carbon storage of A is the sum of the SOC mass densities of every layer in the reference depth of Dr (i.e., SOC density of the i-th layer multiplied by the thickness of the layer, Ti - eqn. 8):
Based on the same principle as eqn. 7, the per unit surface area SOC mass for the profile of B can be calculated using the eqn. 8 as the sum of the SOC mass densities of each layer over the depth of (DSR) as the soil carbon storage of B at a depth of Dr (eqn. 9):
Statistical analysis
In all of the analyses, site types were used as replicate profiles (N = 3). Where sub-samples were collected from each profile at every site type, the mean of the sub-samples was used. An “independent samples t-test” was adopted to compare the means of the standard reference depths and soil organic carbon storage under different land use types with the two different calculation methods. All of the statistical analyses were conducted using the SPSS® 13.0 statistical package.
Results
Standard reference depth (DSR)
We considered the primary rain forest as the reference land use type. According to related studies ([15], [4], [27]), a reference depth of 1 m was selected. The last layer number (k) of the other land uses was calculated using the inequality (I) from Tab. 3. The last layer numbers for fallow land and rubber plantations were 7, which were the same as the reference primary rain forest, but the last layer number of the natural secondary forest was 8.
Tab. 3 - Calculation of the last layer number (k), thickness of the last layer (T’k) and standard reference depth (DSR) for the different land uses considered in this study.
| Layer | Replicate profiles |
Land uses | |||
|---|---|---|---|---|---|
| PRF | FL | NSF | RP | ||
| Last layer (k) | No.1 | 7 | 7 | 8 | 7 |
| No.2 | 7 | 7 | 8 | 7 | |
| No.3 | 7 | 7 | 8 | 7 | |
| T’k (cm) | No.1 | 20 | 6.13 | 7.1 | 13.33 |
| No.2 | 20 | 8.88 | 11.84 | 16.83 | |
| No.3 | 20 | 8.47 | 10 | 15.23 | |
| DSR (cm) | No.1 | 100 | 86.13 | 107.1 | 93.33 |
| No.2 | 100 | 88.88 | 111.84 | 96.83 | |
| No.3 | 100 | 88.47 | 110 | 95.23 | |
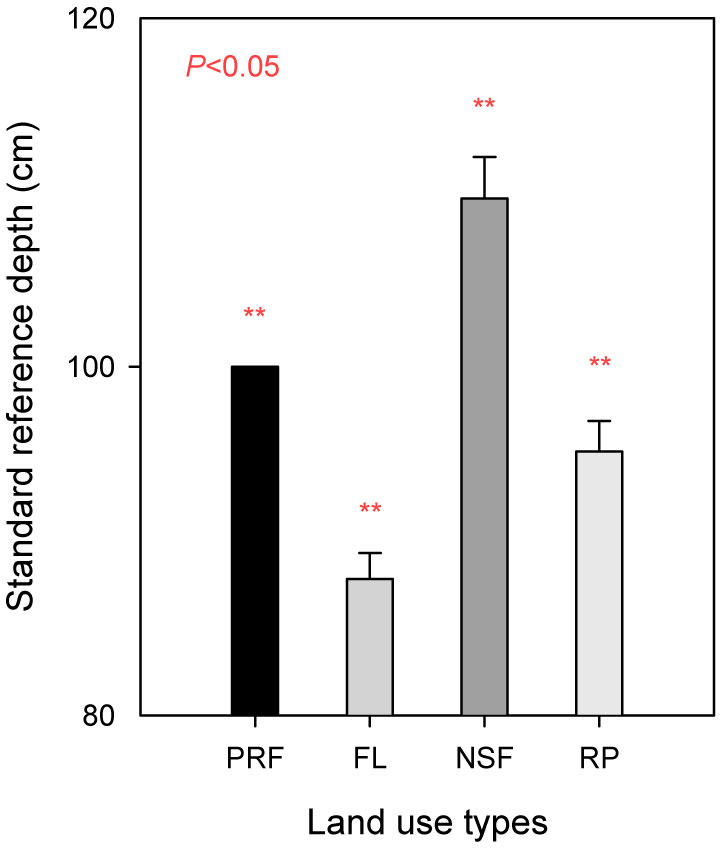
Using eqn. 3, we obtained the last layer thickness (T’k) for fallow land, natural secondary forest and rubber plantations: 7.83 ± 0.86, 9.65 ± 1.38 and 15.13 ± 1.01 cm, respectively (Tab. 3). Using eqn. 6, we obtained the average standard reference depths (DSR) of 87.83, 109.65 and 95.13 cm, respectively (Fig. 2). Compared to the soil for the reference primary rain forest, soil density on fallow land and rubber plantations was significantly higher (13.9%, P=0.005 and 5.1%, P=0.009, respectively), while the soil density for the natural secondary forest was significantly lower (8.8%, P=0.002).
Fig. 2 - Soil standard reference depth (DSR) for four land uses in Xishuangbanna, according to soil reference depth (100 cm) and soil bulk density, obtained using the eqn. 6.
Soil organic carbon storage for different land uses
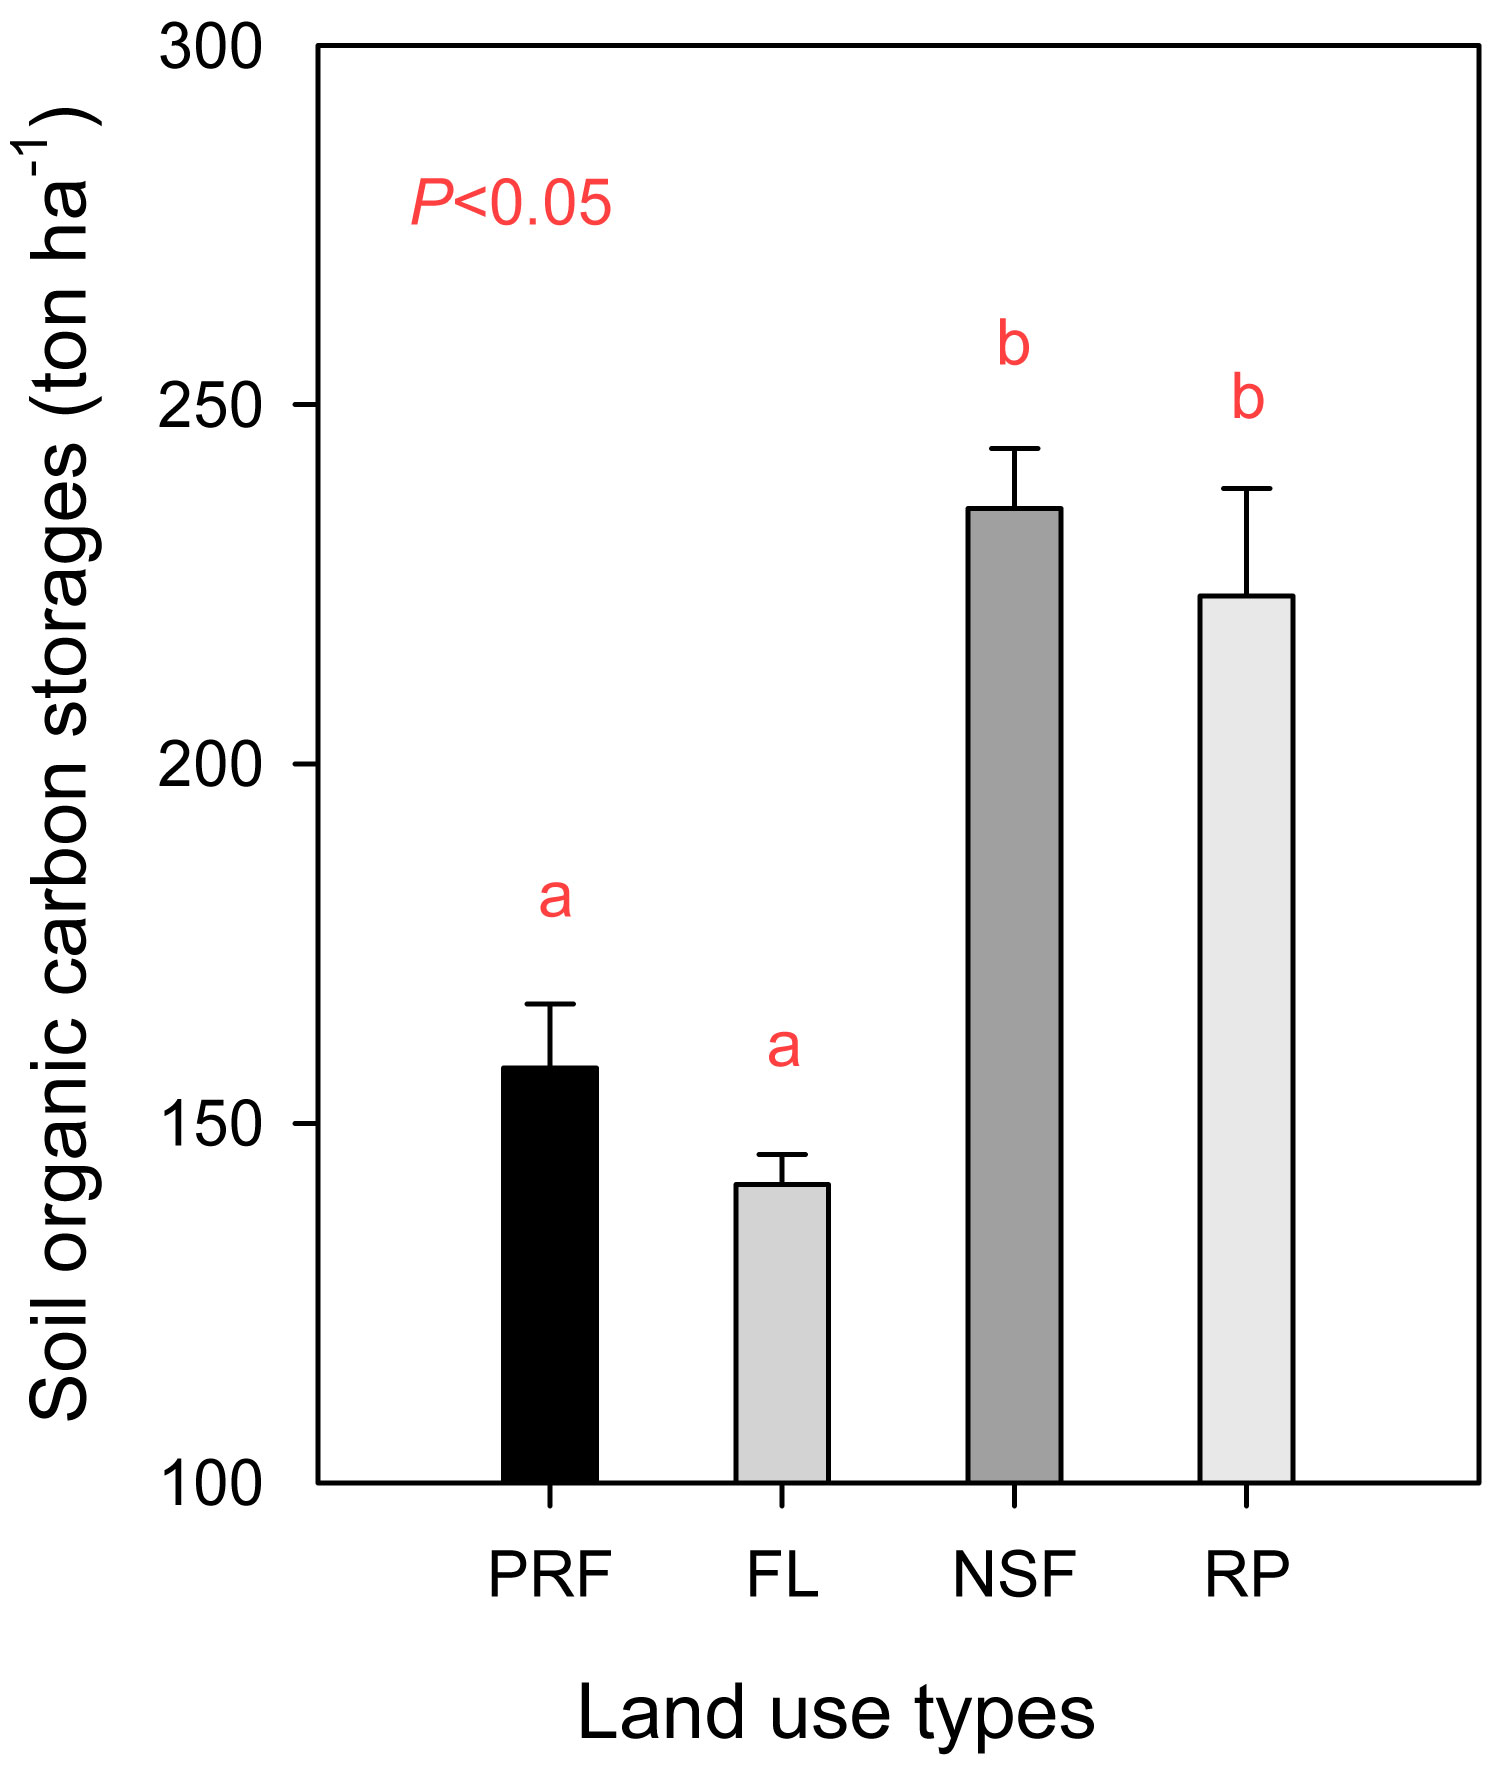
The soil organic carbon storage data for different land uses are displayed in Fig. 2. We omitted the correction factor (K) from the storage calculation. Using our modified calculation method, the soil organic carbon storage densities were 157.8 ± 8.9, 141.5 ± 4.1, 235.5 ± 8.4 and 223.4 ± 15.0 ton ha-1 for primary rain forest, fallow land, natural secondary forest and rubber plantations, respectively (Fig. 3). When the land use type was transformed from primary rain forest to fallow land, the soil organic carbon storage decreased by approximately 10.3%, but this decrease was not significant (P=0.172). The soil organic carbon storage increased significantly by approximately 49.3% with the conversion to natural secondary forest (P=0.003) and by 41.6% with the conversion to rubber plantation (P=0.020 - Fig. 3).
Fig. 3 - Soil organic carbon storage for four land uses in Xishuangbanna, primary rain forest (PRF) was calculated using the eqn. 8 for it was the reference land use type, the other land use types, fallow land (FL), natural secondary forest (NSF) and rubber plantation (RP) were calculated using the eqn. 9.
Comparison of the two calculation methods
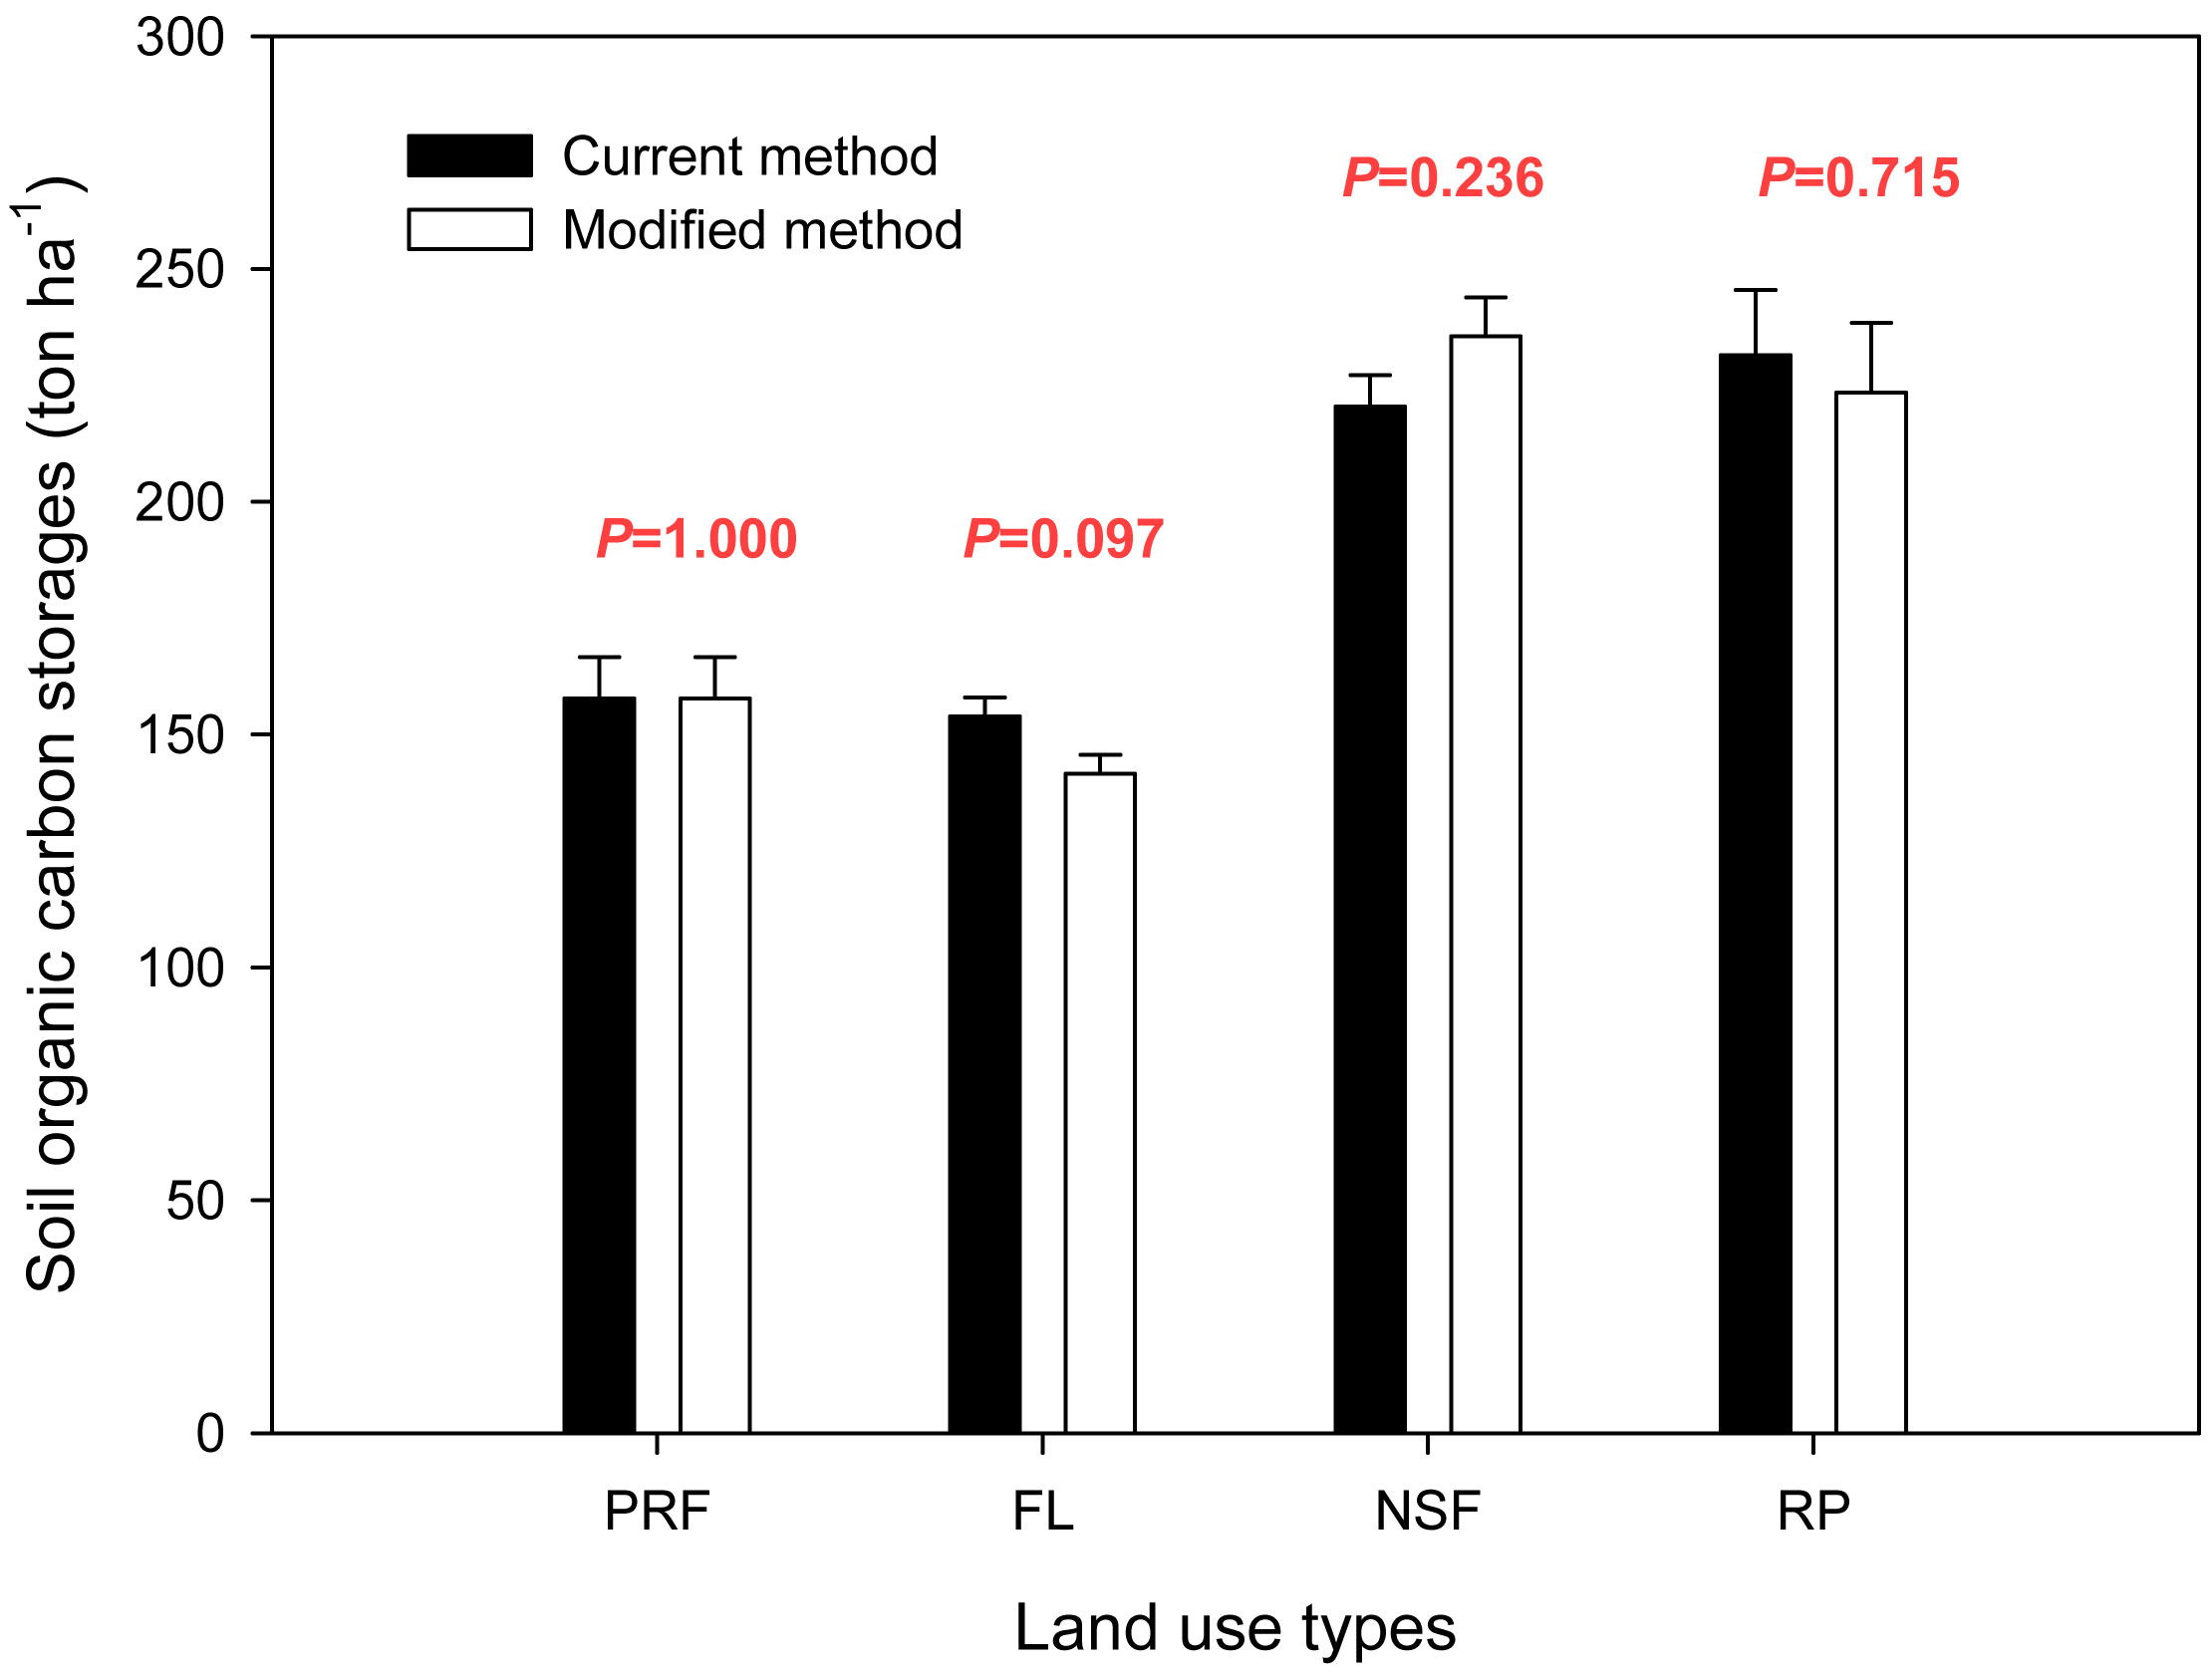
The soil standard reference depth (DSR) that was used in the carbon storage calculation is provided in Fig. 4, and the soil organic carbon storage values from the two calculation methods are compared in Fig. 5. Values for the primary rain forest were same for the two methods as the primary rain forest was the reference land use type, and the reference depth (Dr) was the same as the standard reference depth (Dr = DSR = 100 cm). The results for the other land uses varied between the calculation methods. For fallow land, the value was 153.9 ± 4.0 ton ha-1 using the reference depth (Dr = 100 cm) from the current method and 141.5 ± 4.1 ton ha-1 using the modified method with the standardized reference depth (DSR = 87.8 cm). The current method overestimated the carbon storage by 12.4 ton ha-1, which was 8.8% more than the actual storage. For rubber plantations, the storage value was 231.4 ± 14.1 ton ha-1 with the reference depth (Dr = 100 cm) from the current method and 223.4 ± 15.0 ton ha-1 with the standardized reference depth (DSR = 95.1 cm) from the modified method. The soil organic carbon storage was overestimated by 8.1 ton ha-1 (3.6%). The natural secondary forest was different. The current method underestimated the carbon storage by 15.1 ton ha-1, which was 6.4% less than the actual storage (220.4 ± 6.8 ton ha-1 at Dr = 100 cm vs. 235.5 ± 8.4 ton ha-1 at DSR = 109.7 cm). Although the standard reference depth using the modified method was significantly different from the reference depth using the current method under the same land use type (P=0.005 in FL, P=0.002 in NSF, P=0.009 in RP - Fig. 4), there were no significant differences in the soil carbon storage between the two calculation methods for the same land use type (P=1.000 in PRF, P=0.097 in FL, P=0.236 in NSF, P=0.715 in RP - Fig. 5).
Fig. 4 - Comparison of soil standard reference depth (DSR) values obtained with the two calculation methods considered (black bars: current depth method; gray bars: modified depth method). (P): probability from the t-test for the equality of means within the same land use type.
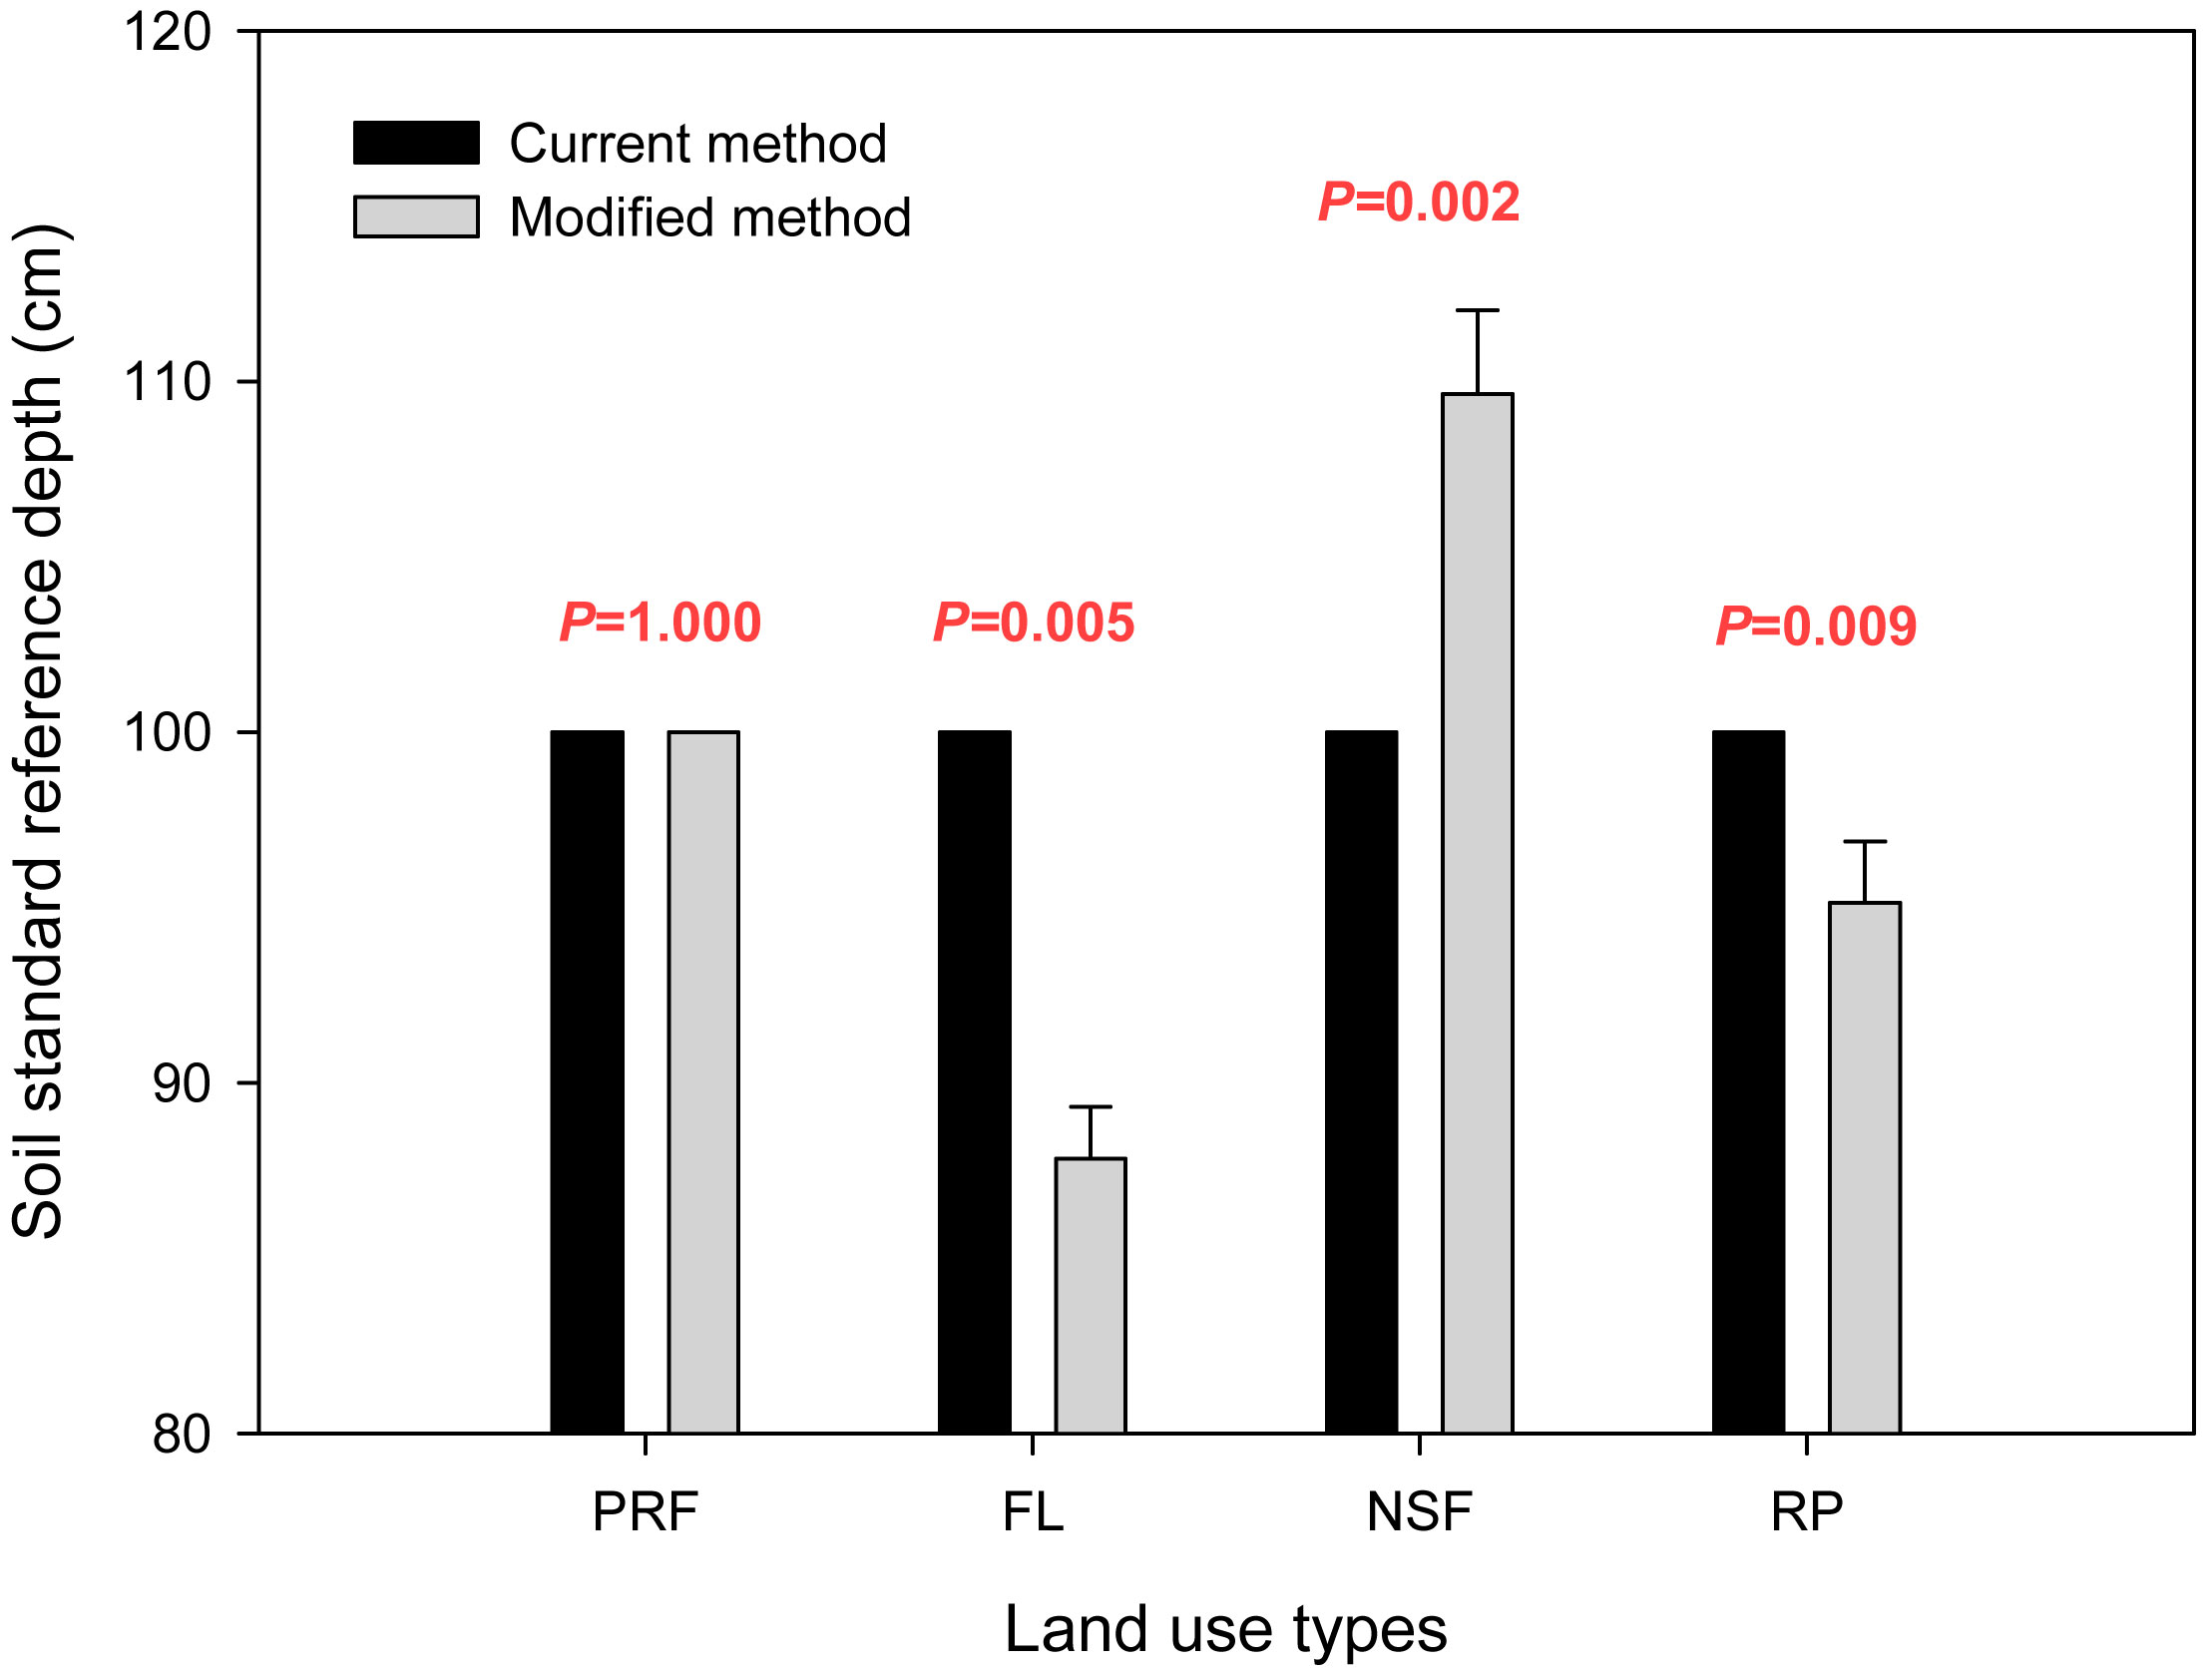
Fig. 5 - Comparison of the soil organic carbon storage values obtained with the two calculation methods considered (black bars: current SOC method; gray bars: modified SOC method). (P): probability from the t-test for the equality of means within the same land use type.
Discussion
Influence of land use changes
Long-term experimental studies have confirmed that soil organic carbon is highly sensitive to land use change from native ecosystems, such as forest or grassland, to agricultural systems, resulting in the loss of organic carbon ([30]). There was a 20-50% loss of top soil original carbon in the tropics and sub-tropics due to forest clearing and conversion to agricultural land ([37]). Soil organic carbon storage decreased by 30-50% due to land use changes from natural to agricultural ecosystems in the Midwestern USA ([17]).
Deforestation and subsequent agricultural land abandonment in tropical and subtropical areas can result in a loss of soil carbon ([47]). Tropical soils are believed to be more vulnerable to improper land management practices than soils in the temperate zone ([45]). In our study, there was no significant difference in soil carbon storage between primary rain forest and fallow land sites, although a decrease was observed (157.8 ± 8.9 and 141.5 ± 4.1 ton ha-1, P=0.172 - Fig. 5 and Tab. 4). Some authors have suggested that no significant loss in organic carbon due to land fallowing may occur because of the continuous production of grass vegetation that increases the soil organic matter through its fine roots ([5], [31]). The Dai’s traditional slash and burn cultivation may be another important factor for soil organic carbon input through the burning of wood and litter fall during land clearing.
Tab. 4 - Results of the independent samples t-tests applied for the equality of soil organic carbon storage means obtained with the two calculation methods for the different land uses considered.
| Calculation method | Land uses (I) |
Land uses (J) |
Levene’s Test for Equality of Variances |
t-test for Equality of Means |
|||
|---|---|---|---|---|---|---|---|
| F | Prob | t | df | Prob (2-tailed) |
|||
| Current method |
PRF | FL | 1.259 | 0.325 | 0.393 | 4 | 0.714 |
| NSF | 0.103 | 0.764 | -5.612 | 4 | 0.005 | ||
| RP | 1.205 | 0.334 | -4.429 | 4 | 0.011 | ||
| FL | NSF | 1.73 | 0.259 | -8.415 | 4 | 0.001 | |
| RP | 5.611 | 0.077 | -5.291 | 4 | 0.006 | ||
| NSF | RP | 2.614 | 0.181 | -0.705 | 4 | 0.52 | |
| Modified method |
PRF | FL | 1.172 | 0.34 | 1.659 | 4 | 0.172 |
| NSF | 0 | 0.985 | -6.363 | 4 | 0.003 | ||
| RP | 1.771 | 0.254 | -3.767 | 4 | 0.02 | ||
| FL | NSF | 1.97 | 0.233 | -10.035 | 4 | 0.001 | |
| RP | 7.293 | 0.054 | -5.262 | 4 | 0.006 | ||
| NSF | RP | 2.12 | 0.219 | 0.706 | 4 | 0.519 | |
An increasing number of field studies have demonstrated that soil carbon concentrations at tree plantations are significantly lower than those of natural forests ([22], [13], [29], [8], [18], [36]). Rubber farming has caused declining soil pH and organic matter content in Ferralsols ([43]). Soil organic carbon on rubber plantations was only 60% of that in old-growth forests after 40 years in Ghana ([9]). In a 20 years old rubber plantation in Xishuangbanna (China), carbon in the top 10 cm of soil decreased from 30 g kg-1 in the native forest to 23 g kg-1 ([46]). In our study, however, the monoculture rubber plantation was similar to the natural secondary forest in its carbon storage, with the standardized soil reference depth of 1 m (223.4 ± 15.0 and 235.5 ± 8.4 ton ha-1, P=0.519 - Fig. 5 and Tab. 4) over the same time period (30 years). Our results are similar to those of Marín-Spiotta & Sharma ([26]). In Xishuangbanna, the soil carbon storage at rubber plantations was 57.8% higher than that of fallow land (P=0.006), and 66.4% higher in the natural secondary forest (P=0.001 - Fig. 5 and Tab. 4). This finding indicates that, in addition to natural reforestation, rubber plantations are another option that favors soil carbon sequestration when transforming fallow lands within the scope of the appropriate average air temperature and altitude (>20 °C, <750 m) under “the Grain for Green Project of China” in the tropical mountainous regions of southwest China. With increasing altitude of more than 750 m above the sea level, not only does the latex production of the rubber tree decline greatly, but its soil carbon sequestration ability also fell sharply ([6]).
The increase in soil carbon storage for rubber plantations and natural secondary forest, compared to primary rain forest (41.6%, and 49.3% higher, P=0.020, P=0.001, respectively - Fig. 5 and Tab. 4), was inconsistent with other reports from tropical regions ([26]). Our results for soil carbon sequestration at rubber plantations are similar to those for natural secondary forest. The soil at rubber plantations acts as a carbon sink in this region. This inconsistency may have stemmed from the influence of the land use change history and management in different study regions ([22]). For example, tree plantations in other regions may tend to be established on lands where soil C and nutrient stocks have already been depleted through agricultural or other human activities ([25]), but there is a continuous and elaborated trend in rubber plantations for harvesting more latex in Xishuangbanna (Tab. 1). The selection of tree species may be another important factor ([26]). Laganière et al. ([16]) noted that the similarities and differences between tree plantations, natural secondary forests and reference primary forests had a certain relationship with the climate of the study region. The rubber tree is a species with centralized defoliation that produces a large amount of litterfall, and the decomposition rate of the litterfall is low under the relatively dry and hot northern tropical climate.
Although soil at rubber plantations acts as a carbon sink in Xishuangbanna, we still can not determine whether the rubber plantation ecosystem is a carbon source or carbon sink; for this, we need to combine the characteristics of aboveground biomass and litter-fall to comprehensively evaluate its status in future studies.
Difference between the two calculation methods
Tab. 4 lists the multiple comparisons of soil organic carbon storage using the two calculation methods for the four land use types. An “independent samples t-test” was adopted to compare the means of the standard reference depths and soil organic carbon storage for different land use types with two different calculation methods.
There was no statistically significant difference between the two calculation methods for soil organic carbon storage in the northern tropical ecosystem of southwest China. For the same land use type, such as fallow land, the depths that were used in the calculation formula were significantly different between the two methods (100 cm in current method and 87.83 cm in modified method, P=0.005 - Fig. 4), but there was no significant difference in the soil organic carbon storage between the two methods (153.9 ton ha-1 using the current method vs. 141.5 ton ha-1 with the modified method, P=0.097 - Fig. 5).
When we compared the soil organic carbon storage determined using the two calculation methods for the different land use types, the values of significance in the t-test were also greater than 0.05. Similar to the comparison of the calculation results for primary rain forest and fallow land, there was no significant difference between primary rain forest and fallow land in the current or modified methods, but the t-test values were different (0.714 using the current method vs. 0.172 with the modified method - Tab. 4). The relationship between the primary rain forest and rubber plantations was also similar: there was a significant difference between them (P<0.05) using the current and modified calculation methods, but the t-test values were 0.011 for the current method and 0.020 for the modified method (Tab. 4).
Although the number of replicates was somewhat low and there was no statistically significant difference between the two calculation methods for soil organic carbon storage based on just three profiles for each study site in Xishuangbanna, we concluded that our method for standardizing the reference depth can improve the calculation accuracy by approximately 4-9%. This value is a low error rate for a region but a high rate for a large area, such as a country or on a global scale. Thus, the standardization of the reference depth should be an indispensable process for country or global soil carbon storage evaluations and comparisons, even during the periodic Kyoto carbon trading quota allocations and goal setting for reducing CO2 emissions levels. With the reference depth standardization process, we can further model the standard soil profiles for different regions by collecting soil profile data from areas with primary vegetation (with no human disturbance) and estimate soil organic carbon or other nutrient storage changes due to land use change from primary vegetation either in a specific region or at a global level.
Conclusions
To improve the accuracy of soil organic carbon storage calculations and their comparability for land use changes, we added a new concept (standardized reference depth, DSR) in order to modify the current calculation method. We discovered that the DSR can effectively reduce the calculation error rate by approximately 6.3% from the current method for evaluating the influence of land use change on soil organic carbon storage in a northern tropical ecosystem in south-western China. The modified process uses the standardization of the reference depth, and is necessary in country or global soil carbon storage evolutions and comparisons. We also obtained the unexpected result that rubber plantations have similar soil carbon sequestration abilities to natural secondary forests in Xishuangbanna. Soils at rubber plantations in this region act as a carbon sink.
Acknowledgements
This study was supported by the projects of the Natural Science Foundation of China (NSFC41201298), the Strategic Priority Research Program of the Chinese Academy of Sciences (XDA05070303), and the Opening Project Fund of Key Laboratory of Rubber Biology and Genetic Resource Utilization, Ministry of Agriculture of China (RRI-KLOF1407). We thank the staff members of Xishuangbanna Station for Tropical Rainforest Ecosystem Studies for their assistance in the field work and Biogeochemistry Lab of Xishuangbanna Tropical Botanical Garden, Chinese Academy of Sciences for soil analysis. We are also grateful to Dr. Chao Shang, Crop and Soil Environmental Science Department, Virginia Polytechnic Institute and State University and to Dr. Charles H. Cannon, Department of Biological Sciences, Texas Tech University, for their valuable comments and editing the English language on the manuscript.
References
Gscholar
Gscholar
Gscholar
Online | Gscholar
CrossRef | Gscholar
Gscholar
Authors’ Info
Authors’ Affiliation
Yun Deng
Hui Chen
Liqing Sha
Min Cao
Xiaobao Deng
Key Laboratory of Tropical Forest Ecology, Xishuangbanna Tropical Botanical Garden, Chinese Academy of Sciences, Yunnan 666303 (China)
Kunming Institute of Zoology, Chinese Academy of Sciences, Yunnan 650223 (China)
Institute of Mountain Hazards and Environment, Chinese Academy of Sciences,, Sichuan 610041 (China)
Key Laboratory of Rubber Biology and Genetic Resource Utilization, Ministry of Agriculture, Hainan 571731 (China)
Corresponding author
Paper Info
Citation
Li Y, Xia Y, Lei Y, Deng Y, Chen H, Sha L, Cao M, Deng X (2015). Estimating changes in soil organic carbon storage due to land use changes using a modified calculation method. iForest 8: 45-52. - doi: 10.3832/ifor1151-007
Academic Editor
Gianfranco Minotta
Paper history
Received: Oct 14, 2013
Accepted: Apr 23, 2014
First online: Jun 17, 2014
Publication Date: Feb 02, 2015
Publication Time: 1.83 months
Copyright Information
© SISEF - The Italian Society of Silviculture and Forest Ecology 2015
Open Access
This article is distributed under the terms of the Creative Commons Attribution-Non Commercial 4.0 International (https://creativecommons.org/licenses/by-nc/4.0/), which permits unrestricted use, distribution, and reproduction in any medium, provided you give appropriate credit to the original author(s) and the source, provide a link to the Creative Commons license, and indicate if changes were made.

Web Metrics
Breakdown by View Type
Article Usage
Total Article Views: 63216
(from publication date up to now)
Breakdown by View Type
HTML Page Views: 50436
Abstract Page Views: 5581
PDF Downloads: 5542
Citation/Reference Downloads: 41
XML Downloads: 1616
Web Metrics
Days since publication: 4420
Overall contacts: 63216
Avg. contacts per week: 100.12
Article Citations
Article citations are based on data periodically collected from the Clarivate Web of Science web site
(last update: Mar 2025)
Total number of cites (since 2015): 17
Average cites per year: 1.55
Publication Metrics
by Dimensions ©
Articles citing this article
List of the papers citing this article based on CrossRef Cited-by.
Related Contents
iForest Similar Articles
Research Articles
Carbon storage and soil property changes following afforestation in mountain ecosystems of the Western Rhodopes, Bulgaria
vol. 9, pp. 626-634 (online: 06 May 2016)
Research Articles
Effects of tree species, stand age and land-use change on soil carbon and nitrogen stock rates in northwestern Turkey
vol. 9, pp. 165-170 (online: 18 June 2015)
Research Articles
Impact of deforestation on the soil physical and chemical attributes, and humic fraction of organic matter in dry environments in Brazil
vol. 15, pp. 465-475 (online: 18 November 2022)
Research Articles
Soil stoichiometry modulates effects of shrub encroachment on soil carbon concentration and stock in a subalpine grassland
vol. 13, pp. 65-72 (online: 07 February 2020)
Research Articles
Do the rubber plantations in tropical China act as large carbon sinks?
vol. 7, pp. 42-47 (online: 21 October 2013)
Research Articles
Potential relationships of selected abiotic variables, chemical elements and stand characteristics with soil organic carbon in spruce and beech stands
vol. 14, pp. 320-328 (online: 09 July 2021)
Research Articles
Analysis of canopy temperature depression between tropical rainforest and rubber plantation in Southwest China
vol. 12, pp. 518-526 (online: 09 December 2019)
Research Articles
The effect of clear-cut age on soil organic carbon and nitrogen indices in Scots pine (Pinus sylvestris L.) stands
vol. 18, pp. 146-153 (online: 09 June 2025)
Research Articles
Carbon storage in degraded cork oak (Quercus suber) forests on flat lowlands in Morocco
vol. 9, pp. 125-137 (online: 08 August 2015)
Research Articles
Controlling soil total nitrogen factors across shrublands in the Three Rivers Source Region of the Tibetan Plateau
vol. 13, pp. 559-565 (online: 29 November 2020)
iForest Database Search
Search By Author
Search By Keyword
Google Scholar Search
Citing Articles
Search By Author
Search By Keywords
PubMed Search
Search By Author
Search By Keyword


