Nutrient accumulation and export in teak (Tectona grandis L.f.) plantations of Central America
iForest - Biogeosciences and Forestry, Volume 8, Issue 1, Pages 33-44 (2015)
doi: https://doi.org/10.3832/ifor1089-007
Published: Jun 04, 2014 - Copyright © 2015 SISEF
Research Articles
Abstract
In order to assess the nutrient sustainability of teak plantations, a study was conducted to measure the amount of nutrients accumulated by the trees and exported during wood harvest. Three teak plantations (28 stands of different age) were studied in Costa Rica and Panama to assess those questions. Nutrient and biomass accumulation and allocation in different tree components (bole, bark, branches and foliage) were measured in the best performing trees between 1 and 19 years of age. A stand of 150 teak trees ha-1 at age 19 would accumulate (kg ha-1) 405 N, 661 Ca, 182 K, 111 Mg, 33 P, 53 S, 9 Fe, 0.47 Mn, 0.22 Cu, 0.92 Zn, 1 B; whereas the expected nutrient export by timber harvest (bole and bark) is (kg ha-1) 220 N, 281 Ca, 88 K, 63 Mg, 23 P, 39 S, 6 Fe, 0.13 Mn, 0.10 Cu, 0.21 Zn, 0.40 B. Hence, teak nutrition should pay special attention to N and K, together with Ca the nutrients most accumulated by teak. In addition, P and B could also be limiting planted teak forest productivity due to their general soil deficiencies. Proposed models estimate the amount of nutrients removed from the site during timber harvests, information that can be used by plantation managers to avoid soil nutrient depletion, approaching sustainability in forest plantation management.
Keywords
Forest Nutrition, Planted Forests, Costa Rica, Panama, Sustainability, Forest Soils
Introduction
Due to growing needs for timber and wood products, forest plantations have increased around the world and have gained economical relevance. At the same time there has been an increase in concerns regarding the sustainability of planted forests, especially those managed under a regime of short rotations ([30]). In particular, the relationship between forest nutrition and sustainable timber production has become an important issue for the management of less studied species in countries such as Costa Rica and China ([26], [4], [38]).
Teak (Tectona grandis L.f.) plantations have been widely established in Central America, initially in Costa Rica and Panama ([9]) and more recently in Guatemala, El Salvador and Nicaragua. Teak has become an important species in the worldwide quality tropical hardwood sector ([34]), with a total planted area of 4.3 ·106 ha (not including natural areas), of which 132 780 ha are in Central America (3%) and 86 500 in Panama and Costa Rica ([21]). In contrast to the rotations of 40-80 years used in Asia and Africa, in Central America the species is intensively managed in rotations of 20-25 years, usually in carefully selected productive sites, with an expected commercial industrial volume of 10 m3 ha-1 year-1 ([34], [9]). In this kind of short-rotation, intensively-managed forest plantations, nutrient management is a key issue for attaining sustainability and maintaining yields for future rotations ([37], [11]). Appropriate knowledge regarding teak nutrition is required to improve plantation management and to attain high productivity and sustainability.
Nutrient accumulation increases with the stand’s age, mainly due to biomass accumulation; however, nutrient uptake during early years is considered crucial to sustain the high growth rates and the rapid expansion of both crown and roots required to maintain an appropriate nutritional status throughout the entire rotation length ([27], [24]). In general, foliage is the tree tissue with the highest nutrient concentration and it is considered to contain 20-40% of total stand nutrients, while tree stems are assumed to have relatively low concentrations of nutrients ([28], [29]). However, the high amount of biomass accumulated in the tree stem makes it an important sink of nutrients. As a consequence, the loss of nutrients through wood removal at harvesting is a major cause of impoverishment of forest sites ([14], [46]). While N, P and Mg are mainly accumulated in the tree stem, bark and roots are considered to be Ca sinks ([32]). Nutrient uptake depends mainly on the species’ demand and its ability to access nutrients, as well as the potential of the site (especially the soil) to supply nutrients. In calcareous soils in India, the most absorbed nutrients by teak were Ca > K > N > Mg > P = S ([31]), while they were K > N > Ca >> Mg ≥ P in less fertile soils in Africa ([32]) and N > Ca > K > Mg > P > Na > S > Cl in a different study site in India ([23]).
In order to understand the relationship between soil and forest nutrition, it has been long recognized that it is first necessary to evaluate the quantities of nutrients taken up by the growing forest and removed from the site during timber extraction ([40]). However, Fölster & Khanna ([14]) pointed out a traditional and general lack of concern of this problem in planted forests. Soil-plant relation research in agriculture has traditionally analyzed when, where, and at what rates nutrients are accumulated by plants in order to accomplish an efficient and environmentally acceptable nutrient management ([42], [6]). Such kind of study on nutrient absorption curves or nutrient accumulation dynamics with age are traditionally used in agriculture and are considered as promising tools to analyze forest nutrition in intensively managed planted forests in the tropics ([39], [2]). In order to provide information for the near-maximum accumulation rates of any given crop, nutrient absorption studies are carried out in sites where near-maximum yield of the crop is achieved ([42], [6]). By analyzing nutrient accumulation in the most productive soils without nutrient deficiencies (and in dominant or co-dominant trees in a site), the maximum species requirements are assessed. Therefore, if the minimum inputs calculated for these high-fertility sites are applied in sites of lower fertility where tree nutrient uptake would be lower, the sustainability of the plantation is still achieved ([6], [2]).
Nutrient accumulation dynamics of a species can be used to estimate: (i) the nutrient removal by thinning or harvesting; (ii) the maximum nutrient absorption of the species over one rotation period; (iii) the amount of nutrients left at a site after harvesting, which will recycle and be reused during the next rotation; and (iv) the minimum nutrient inputs (fertilizers) the system requires to be sustainably managed ([39], [6], [2]).
To assess the nutrient sustainability of teak plantations, we conducted a study to measure the amount of nutrients accumulated by trees and exported during wood harvest, by analyzing the nutrient accumulation dynamics at different ages and the allocation patterns in highly productive teak plantations in Central America (Costa Rica and Panama) throughout a rotation period.
Material and methods
Study sites
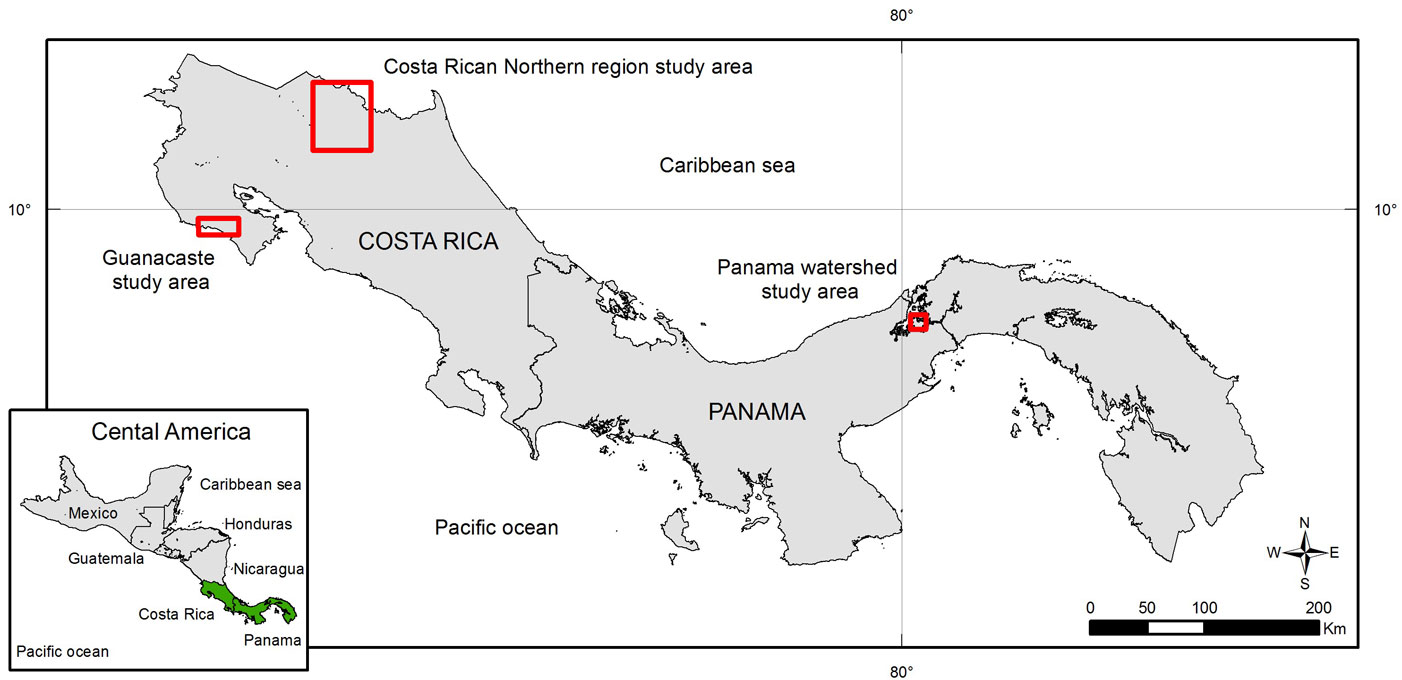
Three teak (Tectona grandis L.f.) plantations were studied in Central America: two in Costa Rica (Guanacaste and northern region) and one in Panama (Panama Canal watershed - Fig. 1). The three areas are classified as tropical wet forest according to Holdridge’s life zones ([17]), with similar mean annual rainfall (2500-3100 mm), although in Guanacaste the dry season lasts longer than at the other two sites. The soils in the study areas are also similar, although the northern region of Costa Rica is less fertile and has higher soil acidity than the other sites (Tab. 1).
Fig. 1 - Locations of the study teak (Tectona grandis L.f.) plantations: Guanacaste (Costa Rica); northern region (Costa Rica) and Panama Canal Watershed (Panama).
Tab. 1 - Summary of topsoil (0-20 cm) properties at the different study sites. Means and coefficients of variation (in parentheses) are reported. Soil information was only available for 23 of the 28 sampled stands. (ECEC): effective cation exchange capacity. (AS): acidity saturation; (*): values outside the adequate reference soil levels ([6]).
| Property | Northern region, Costa Rica (n=11) |
Guanacaste, Costa Rica (n=9) |
Canal Zone, Panama (n=3) |
Total (n=23) |
||||
|---|---|---|---|---|---|---|---|---|
| pH | 5.11 | (6) | 5.9 | (6) | 6.7 | (12) | 5.63 | (12) |
| Acidity (cmol(+) L-1) | 0.7* | (5) | 0.31 | (30) | 0.15 | (33) | 0.48 | (81) |
| Ca (cmol(+) L-1) | 4.45 | (44) | 21.36 | (28) | 20.97 | (38) | 13.22 | (74) |
| Mg (cmol(+) L-1) | 1.46 | (47) | 6.89 | (54) | 5.25 | (64) | 4.08 | (89) |
| K (cmol(+) L-1) | 0.13* | (109) | 0.33 | (87) | 0.36 | (82) | 0.24 | (101) |
| ECEC (cmol(+) L-1) | 6.74 | (31) | 28.9 | (32) | 26.72 | (40) | 18.02 | (71) |
| AS (%) | 11.96* | (84) | 1.22 | (58) | 0.65 | (55) | 6.28* | (139) |
| P (mg L-1) | 3* | (114) | 3* | (146) | 2* | (0) | 3* | (124) |
| Zn (mg L-1) | 2* | (84) | 3 | (58) | 3 | (107) | 2* | (77) |
| Cu (mg L-1) | 8 | (19) | 11 | (85) | 4 | (83) | 9 | (71) |
| Fe (mg L-1) | 165 | (23) | 37 | (81) | 65 | (154) | 102 | (75) |
| Mn (mg L-1) | 43 | (171) | 38 | (82) | 19 | (101) | 38 | (142) |
| Organic matter (%) | 4.6 | (27) | 3.8 | (28) | 4.6 | (16) | 4.3 | (27) |
| Sand (%) | 24.9 | (23) | 23.4 | (56) | 29 | (31) | 24.8 | (38) |
| Silt (%) | 18.4 | (13) | 36.9 | (42) | 36.8 | (43) | 28 | (51) |
| Clay (%) | 56.7 | (11) | 39.7 | (22) | 34.3 | (50) | 47.1 | (27) |
The stands studied were chosen to be representative of properly managed teak plantations in Central America. In general, their management consists on continuous silvicultural activities: weed control, pruning, thinning regimen (approximately from 800-1000 trees ha-1 at establishment to 150-200 trees ha-1 at final felling) and fertilization during the establishment. The use of clones is common in recent years. An expected commercial volume of 100-150 m3 ha-1 is expected for this kind of plantation after approximately 20 years rotation.
Field sampling and design
A false time-series (chronosequences) method was used to analyze nutrient accumulation dynamics of teak trees from age 1 to 19 years. Johnson & Miyanishi ([19]) define such method as an inference of a time sequence of development made from a series of plots or stands differing in age. Despite of the critiques to this method ([19]), it is considered a valid methodology as far as all studied stands grow under similar environmental conditions (soil and climate) and are subject to similar management practices. Hence, stands of different ages (between 1 and 19 years old) were studied, assuming that they represent the average time-pattern of the plantations analyzed.
A total of 28 stands were analyzed, seven in Panama, 12 in the northern region of Costa Rica and nine in Guanacaste (Costa Rica). In order to set up a maximum yield research experiment ([42], [6], [2]), dominant and codominant trees were selected: (a) with no visible symptoms of diseases or nutritional deficiencies; and (b) that were representative of the best-performing trees of the plantations, assuming optimal nutrition and a full expression of genetic potential. In stands of age < 10 years, two trees were sampled per stand, whereas only one tree was sampled in older stands. Trees were felled and biomass accumulated at different tree components (bole, bole’s bark, foliage and primary and secondary branches) was weighed in the field. A random subsample (1kg per component per tree) was then collected taking care of its representativeness of the whole sample of each component and tree (for more details see [12]). Dry biomass (hereafter biomass) was then calculated based on field measurements and sample water content estimated in laboratory. All the fieldwork was performed during July- September, at the tree’s optimal nutritional status during the period of maximum growth activity, to avoid effects of seasonality.
Tissues samples were analyzed at the Centro de Investigaciones Agronómicas of the University of Costa Rica (hereafter CIA-UCR) to determine nutrient concentrations (N, P, Ca, Mg, K, S, Fe, Mn, Cu, Zn and B, hereafter referred to as nutrients) after samples were dried and water content was assessed. Dry combustion was used to measure the N concentration, and wet digestion and atomic spectrometry were used to extract and determine other nutrients ([6]). Tab. 2 summarizes nutrient concentration age dynamics (for more details see [12]).
Tab. 2 - Summary of nutrient concentration age dynamics in 1 to 19 years old teak (Tectona grandis L.f.) plantations in Costa Rica and Panama ([12]). Macronutrient concentration (N, Ca, K, Mg, P and S) is expressed in %, while micronutrient concentration (Fe, Mn, Cu, Zn and B) is expressed in mg kg-1. Nutrient estimations and confidence intervals (α=0.05) are reported. (*): When no correlation was found between tree age and nutrient concentration in the compartment considered, concentration value is given only for 10 years old trees.
| Nutrient | Bole | Bark | ||||
|---|---|---|---|---|---|---|
| 5 years | 10 years | 19 years | 5 years | 10 years | 19 years | |
| N | 0.33 (0.29-0.41) |
0.29 (0.25-0.36) |
0.24 (0.20-0.30) |
0.69 (0.62-0.79) |
0.61 (0.54-0.71) |
0.51 (0.45-0.61) |
| Ca | - | 0.11 (0.10-0.12)* |
- | - | 1.91 (1.44-2.38)* |
- |
| K | 0.25 (0.19-0.33) |
0.15 (0.09-0.23) |
0.03 (0.01-0.11) |
1.33 (1.08-1.60) |
1.04 (0.74-1.40) |
0.63 (0.32-1.09) |
| Mg | 0.09 (0.08-0.13) |
0.07 (0.06-0.10) |
0.05 (0.04-0.07) |
- | 0.23 (0.22-0.25)* |
- |
| P | - | 0.06 (0.03-0.10)* |
- | - | 0.08 (0.06-0.10)* |
- |
| S | - | 0.04 (0.03-0.06)* |
- | 0.07 (0.06-0.08) |
0.06 (0.05-0.07) |
0.05 (0.04-0.06) |
| Fe | - | 72.46 (27.37-117.56)* |
- | 268.81 (152.15-348.39) |
216.17 (0.01-325.69) |
27.88 (0.01-280.24) |
| Mn | - | 1.25 (0.64-1.86)* |
- | 26.73 (18.99-188.98) |
20.41 (14.51-144.34) |
15.43 (10.97-109.11) |
| Cu | - | 2.09 (1.56-2.62)* |
- | - | 3.46 (2.86-4.06)* |
- |
| Zn | - | 10.34 (1.68-18.99)* |
- | - | 29.85 (20.84-38.85)* |
- |
| B | - | 2.71 (2.17-3.26)* |
- | - | 30.66 (28.34-32.98)* |
- |
| Nutrient | Foliage | Branches | ||||
| 5 years | 10 years | 19 years | 5 years | 10 years | 19 years | |
| N | 2.13 (1.97-2.33) |
1.97 (1.83-2.15) |
1.76 (1.64-1.91) |
0.52 (0.45-0.65) |
0.45 (0.39-0.56) |
0.37 (0.32-0.46) |
| Ca | - | 1.34 (1.13-1.54)* |
- | - | 0.91 (0.81-1.02)* |
- |
| K | - | 0.88 (0.73-1.02)* |
- | - | 0.43 (0.34-0.52)* |
- |
| Mg | 0.26 (0.18-0.31) |
0.29 (0.22-0.34) |
0.34 (0.27-0.39) |
0.15 (0.13-0.17) |
0.12 (0.11-0.13) |
0.09 (0.08-0.10) |
| P | - | 0.16 (0.12-0.20)* |
- | - | 0.08 (0.03-0.12)* |
- |
| S | - | 0.12 (0.11-0.13)* |
- | - | 0.07 (0.05-0.08)* |
- |
| Fe | - | 129.61 (84.63-174.59)* |
- | - | 162.76 (145.68-179.83)* |
- |
| Mn | - | 42.55 (39.03-46.07)* |
- | - | 13.93 (11.50-16.37)* |
- |
| Cu | - | 11.08 (10.22-11.93)* |
- | 5.23 (4.41-6.80) |
3.56 (3.11-4.29) |
2.54 (2.25-2.97) |
| Zn | - | 32.00 (24.74-39.26)* |
- | 21.34 (15.22-29.93) |
15.44 (10.10-23.6) |
8.61 (4.82-15.38) |
| B | - | 19.62 (18.32-20.91)* |
- | - | 13.93 (11.50-16.37)* |
- |
Nutrient accumulation and allocation in tissues biomass were the target variables of this work, and were calculated by multiplying nutrient concentration (as reported in Tab. 2) by biomass ([12]). Primary and secondary branches were weighted averaged (reported henceforth as “branches” - eqn. 1):
where Ni-acc(br) is the nutrient accumulation in branches of the i-th nutrient, Bpbr and Bsbr are the biomass of primary and secondary branches, respectively, Ni[pbr] and Ni[sbr] are the concentration of the i-th nutrient in primary and secondary branches, respectively. Bole and bark nutrient accumulation were also weighted averaged (reported henceforth as “bole and bark” - eqn. 2):
where Ni-acc(bb) is the nutrient accumulation in bole and bark of the i-th nutrient, Bbl and Bbk are the biomass of bole and bark, respectively, Ni[bl] and Ni[bk] are the concentration of the i-th nutrient in the bole and in the bark, respectively. Similarly, “total” nutrient accumulation represents a weighted average from all the sampled tissues.
No detailed information about the thinning regime of the studied stands nor the dynamics of tree density with age were available. In order to upscale individual tree measurements to estimate stand’s values, tree stocking at different stands age were considered as 1000, 300 and 150 trees ha-1 at 1-5, 10 and 19 years, respectively. These values are considered as average values normally used in plantations in Central America. Although plant density may influence tree nutrient uptake because of competition for soil nutrients, we consider plant density for a given age as relatively homogeneous between the three study sites, as the three companies follow similar management patterns.
In order to estimate soil nutrient availability, topsoil samples were collected (0-20 cm), where more than half of the teak roots are situated ([45], [5]). Five soil sub-samples were taken from each site (without litter) and pooled into one composed soil sample for each site. Soil information was only available for 23 of the 28 sampled stands (Tab. 1). Soil samples were collected simultaneously to the biomass collection described above. Soil samples were analyzed at CIA-UCR to determine: pH, Ca, Mg, K, acidity and Al, P, Fe, Cu, Zn, Mn. pH was determined in water 10:25; acidity, Al, Ca and Mg in KCl solution 1M 1:10; P, K, Zn, Fe, Mn and Cu in modified Olsen solution pH 8.5 (NaHCO3 0.5 N, EDTA 0.01M, Superfloc 127) 1:10. Organic matter was determined by the combustion method described by Horneck & Miller ([18]). Soil texture was determined using the modified Bouyoucos method, as described by Forsythe ([13]).
Teak roots accounts for 5-30% of total tree nutrient accumulation ([33], [44], [5]) so total planted teak forests accumulation can be estimated as 105-130% of the above mentioned for the aboveground biomass. Belowground biomass was not taken into account in this study because it is left at the site after final harvesting, mineralized and used by the next rotation (recycled).
Statistical analysis
Generalized linear mixed models (henceforth: GLMMs) were used to study the relationships between nutrient (N, P, Ca, Mg, K, S, Fe, Mn, Cu, Zn and B) accumulation in each tissue (bole, bark, bole and bark, branches, foliage and total) and tree age. The use of GLMMs was necessary as most of the study variables did not follow the normal distribution assumed for traditional models. The probability distribution of each of the 72 response variables analyzed was studied prior to construct the GLMMs. The exponentially distributed variables were modeled using a Gamma distribution approach with α=1.
To evaluate the most suitable model for each study variable, a total of 83 different models were constructed, selecting the one with lowest deviance. Three groups of models were constructed: (1) a null model considering only an intercept [yi = b0]; (2) a model considering an intercept in addition to age as an explanatory variable [yiλ = age + b0]; and (3) a model without an intercept [yiλ = age]. For groups (2) and (3), 41 different power link functions [g(μ)=μλ] were tested for each one, with λ varying between λ=2 to λ=-2 and a λgap=0.1. When no model including age as a parameter was statistically significant, or when the data did not follow any of the studied distribution functions, the resulting model included only an intercept representing the mean of the variable, and no age effect was taken into account.
The sampled stands in each study area were spatially correlated. The spatial correlation was taken into account by including a random effect for the study area, modeling the working correlation matrix with a first-order autoregressive structure. The goodness-of-fit of the models was assessed by measuring the percentage difference between the deviance of the model and the deviance of a model with no covariates (hereafter referred to as efficiency: EF), which is a pseudo-R2 measure reported for GLMMs. All statistical analyses were performed using SAS 9.0 ([43]). All statistical tests throughout the text are considered significant with α=0.05.
Results
Aboveground biomass allocation
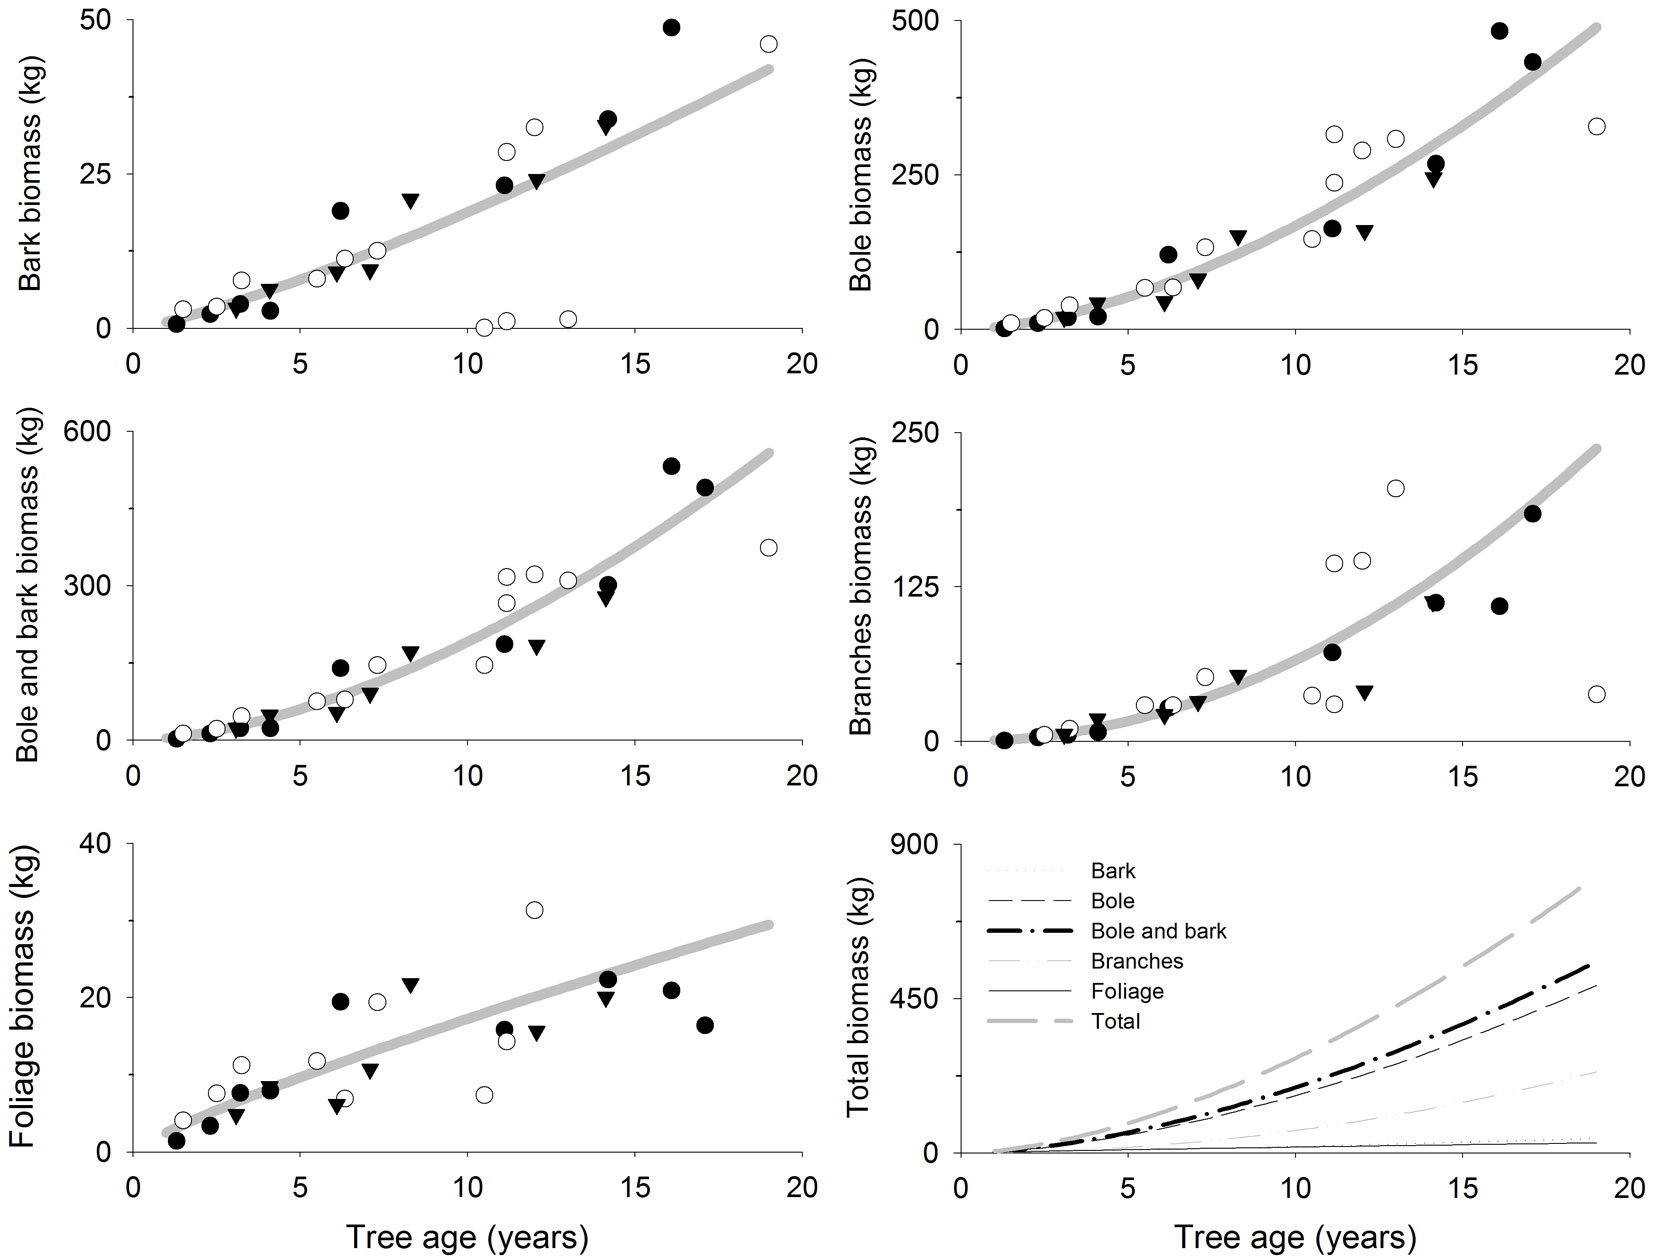
The fitted models showed an estimated total aboveground biomass of 87, 277 and 807 kg at 5, 10 and 19 years old, respectively (Tab. 3, Fig. 2). Bole was the tissue where most biomass accumulated, accounting for 60% of the total tree biomass at age 5, 10 and 19 (Tab. 3, Fig. 2). Branches also accounted for large amounts of biomass compared to total tree biomass but it increased with tree age: 19%, 24% and 30% at 5, 10 and 19 years, respectively (Tab. 3, Fig. 2). However, foliage and bark percentage of total tree biomass decreased with age though the net biomass increased (Tab. 3, Fig. 2): (i) bark biomass was 8, 19 and 42 kg tree-1 accounting for 9%, 7% and 5% of the total tree biomass at 5, 10 and 19 years, respectively; (ii) foliage biomass was 10, 17 and 29 kg tree-1 accounting for 11%, 6% and 4% of the total tree biomass at 5, 10 and 19 years, respectively.
Tab. 3 - Relationship between biomass accumulation (kg) and tree age (years) in 1 to 19 years old teak (Tectona grandis L.f.) plantations in Costa Rica and Panama. The models reported are in the form [y = (b1 · age)1/λ], where the response variable (y) is the biomass accumulation in the different tree compartments. EF (%): Model efficiency, pseudo R2 estimate for Generalized Linear Mixed Models (see text for more details). (*): Biomass estimates obtained by the models at different ages (confidence intervals are reported in parentheses, α=0.05).
| Tissues | Model | Biomass accumulation | ||||||||
|---|---|---|---|---|---|---|---|---|---|---|
| 5 years | 10 years | 19 years | ||||||||
b
1
|
b1 (SE) |
λ | EF (%) |
kg* | % of Total |
kg* | % of Total |
kg* | % of Total |
|
| Foliage | 30.515 | 0.2845 | 1.2 | 69 | 10 (8-11) |
11.1 | 17 (15-20) |
6.2 | 29 (25-34) |
3.7 |
| Bark | 10.461 | 0.0258 | 0.8 | 49 | 8 (7-8) |
9.1 | 19 (18-20) |
6.8 | 42 (39-45) |
5.2 |
| Bole | 21.629 | 0.1062 | 0.6 | 91 | 53 (45-62) |
60.7 | 168 (142-196) |
60.7 | 489 (413-570) |
60.7 |
| Bole and bark |
23.399 | 0.1032 | 0.6 | 91 | 60 (52-69) |
69.1 | 191 (165-220) |
69.1 | 558 (480-641) |
69.1 |
| Branches | 0.8106 | 0.0423 | 0.5 | 82 | 16 (13-20) |
18.8 | 66 (53-80) |
23.7 | 237 (191-288) |
29.4 |
| Total | 29.196 | 0.1275 | 0.6 | 91 | 87 (75-100) |
- | 277 (238-317) |
- | 807 (695-925) |
- |
Fig. 2 - Biomass accumulation (kg tree-1 or g tree-1) in different tree compartments related to tree age (years) in teak plantations (Tectona grandis L.f.). Points represent sampled trees at three different locations: Guanacaste, Costa Rica (black circles); Northern Region, Costa Rica (white circles); Panama (black triangles). Lines represent the fitted models reported in Tab. 3.
Nutrient accumulation and allocation
The fitted models (Tab. 4, Fig. 3 and Fig. 4) allow to estimate the nutrient accumulation at different tree tissues of teak trees based on their age. N mainly accumulated in foliage during the first years, although bole was the most important sink after 6-7 years. Indeed, bole N accumulation increased sharply with age, while foliage N accumulation increased slowly with age. Ca accumulated in branches following a trend close to that of bole and bark. Bark Ca accumulation was higher than in foliage or bole from 10 years old on, while foliage was higher before that. K accumulated in branches in trees older than 6-7 years, whereas in younger trees it mainly accumulated at tree bole. Bole K accumulation was very similar to that of bark and they were both slightly higher than in foliage. Mg accumulated in tree bole throughout the entire rotation, accumulation in branches was also high; bark and foliage Mg accumulation were similar and lower than in other tissues. P and S also accumulated at tree bole and branches while bark and foliage accumulation was low. Fe accumulated at tree bole and branches while foliage accumulation was lowest following a pattern similar to that of bark. Mn also accumulated in tree branches though foliage accumulation was high and even higher than in branches at trees younger than 8-9 years. Cu mainly accumulated in tree bole, while bark accumulation was lowest and foliage accumulation was higher at trees younger than 5 years old. Zn accumulated in tree bole and branches while bark and foliage accumulation was low. B mainly accumulated in tree branches, although bark accumulation was high compared to foliage accumulation, which was the lowest.
Tab. 4 - Results of the regression analysis between nutrient accumulation in the different tree compartments and tree age (years) in 1 to 19 years old teak (Tectona grandis L.f.) plantations in Costa Rica and Panama. The models reported are in the form [y = (b0 + b1 · age)1/λ], where the response variable (y) is the nutrient accumulation in the different tree tissues. When no model including age as a parameter was statistically significant, only an intercept (b0) representing the mean of the variable was included in the model. EF (%): Model efficiency, pseudo R2 estimate for Generalized Linear Mixed Models (see text for more details).
| Tissues | Macronutrient (kg) | Micronutrient (g) | ||||||||||
|---|---|---|---|---|---|---|---|---|---|---|---|---|
| Element |
b
0
|
b
1
|
b1 [Std. error] |
λ | EF (%) | Element |
b
0
|
b
1
|
b1 [Std. error] |
λ | EF (%) | |
| Foliage | N | - | 0.0218 | 0.0022 | 1.4 | 55 | Fe | - | 0.2088 | 0.0149 | 0.9 | 66 |
| Ca | - | 0.0205 | 0.0003 | 1.1 | 66 | Mn | - | 0.0522 | 0.0100 | 1.6 | 39 | |
| K | - | 0.0018 | 0.0002 | 2.0 | 41 | Cu | - | 0.0062 | 0.0011 | 1.4 | 47 | |
| Mg | - | 0.0049 | 0.0004 | 1.0 | 74 | Zn | - | 0.0452 | 0.0029 | 1.3 | 60 | |
| P | - | 0.0009 | 0.0001 | 1.3 | 63 | B | - | 0.0240 | 0.0040 | 1.3 | 60 | |
| S | - | 0.0006 | 0.0001 | 1.3 | 58 | - | - | - | - | - | - | |
| Bark | N | - | 0.0186 | 0.0002 | 0.8 | 43 | Fe | - | 0.4200 | 0.084 | 1.2 | 23 |
| Ca | - | 0.0545 | 0.0041 | 0.5 | 47 | Mn | - | 0.0352 | 0.0019 | 1.1 | 33 | |
| K | - | 0.0109 | 0.0011 | 1.2 | 35 | Cu | - | 0.0081 | 0.0010 | 0.7 | 39 | |
| Mg | - | 0.0054 | 0.0002 | 0.9 | 43 | Zn | - | 0.0564 | 0.0073 | 0.9 | 39 | |
| P | 0.0116 | - | - | - | - | B | - | 0.0632 | 0.0026 | 0.6 | 50 | |
| S | - | 0.0017 | 0.0001 | 0.9 | 43 | - | - | - | - | - | - | |
| Bole | N | - | 0.0574 | 0.0028 | 0.7 | 89 | Fe | - | 0.4318 | 0.0751 | 0.6 | 51 |
| Ca | - | 0.0354 | 0.0014 | 0.6 | 90 | Mn | 0.0960 | - | - | - | - | |
| K | - | 0.0079 | 0.0013 | 1.6 | 45 | Cu | - | 0.0434 | 0.0045 | 0.5 | 71 | |
| Mg | - | 0.0236 | 0.0012 | 0.7 | 82 | Zn | 0.9382 | - | - | - | - | |
| P | 0.1133 | - | - | - | - | B | - | 0.0526 | 0.0060 | 0.7 | 75 | |
| S | - | 0.0209 | 0.0038 | 0.6 | 67 | - | - | - | - | - | - | |
| Bole and bark |
N | - | 0.0688 | 0.0027 | 0.7 | 89 | Fe | - | 0.500 | 0.0575 | 0.6 | 60 |
| Ca | - | 0.0767 | 0.0018 | 0.6 | 82 | Mn | - | 0.0447 | 0.0009 | 1.1 | 45 | |
| K | - | 0.0265 | 0.0052 | 1.3 | 52 | Cu | - | 0.043 | 0.005 | 0.6 | 53 | |
| Mg | - | 0.0288 | 0.0016 | 0.7 | 84 | Zn | 13.757 | - | - | - | - | |
| P | 0.1249 | - | - | - | - | B | - | 0.0949 | 0.0062 | 0.6 | 77 | |
| S | - | 0.0234 | 0.0037 | 0.6 | 72 | - | - | - | - | - | - | |
| Branches | N | - | 0.0412 | 0.0023 | 0.7 | 71 | Fe | - | 0.3773 | 0.0108 | 0.6 | 63 |
| Ca | - | 0.0761 | 0.0052 | 0.5 | 83 | Mn | - | 0.0836 | 0.0083 | 0.6 | 62 | |
| K | - | 0.0401 | 0.0032 | 0.7 | 73 | Cu | - | 0.0274 | 0.0023 | 0.8 | 66 | |
| Mg | - | 0.0210 | 0.0012 | 0.6 | 80 | Zn | - | 0.0910 | 0.0104 | 0.7 | 58 | |
| P | 0.0391 | - | - | - | - | B | - | 0.0753 | 0.0044 | 0.6 | 80 | |
| S | - | 0.0142 | 0.0016 | 0.6 | 73 | - | - | - | - | - | - | |
| Total | N | - | 0.1165 | 0.0044 | 0.8 | 87 | Fe | - | 0.9331 | 0.0742 | 0.7 | 72 |
| Ca | - | 0.1281 | 0.0024 | 0.6 | 91 | Mn | - | 0.2045 | 0.0144 | 1.2 | 54 | |
| K | - | 0.0676 | 0.0091 | 1.3 | 93 | Cu | - | 0.0711 | 0.0085 | 0.8 | 68 | |
| Mg | - | 0.0425 | 0.0013 | 0.7 | 89 | Zn | - | 0.2692 | 0.0608 | 0.9 | 53 | |
| P | 0.02180 | - | - | - | - | B | - | 0.1657 | 0.0060 | 0.6 | 85 | |
| S | - | 0.0254 | 0.0033 | 0.7 | 82 | - | - | - | - | - | - | |
Fig. 3 - Tree foliage nutrient accumulation (kg tree-1 or g tree-1) as a function of tree age (years) in teak plantations (Tectona grandis L.f.). Points represent the sampled trees at three different locations: Guanacaste, Costa Rica (black circles); Northern Region, Costa Rica (white circles); Panama (black triangles). Lines represent the fitted models reported in Tab. 4.
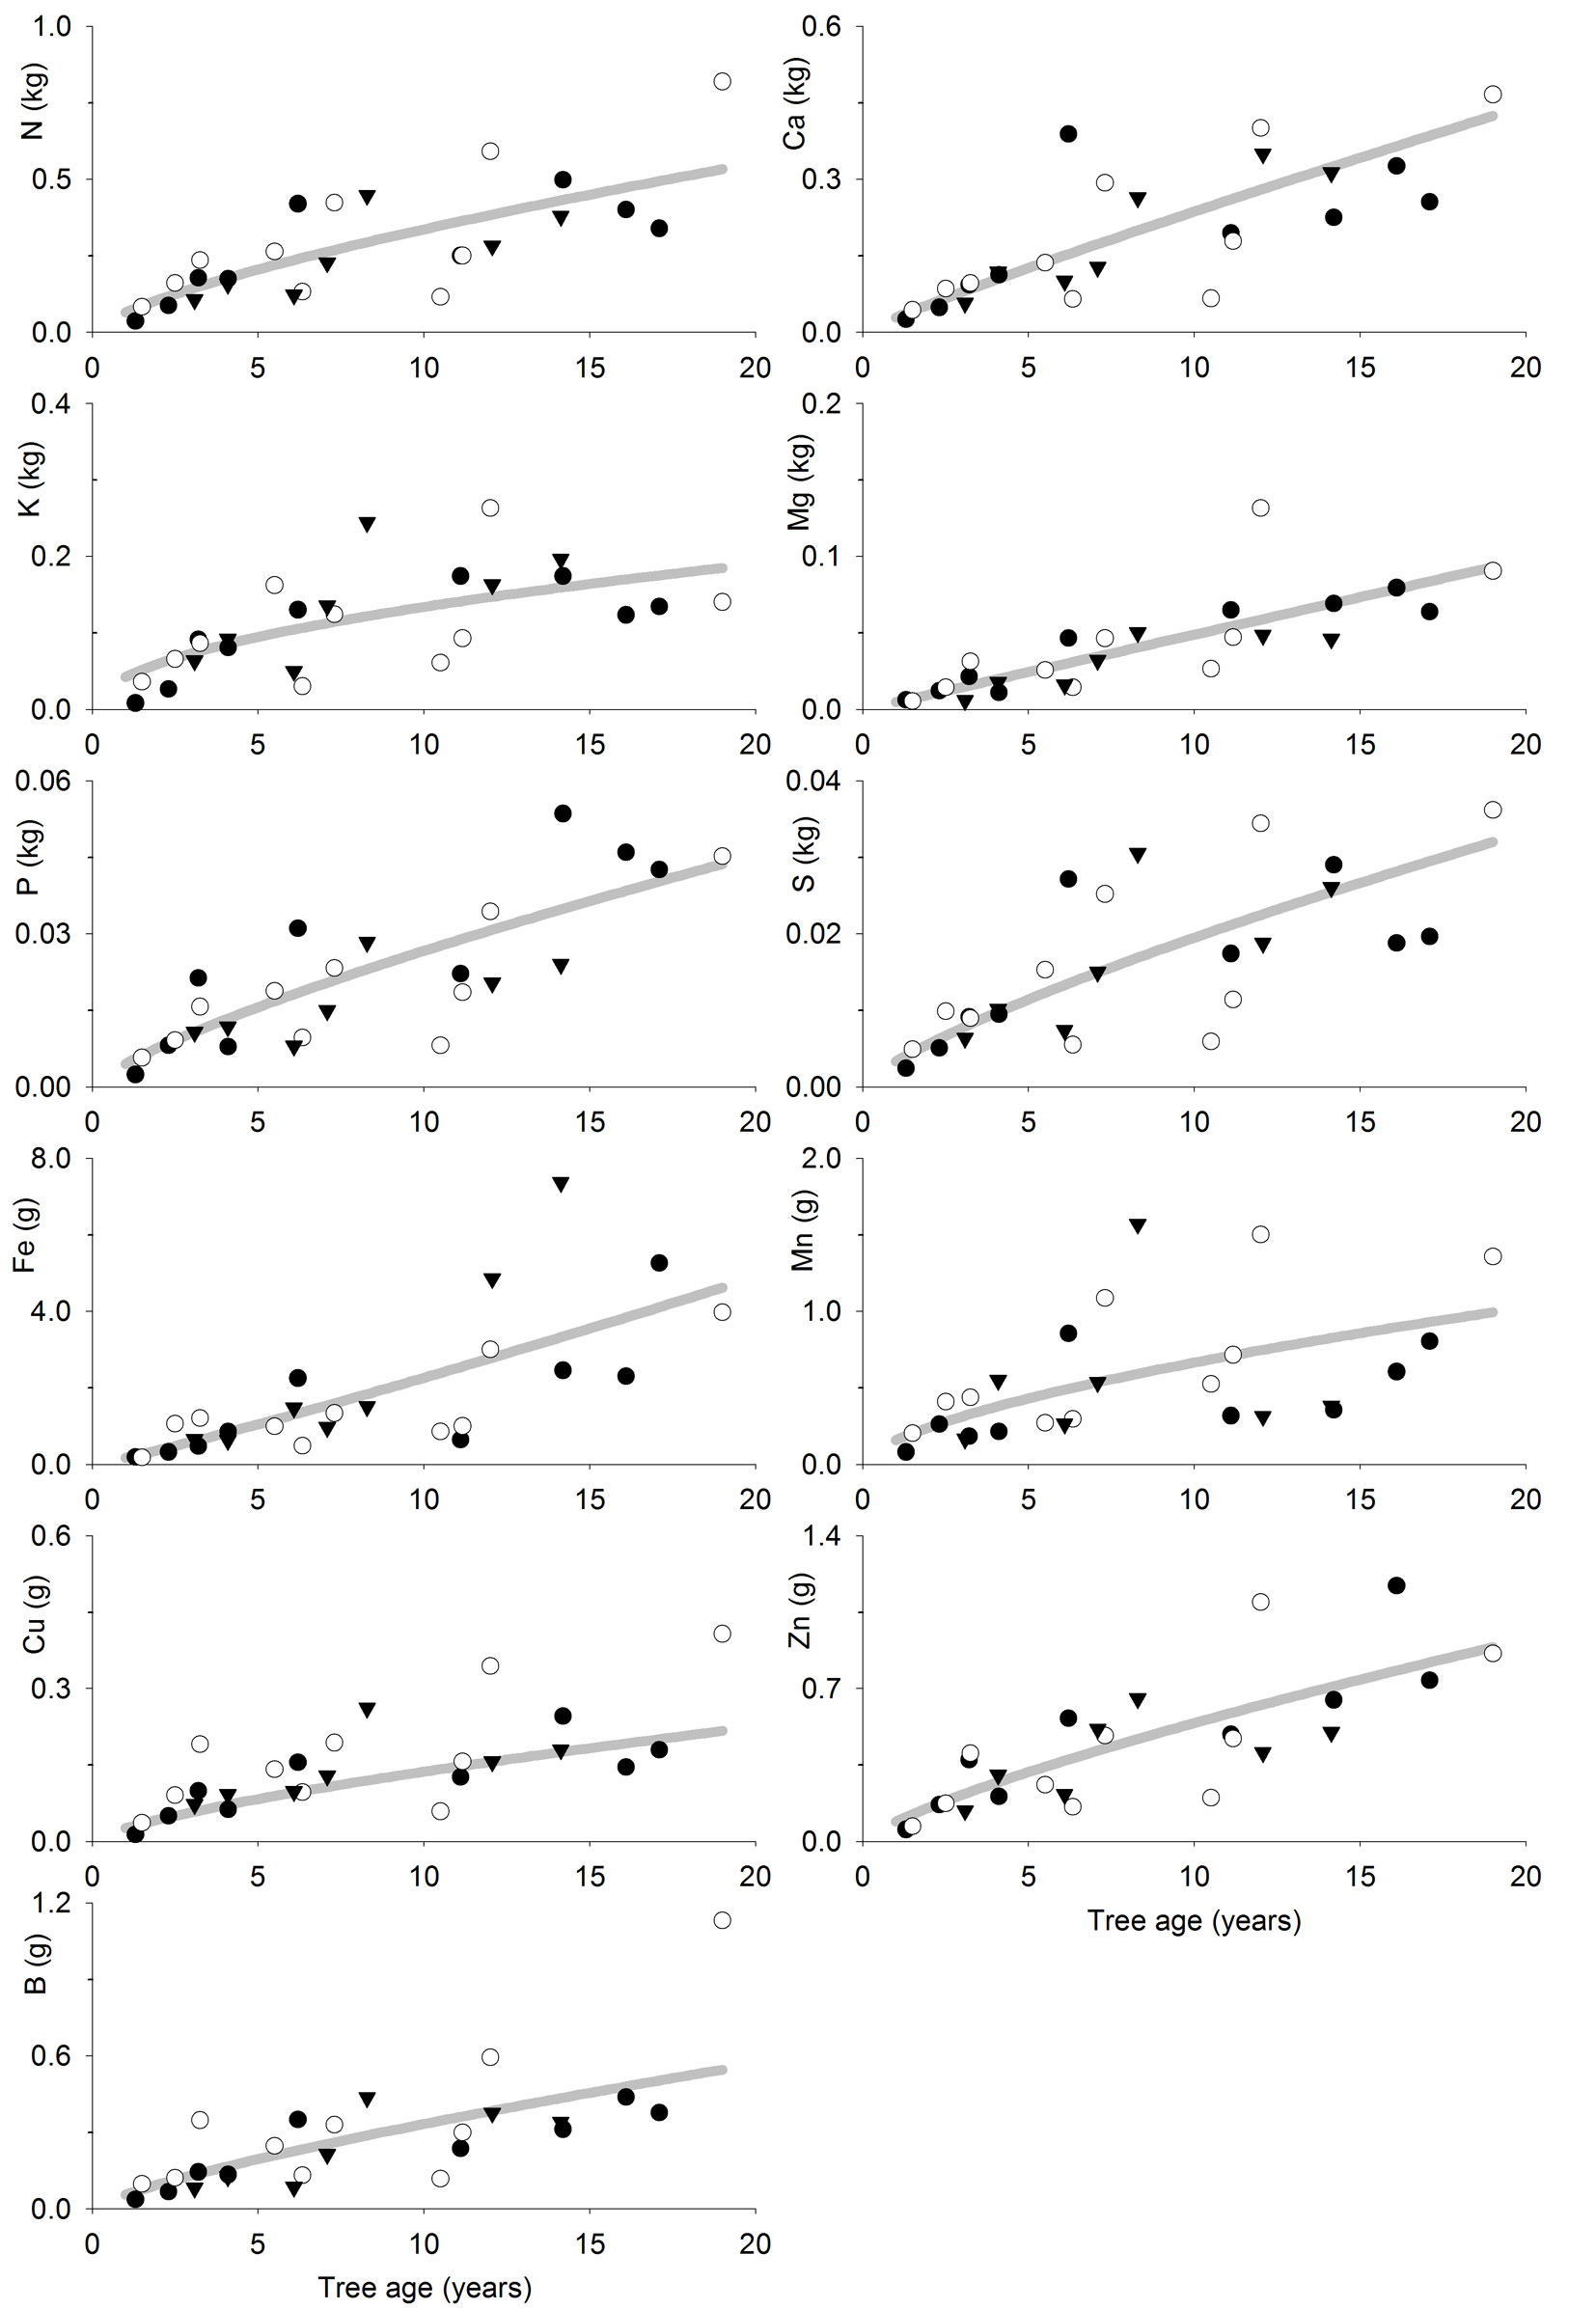
Fig. 4 - Tree bole and bark nutrient accumulation (kg tree-1 or g tree-1) as a function of tree age (years) in teak plantations (Tectona grandis L.f.). Points represent the sampled trees at three different locations: Guanacaste, Costa Rica (black circles); Northern Region, Costa Rica (white circles); Panama (black triangles). Lines represent the fitted models reported in Tab. 4.
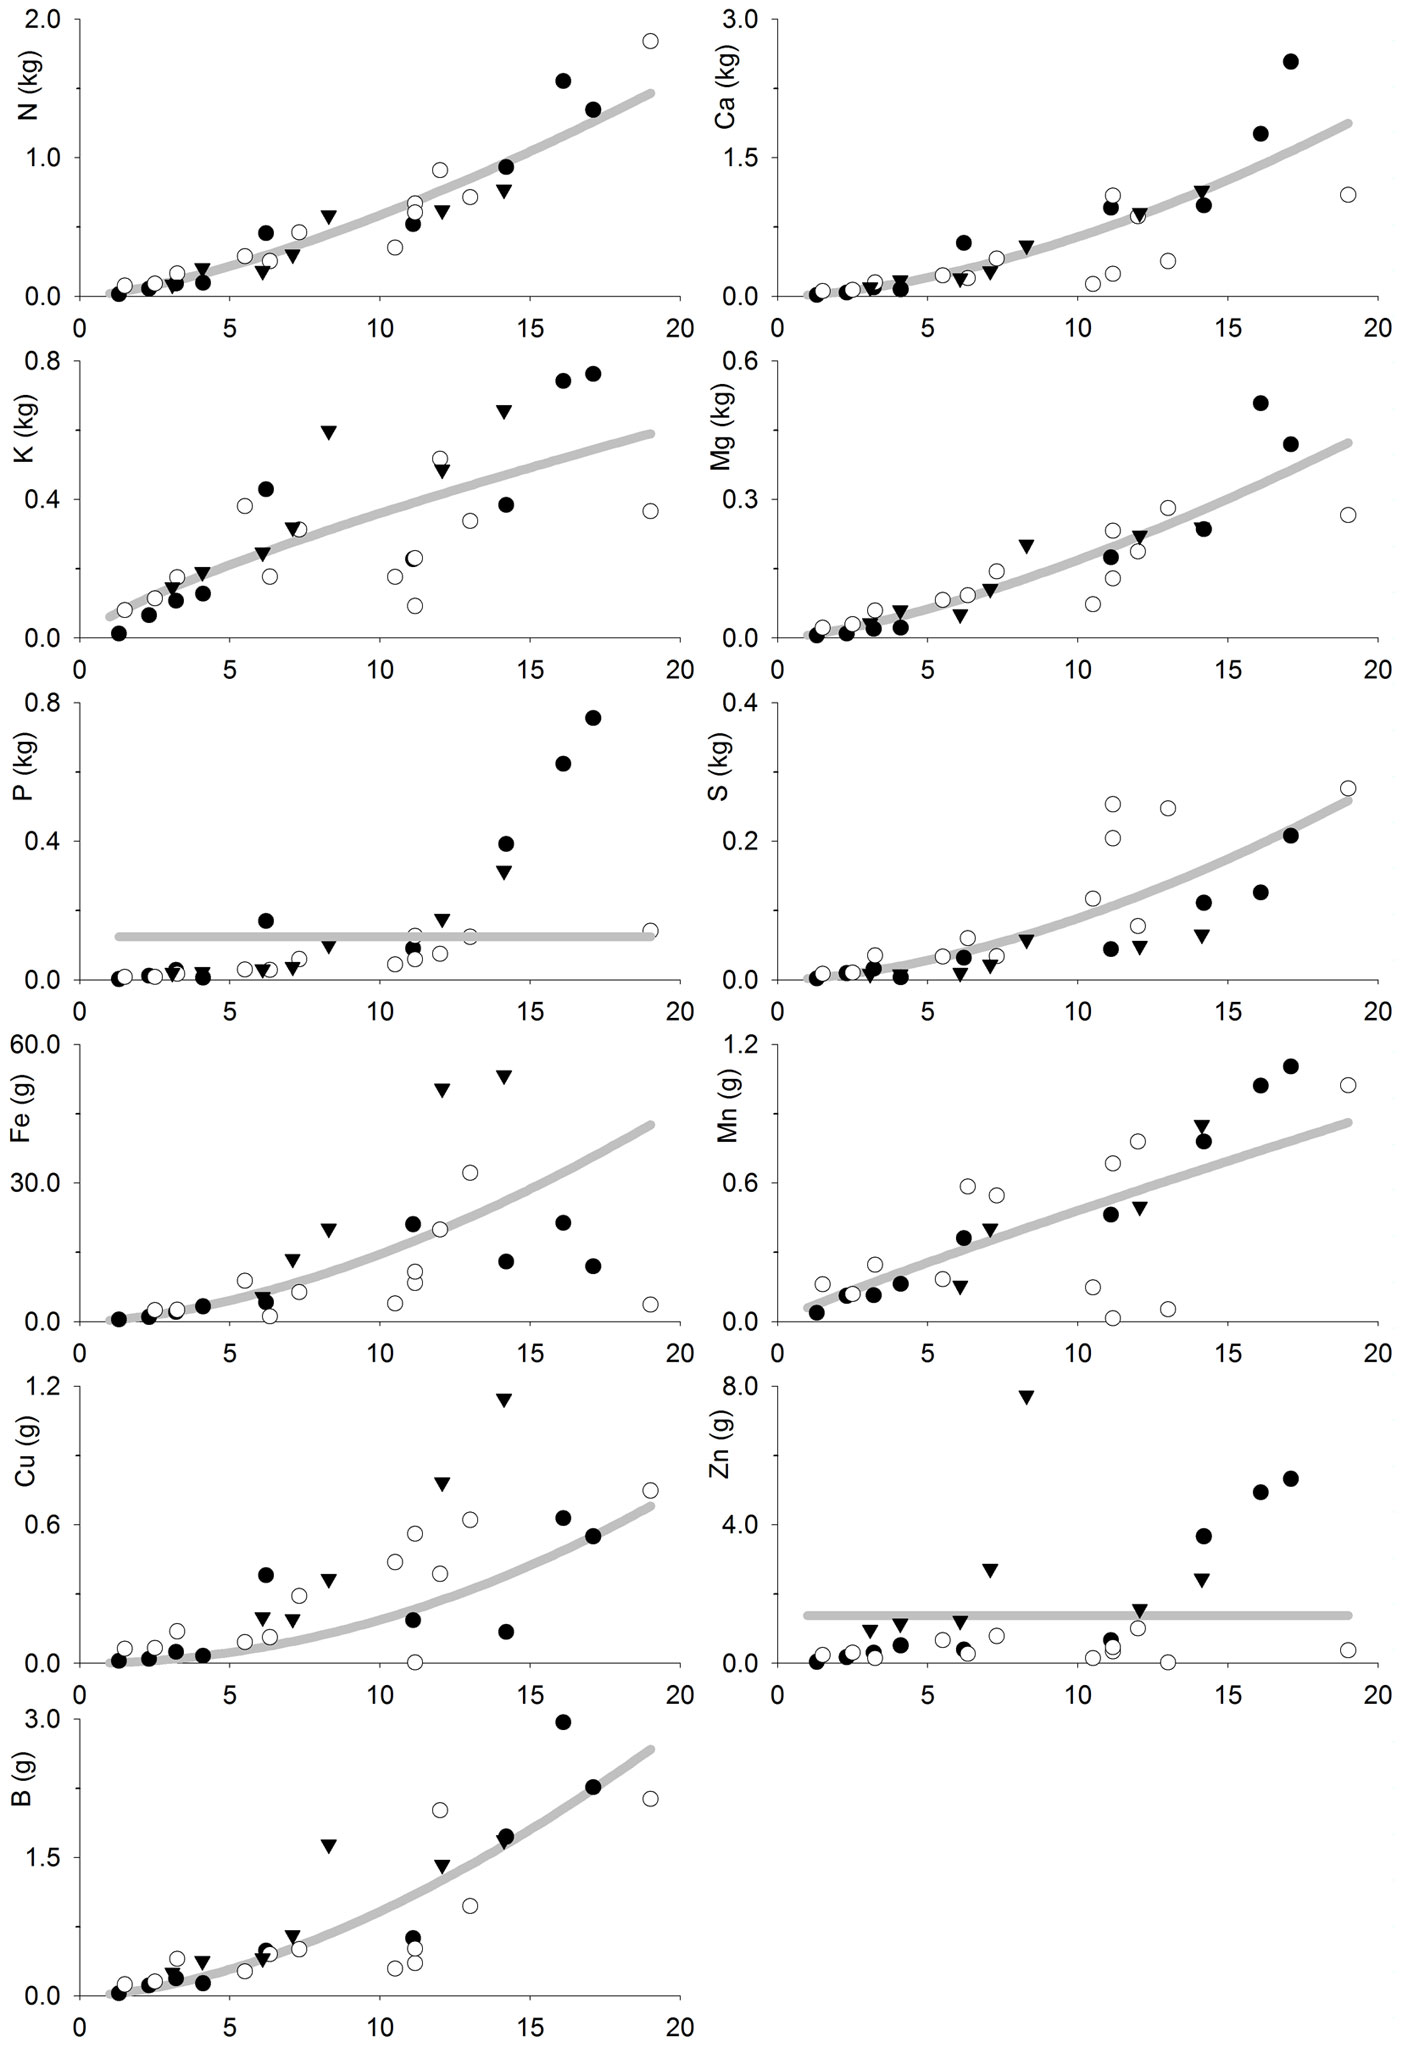
In the first years, total nutrient accumulation showed a tendency as P > K > N > Ca > Mg = S > Fe > Mn > Zn > B > Cu; the fifth year it was N > Ca > K > P > Mg > S > Fe > Zn > Mn > B > Cu; the tenth year it was Ca > N > K > Mg > P > S > Fe > Zn > B > Mn > Cu; and the nineteenth year it accumulated Ca > N > K > Mg > S > P > Fe > B > Zn > Mn > Cu. The estimation of the accumulation of some nutrients (mainly P) may not be well represented as it is based on an average of sampled trees from all ages, as no statistical model could be fitted with age as explanatory variable (Tab. 4). The estimated total tree nutrient accumulation at approximately one rotation period (19 years old) is 2.7 kg N, 4.4 kg Ca, 1.2 kg K, 700 g Mg, 200 g P, 400 g S, 61 g Fe, 3 g Mn, 1 g Cu, 6 g Zn and 7 g of B tree-1 (Tab. 5).
Tab. 5 - Nutrient accumulation in 1 to 19 years old teak (Tectona grandis L.f.) plantations in Costa Rica and Panama. Total nutrient accumulation is estimated from the statistical models summarized in Tab. 4 and represents the sum of the nutrients accumulated in bole, bark, branches and foliage. Individual tree estimations (Tab. 4) were used to calculate the stand values, assuming the following densities: 1000, 300 and 150 trees ha-1 at 1-5, 10 and 19 years respectively. (*): Nutrient estimates obtained by the models at different ages (confidence intervals are in parentheses, α=0.05). (**): No statistically sound model could be fitted between total P accumulation and age (Tab. 4); therefore, estimated P accumulation is based in the average from the sampled trees; all collected data was taken into account, no difference could be made based on tree age.
| Nutrient | 5 yr | 10 yr | 19 yr | |||
|---|---|---|---|---|---|---|
| nutrient tree-1 * | nutrient ha-1 | nutrient tree-1 * | nutrient ha-1 | nutrient tree-1 * | nutrient ha-1 | |
| N (kg) | 0.51 (0.46-0.56) |
508.89 | 1.21 (1.10-1.32) |
363.10 | 2.70 (2.45-2.95) |
404.99 |
| Ca (kg) | 0.48 (0.45-0.51) |
475.92 | 1.51 (1.42-1.60) |
453.28 | 4.40 (4.14-4.68) |
660.59 |
| K (kg) | 0.43 (0.34-0.52) |
434.14 | 0.74 (0.58-0.89) |
221.98 | 1.21 (0.96-1.45) |
181.85 |
| Mg (kg) | 0.11 (0.10-0.12) |
109.42 | 0.29 (0.27-0.32) |
88.36 | 0.74 (0.67-0.80) |
110.52 |
| P** (kg) | 0.22 | 217.97 | 0.22 | 65.39 | 0.22 | 32.70 |
| S (kg) | 0.05 (0.03-0.07) |
52.45 | 0.14 (0.09-0.20) |
42.35 | 0.35 (0.23-0.49) |
52.98 |
| Fe (g) | 9.03 (7.09-11.10) |
9027.53 | 24.30 (19.08-29.89) |
7290.09 | 60.79 (47.72-74.76) |
9118.48 |
| Mn (g) | 1.02 (0.90-1.13) |
1018.72 | 1.82 (1.60-2.02) |
544.54 | 3.10 (2.74-3.45) |
464.83 |
| Cu (g) | 0.27 (0.20-0.36) |
274.50 | 0.65 (0.47-0.85) |
195.87 | 1.46 (1.04-1.89) |
218.46 |
| Zn (g) | 1.39 (0.73-2.09) |
1391.18 | 3.01 (1.57-4.52) |
901.53 | 6.13 (3.2-9.21) |
919.77 |
| B (g) | 0.73 (0.65-0.82) |
730.84 | 2.32 (2.05-2.60) |
696.08 | 6.76 (5.98-7.58) |
1014.42 |
Nutrient export
Timber extraction as thinning or final harvesting implies export of nutrients allocated at bole and bark. Nutrient export varied from thinning to final harvesting as tree bole and bark nutrient allocation varied with age, as well as tree stocking (Tab. 6). Final harvesting constitutes a major nutrient output from the system, considering that 19 year old tree bole and bark nutrient accumulation was: 1.9 kg N, 1.5 kg Ca, 600 g K, 300 g Mg, 400 g P, 200 g S, 43 g Fe, 0.9 g Mn, 0.7 g Cu, 1.4 g Zn and 2.7 g B tree-1 (Tab. 6).
Tab. 6 - Nutrient export by timber extraction in 1 to 19 years old teak (Tectona grandis L.f.) plantations in Costa Rica and Panama, and comparison between nutrient export and total accumulation (Tab. 5) at 19 yrs old plantations. Nutrient export is estimated from the statistical models summarized in Tab. 4 and represents the sum of the nutrients accumulated in bole and bark. Individual tree estimations (Tab. 4) are used to calculate the stand values, assuming the following densities: 1000, 300 and 150 trees ha-1 at 1-5, 10 and 19 years, respectively. (*): Nutrient accumulation estimates obtained by the models at the different ages (confidence intervals are in parentheses, α=0.05). (**): Total accumulation represents the sum of the nutrients accumulated in bole, bark, branches and foliage of a mature stand (19 yrs) near to harvesting (Tab. 5). (***): No statistically sound model could be fitted between bole and bark P and Zn accumulation and age (Tab. 4); therefore estimated bole and bark P and Zn accumulation were based on the average from the sampled trees; all collected data was taken into account, no difference could be made based on tree age.
| Nutrient | Nutrient export (bole and bark) | Total accumulation at 19 yrs old plantations (nutrient ha-1)** |
Nutrient export compared to total accumulation at 19 yrs old plantations (%) |
|||
|---|---|---|---|---|---|---|
| 5 yr | 10 yr | 19 yr | ||||
| nutrient tree-1 * |
nutrient tree-1 * |
nutrient tree-1 * |
nutrient ha-1 |
|||
| N (kg) | 0.22 (0.19-0.24) |
0.59 (0.52-0.65) |
1.47 (1.31-1.63) |
219.93 | 404.99 | 54 |
| Ca (kg) | 0.20 (0.19-0.22) |
0.64 (0.59-0.69) |
1.87 (1.73-2.02) |
280.98 | 660.59 | 43 |
| K (kg) | 0.21 (0.15-0.27) |
0.36 (0.25-0.46) |
0.59 (0.41-0.76) |
88.48 | 181.85 | 49 |
| Mg (kg) | 0.06 (0.05-0.07) |
0.17(0.14-0.20) | 0.42 (0.36-0.49) |
63.39 | 110.52 | 57 |
| P*** (kg) | 0.15 | 0.15 | 0.15 | 23.02 | 32.70 | 70 |
| S (kg) | 0.03 (0.02-0.04) |
0.09 (0.05-0.14) |
0.26 (0.14-0.41) |
38.85 | 52.98 | 73 |
| Fe (g) | 4.61 (3.01-6.46) |
14.62 (9.55-20.52) |
42.61 (27.84-59.8) |
6391.91 | 9118.48 | 70 |
| Mn (g) | 0.26 (0.25-0.27) |
0.48 (0.46-0.50) |
0.86 (0.83-0.89) |
129.3 | 464.83 | 28 |
| Cu (g) | 0.08 (0.05-0.11) |
0.24 (0.16-0.34) |
0.71 (0.46-1.01) |
107.1 | 218.46 | 49 |
| Zn*** (g) | 1.41 | 1.41 | 1.41 | 211.9 | 919.77 | 23 |
| B (g) | 0.29 (0.23-0.35) |
0.92 (0.73-1.12) |
2.67 (2.13-3.27) |
400.67 | 1014.42 | 39 |
Discussion
Aboveground biomass allocation
In this study, tree and stand biomass estimates were similar or higher than those reported in other studies ([20], [35], [22], [23]). Such result was expected since only the best performing trees in each sampled stand were selected. However, stand biomass is low when compared to that reported by a spacing trial in south-western Nigeria ([33]). Most of the tree biomass was accumulated in the tree bole, accounting for 60% by itself and 69% of total tree biomass when considering bole and bark biomass altogether. Similar results were observed by other authors ([20], [35]).
Tree biomass increased sharply with tree age (Tab. 3, Fig. 2), whereas stand biomass showed a fast growth during an initial establishment stage (from 6 to 87 Mg ha-1 at years 1 and 5, respectively) and a smaller increment afterwards (from 87 to 121 Mg ha-1 at years 5 and 19, respectively). Little stand biomass variation with tree age or spacing has been shown for teak and other species ([33], [35], [36]). Tree foliage biomass increased with tree age reaching 29 kg tree-1 when trees were 19 years old, whereas its contribution to total tree biomass decreased from 11% to 6% and 4% at 5, 10 and 19 years old, respectively, a decreasing trend showed also in other studies ([35], [22]). Stand foliage biomass also decreased from 9.7 Mg ha-1 in the fifth year to 4.4 Mg ha-1 at age 19, which could be related to declining stand growth capacity (“age-related decline in productivity” - [16], [41], [7]). This also coincides with the declining trend shown between leaf biomass and tree spacing ([33]), as tree spacing increases with age in the sampled plantations due to the thinning regimen.
Nutrient accumulation and allocation
N accumulates mainly at foliage during the first years, because N foliage concentration is high and foliage is an important component of tree biomass at the beginning of the rotation. However, as foliage becomes a less important tree component and N foliage concentration decrease (Tab. 2 - [12]), the bole becomes the most important N sink in plantations older than 6-7 years old, as it is an important biomass sink. A similar pattern is followed by Ca as it is mostly accumulated in the foliage of young trees ([33]), where the bark biomass is low, and then is mainly accumulated in the tree bark later (and bole-and-bark consequently), which is the general pattern observed for teak and other species ([32], [36], [4], [38]). Other elements (K, Mg, P, S, Fe, Cu, Zn and B) showed a tendency to accumulate mainly at tree bole (or bole and bark) and branches at all ages, probably because the tissue concentration of such elements are lower (Tab. 2 - [12]), and so is the influence of the nutrient concentration on nutrient accumulation in the biomass. In general, this is consistent with the results of previous studies such as Nwoboshi ([32]), who reported that N, P and Mg mainly accumulate in the tree stem, while bark is considered as a Ca sink. Similarly, other authors reported the bole wood as the main sink for all nutrients considered ([33], [23]).
The relative importance of the different elements in tree nutrient accumulation also varies with tree age. Young teak trees accumulate P > K > N > Ca > Mg = S > Fe > Mn > Zn > B > Cu, whereas at the end of the rotation they have absorbed Ca > N > K > Mg > S > P > Fe > B > Zn > Mn > Cu. However, the high P accumulation at young trees are probably overestimated by the proposed model (Tab. 4) as we could not fit an appropriate model and the average for all ages had to be used. For the same reason, P accumulation at later ages in the rotation is probably underestimated (Tab. 4, Fig. 3 and Fig. 4). In general, this is consistent with the results of other studies where the nutrients most absorbed by teak were K > N > Ca >> Mg ≥ P ([32]), N = K > Ca > Mg > P ([33]), Ca > K > N > Mg > P = S ([31]), Ca > K > N > Mg > P > S ([5]) or N > Ca > K > Mg > P > Na > S > Cl ([23]). Hence, the general pattern across different studies is that teak mostly accumulates Ca, N and K. However, the most absorbed nutrient varies among the aformentioned investigations, likely depending on soil availability at each particular study site.
The proposed models (Tab. 4) allow managers to calculate the amount and allocation of nutrients accumulated by a well performing tree at different ages. As an example, a stand of 150 trees ha-1 at age 19 would accumulate 405 kg N ha-1, 661 kg Ca ha-1, 182 kg K ha-1, 111 kg Mg ha-1, 33 kg P ha-1, 53 kg S ha-1, 9 kg Fe ha-1, 465 g Mn ha-1, 218 g Cu ha-1, 920 g Zn ha-1, 1 kg B ha-1.
The nutrients accumulated (kg ha-1) in 5 year old teak stands (Tab. 5) represent between 70% to more than 100% of nutrients accumulated in 19 year old plantations (Tab. 5). Such evidence provides support to the Miller’s theory ([27], [28], [29]) that, if nutrition has been appropriate, nutrient uptake decreases when canopy closure occurs and nutrition is mainly based on translocation between tissues of the same tree and nutrient recycling. Alvarado ([3]) estimates than more than 70% of N required by a forest plantation could be provided by the mineralization of residues and wet and dry N deposition. Based on reviewed data, atmospheric N input could be estimated as high as 230 kg ha-1 over 20 years of the rotation period for a planted forest ([14], [3]), which is approximately 57% of N accumulation at the final stages of the rotation period (Tab. 5). However, stand N accumulation at earlier stages is higher (509 kg ha-1 at year 5 - Tab. 5) and atmospheric deposition during 5 years could be estimated as only 57.5 kg ha-1 (11% of the estimated plantation accumulation), pointing out a possible N deficit at early plantation stages that should be supplied by fertilizers if not supplied by soil N. Atmospheric inputs may vary remarkably from site to site, and a general value from literature cannot be used to close a nutrient balance. However, this points out the probable nutrient deficit in teak plantations compared with nutrient accumulation and exports, and hence the need to do more detailed studies to design a nutritional plan including forest fertilization. Fertilization can be considered as another nutrient input to the system but, at this moment, it is usually very low.
The low values of soil available K and extremely low in the case of P (Tab. 1) contrast with the relatively high K and P accumulation in tree biomass (Tab. 5). This could be explained just by the methodology used to estimate the topsoil availability of K and especially P. Alternatively, it could be caused by one of the following hypothesis: (a) best performing trees may benefit from a particular site condition with a soil nutrient availability higher than the average, which allows them to have better growth, and/or maybe a deeper root system which allows them to explore a larger soil volume; (b) teak roots may produce phosphatases which improve the mineralization rates of organic-P resulting in levels of available P higher than those detected by soil analysis ([8]); (c) those elements could be limiting teak productivity; (d) nutrient input as atmospheric deposition could be playing a key role in plantation nutrition as for these elements.
Well performing teak trees generally accumulate high quantities of N, Ca and K. As Ca soil availability is high if site selection was appropriate, special attention should be paid to other elements such as N, usually considered as limiting the productivity of terrestrial ecosystems; and K, which could become limiting due to its interaction with soil Ca and the usual high values of the latter. In addition, P and B ([25]) have also been reported as a limiting factors in forest soils and should be carefully considered. To a lesser extent, other elements such as Mg showed moderately high requirements, and possible limitations in specific environments may occur due to its interaction with Ca.
Nutrient export
The proposed models (Tab. 4) allow managers to assess the nutrient export by trees removal (including thinning) at different plantation ages by simply multiplying the number of removed trees by the nutrient removal per tree. Detailed thinning information was not available for the present study; therefore only estimations about nutrient export by final harvesting at the end of the rotation are reported (Tab. 6).
Nutrient export by timber extraction at the end of the rotation represents approximately half of the estimated tree nutrient accumulation of mature stands, varying between 23% and 73%, depending on the different elements (Tab. 6). The other half of the nutrient absorbed by the tree could remain at the site to be recycled and used in the following rotation, if an appropriate residues management is done ([14]). Timber extraction by final felling constitutes a major nutrient output from the system, as harvesting (bole and bark) 150 trees ha-1 at age 19 would export 220 kg N ha-1, 281 kg Ca ha-1, 88 kg K ha-1, 63 kg Mg ha-1, 23 kg P ha-1, 39 kg S ha-1, 6 kg Fe ha-1, 129 g Mn ha-1, 107 g Cu ha-1, 212 g Zn ha-1, 401 g B ha-1. Final felling nutrient extraction could be of special relevance in cases such as P and K, because of their low soil availability (Tab. 1), which could become a limiting factor after several rotations. Estimated N output at final felling (Tab. 6) is also high; however, no information about soil N content is available. Reported data for nutrient export is calculated as nutrient accumulated in bole and bark tissues; therefore, it is only a rough estimate, as a percentage of non-commercial stem is left at the site after final felling.
Nutrient export repeated over several rotations could be the cause of soil nutrients depletion ([28], [14], [11]), determining a decrease in forest productivity after several rotations ([40], [10]). The possibility to replace the nutrient output exported with harvesting with fertilization has been traditionally ignored by forest managers ([14]), although FSC ([15]) and several other authors ([40], [46]) recommend the application of fertilizer to sustain short-cycle plantation productivity.
Plantation Stability Indexes have been reported as a good measure to assess soil nutrient mining by forestry plantations ([14], [4]). Though such indexes can be considered as good indicators, more research efforts are needed, in particular for their application in the sustainability assessment in certification schemes or for their inclusion in payment for environmental services programs.
To minimize nutrient exports, many authors have proposed to debark tree stems at the plantation site ([40], [14], [26]). However, such practice may be hardly adopted by forest companies since it is non-profitable and time-consuming. As approximately half of the nutrients translocate from leaves to other tree tissues before senescence ([1]), bole and bark may have a higher nutrient concentration in the dry season, when teak is defoliated and timber extraction is usually carried out. Therefore, it could be recommended to program the final felling in a time of the year when nutrient exports are minimal. Moreover, if nutrients in the bole and bark had higher concentrations in the dry season compared with the rainy season, this would suppose an underestimation of the nutrient export reported in the present work. Hence, future research are needed to take such possible influence into account.
Conclusions
The models proposed in this work allow managers to calculate the amount of nutrients accumulated in bole and bark tree biomass depending on tree age, and can be used to estimate the nutrient extraction under different thinning management scenarios. This is the first study on this subject for Central America and the first step towards a complete nutrient balance for teak plantation systems aimed at a sustainable management of forest plantation.
Teak nutrition should pay special attention to N and K, together with Ca the 3 most absorbed nutrients by teak. In addition, P and B could also be limiting the productivity in planted teak forest. Nutrient export by timber extraction is high as compared to soil reservoirs, especially for P and K. The proposed models can serve as a guide for managers to calculate for each specific plantation the minimum nutrient inputs to be added over the rotation period to avoid soil nutrient depletion.
Acknowledgments
The authors would like to acknowledge the collaboration of Ecoforest (Panama), S.A. and Inversiones Agroforestales Ltd. Panamerican Woods Ltd Expomaderas Ltd. with sampling and for covering the cost of soil and tissue analysis. The authors also thank the personnel of the Natural Resources Laboratory at CIA/UCR for their help in sampling soils and tissues in the field, Richard Anderson (Green Millenium S.A.) and Adam Collins for their comments on the manuscript and for the improvement of English language. RMurillo, EP, JLF, VR, FK and JMV carried out the field measurements and revised the manuscript; RMata and AA conceived the study and revised the manuscript; JFM performed the statistical analysis and wrote the manuscript. The authors also thank two anonymous reviewers for their useful comments to an earlier version of this manuscript.
References
Gscholar
Gscholar
Gscholar
Gscholar
Gscholar
Gscholar
Gscholar
Gscholar
Gscholar
Gscholar
Gscholar
Gscholar
Gscholar
Gscholar
Gscholar
Gscholar
Gscholar
Gscholar
Gscholar
Gscholar
Authors’ Info
Authors’ Affiliation
Dept. Silvopascicultura, E.T.S.I Montes, Universidad Politécnica de Madrid (UPM), Ciudad Universitaria s/n, E-28040 Madrid (Spain)
Rafael Murillo
Edward Portuguez
Juan Luis Fallas
Vinicio Ríos
Folkert Kottman
Jean Marc Verjans
Rafael Mata
Alfredo Alvarado
Centro de Investigaciones Agronómicas, Universidad de Costa Rica (CIA-UCR), San Pedro (Costa Rica)
Instituto de Investigación y Servicios Forestales, Universidad Nacional (INISEFOR-UNA), Heredia (Costa Rica)
Corporación de Desarrollo Agrícola Del Monte, S.A., 4084-1000 San José (Costa Rica)
GSA Consulting Group (Costa Rica)
Ecoforest Panama S.A., Panama City (Panama)
Corresponding author
Paper Info
Citation
Fernández-Moya J, Murillo R, Portuguez E, Fallas JL, Ríos V, Kottman F, Verjans JM, Mata R, Alvarado A (2015). Nutrient accumulation and export in teak (Tectona grandis L.f.) plantations of Central America. iForest 8: 33-44. - doi: 10.3832/ifor1089-007
Academic Editor
Giustino Tonon
Paper history
Received: Jul 26, 2013
Accepted: Feb 17, 2014
First online: Jun 04, 2014
Publication Date: Feb 02, 2015
Publication Time: 3.57 months
Copyright Information
© SISEF - The Italian Society of Silviculture and Forest Ecology 2015
Open Access
This article is distributed under the terms of the Creative Commons Attribution-Non Commercial 4.0 International (https://creativecommons.org/licenses/by-nc/4.0/), which permits unrestricted use, distribution, and reproduction in any medium, provided you give appropriate credit to the original author(s) and the source, provide a link to the Creative Commons license, and indicate if changes were made.

Web Metrics
Breakdown by View Type
Article Usage
Total Article Views: 58700
(from publication date up to now)
Breakdown by View Type
HTML Page Views: 48510
Abstract Page Views: 3866
PDF Downloads: 4705
Citation/Reference Downloads: 26
XML Downloads: 1593
Web Metrics
Days since publication: 4365
Overall contacts: 58700
Avg. contacts per week: 94.14
Article Citations
Article citations are based on data periodically collected from the Clarivate Web of Science web site
(last update: Mar 2025)
Total number of cites (since 2015): 7
Average cites per year: 0.64
Publication Metrics
by Dimensions ©
Articles citing this article
List of the papers citing this article based on CrossRef Cited-by.
Related Contents
iForest Similar Articles
Research Articles
Modifying harvesting time as a tool to reduce nutrient export by timber extraction: a case study in planted teak (Tectona grandis L.f.) forests in Costa Rica
vol. 9, pp. 729-735 (online: 03 June 2016)
Research Articles
Links between phenology and ecophysiology in a European beech forest
vol. 8, pp. 438-447 (online: 15 December 2014)
Research Articles
High resolution biomass mapping in tropical forests with LiDAR-derived Digital Models: Poás Volcano National Park (Costa Rica)
vol. 10, pp. 259-266 (online: 23 February 2017)
Research Articles
Potential for utilization of wood ash on coastal arenosols with limited buffer capacity in KwaZulu-Natal and its effect on eucalypt stand nutrition and growth
vol. 10, pp. 180-188 (online: 19 November 2016)
Research Articles
Evaluation of urban forest landscape health: a case study of the Nanguo Peach Garden, China
vol. 13, pp. 175-184 (online: 02 May 2020)
Review Papers
Pathways to increase supply of sustainable wood from planted forests and trees to address bioeconomy needs: a review
vol. 19, pp. 168-185 (online: 12 May 2026)
Research Articles
Availability and evaluation of European forest soil monitoring data in the study on the effects of air pollution on forests
vol. 4, pp. 205-211 (online: 03 November 2011)
Review Papers
Drought-induced mortality of Scots pines at the southern limits of its distribution in Europe: causes and consequences
vol. 3, pp. 95-97 (online: 15 July 2010)
Research Articles
Matching seedling size to planting conditions: interactive response with soil moisture
vol. 12, pp. 220-225 (online: 25 April 2019)
Research Articles
Extreme climatic events, biotic interactions and species-specific responses drive tree crown defoliation and mortality in Italian forests
vol. 17, pp. 300-308 (online: 30 September 2024)
iForest Database Search
Search By Author
Search By Keyword
Google Scholar Search
Citing Articles
Search By Author
Search By Keywords
PubMed Search
Search By Author
Search By Keyword


