Evaluation of urban forest landscape health: a case study of the Nanguo Peach Garden, China
iForest - Biogeosciences and Forestry, Volume 13, Issue 3, Pages 175-184 (2020)
doi: https://doi.org/10.3832/ifor3206-013
Published: May 02, 2020 - Copyright © 2020 SISEF
Research Articles
Abstract
Urban forests are important as they provide recreation areas and offer ecological services. Both functions determine the status of an urban forest and reflect contradictory aspects of forest tourism development and environment conservation. However, assessment of urban forest health status at a landscape scale remains scarce. Here, we selected the Nanguo Peach Garden, China, as the study area. Urban forest health status at the landscape scale were classified into recreation and eco-conservation services. Sustainability was quantified using the principal component analysis and the Kriging method to map the landscape classification in the study area. With regard to landscape recreation sustainability, some 18.9% of the total study region was classified as “very good”. They were mainly distributed in the north, southwest, and southeast parts of the study area. The central and southeast regions, accounting for 9.5% of the total area, were classified as “very good” for eco-conservation sustainability. Regarding landscape health, the region classified as “very good” accounted for 11.1% of the total study area, and it was mainly distributed in the southern part of the area; the region classified as “very poor” accounted for 16.4% of the total area, and it was located in the northwestern and eastern parts of the study area. With improved landscape health status, the forest/non-forest patch area ratio was increased and the patch number ratio was decreased. A landscape was considered the healthiest when the forest/ non-forest area ratio was 0.65 and the patch number was 0.48. The spatial distribution of landscape recreation sustainability and eco-conservation sustainability differed in the Nanguo Peach Garden, and a close relationship was observed between the landscape health and forest landscape internal structure. Forest/non-forest patch area ratios and patch number ratios were relatively stable and constant, suggesting the urban forest landscapes were healthy. The healthiest forest landscapes were mainly distributed in the forest/non-forest transition zone and the unhealthiest forest landscape was mainly located in a single natural forest.
Keywords
Eco-conservation Sustainability, Landscape Recreation Sustainability, Patch Area Ratio, Patch Number Ratio, Urban Forest Landscape
Introduction
Urban forests offer valuable forest ecosystem services by enhancing the well-being of human populations and playing a part in establishing livable cities. However, they are among the landscape types that are most severely affected by urbanization ([36], [32], [22]). In terms of urban land development and utilization and eco-conservation, landscape recreation and eco-conservation service provided by urban forests are significant benefits that have been widely reported ([18], [6], [16]). On one hand, urban forests should provide landscape recreation through development and utilization ([2]); on the other hand, eco-conservation has received more attention, as urban forest landscapes will be gravely threatened by potential excessive development and utilization in the future ([13]). Hence, landscape recreation and eco-conservation determine the health of an urban forest landscape, comprehensively ([4]). Healthy urban forests should be highly sustainable, as they offer various service ([34]). Diagnosis and evaluation of landscape health of urban forests are pivotal for not only coordinating the relationship between urban land development and utilization and eco-conservation, but also elucidating the prerequisites for structural adjustment, function improvement, and pattern optimization in urban forests ([33], [29], [31]).
Previous studies on forest landscape health mainly focused on concepts, standards, and characteristics of landscape health, as well as theoretical issues, such as the establishment of index systems, selection of parameters determining landscape health, and classification of levels for landscape health evaluation ([20], [3], [41], [37], [15]). Most case studies mainly involved the following: report the health status of natural or near-natural forest ecosystems in mountainous regions at the forest stand, landscape, or even regional scale; construct evaluation models with regard to vigor, organizational ability, and resilience; and the quantitatively or qualitatively evaluate the overall health status of forest landscapes ([46], [9], [28], [44]). However, these studies could hardly quantitatively characterize the differences in health among the internal spaces of forest landscapes. Such quantitative studies are urgently needed to guide current urban forest development efforts to optimize the arrangement and layout of forest and non-forest landscape elements and to improve the service functions of current urban forests ([21]). Differences in functional orientation and survival environments suggest that the previously mentioned study methods for urban forests are unsuitable. For example, forests in mountainous regions are relatively free from human disturbance owing to their remote locations and primary function of providing wood resources. In contrast, urban forests are highly influenced by humans and are required to provide various services on a continuous basis, such as recreational and biodiversity conservation services ([35], [38]).
Considering these knowledge gaps, in this study, we aimed to improve the understanding of evaluation methodology of urban forest landscape health and to provide a theoretical basis for reasonable planning and enhancement of service functions of forest landscapes in future urban forest development projects. We investigated a representative urban forest Nanguo peach garden, located in the Pearl River Delta (China), and analyzed the spatial differences in terms of landscape recreation sustainability and eco-conservation sustainability. Hence, the specific questions addressed in this study were: (i) whether landscape recreation and eco-conservation contradict each other during the construction of urban forest landscape? (ii) how to coordinate the quantity and volume of landscape patches to achieve a healthier urban forest landscape? and (iii) are there any generally healthier urban forest landscape?
Materials and methods
Study area
The Nanguo Peach Garden is located in Shishan Town, Nanhai District, Foshan City, Guangdong Province, China (113° 04′ - 113° 07′ E, 23° 09′ - 23° 12′ N). It covers a total area of 15.4 km2 and is one of the “Eight New Scenic Areas of Foshan,” comprising Pingdinggang, Jianfengling, and Fenghuanggang. It has become a multi-purpose recreational area that serves several functions, including tourism, recreation, sightseeing, public science education, and biodiversity maintenance. The area has a subtropical monsoon climate characterized by the following: high precipitation in warm seasons; distinct dry and wet seasons; annual average temperature of 22.4 °C; and annual average precipitation of 1305.9 mm concentrated during the rainy season from April to September, accounting for 79% of the total annual precipitation. The soil in the area belongs to the typical lateritic red soil in the southern subtropical zone, and the area is covered by various vegetation types that mainly consist of indigenous broadleaf tree species, including Chinese guger tree (Schima superba), peach (Amygdalus persica), ivy tree (Schefflera heptaphylla), Indian laurel (Litsea glutinosa), camphor tree (Cinnamomum camphora), and Chinese machilus (Machilus chinensis), as well as certain exotic tree species, such as slash pine (Pinus elliottii), earleaf acacia (Acacia auriculiformis), and Timor white gum (Eucalyptus urophylla).
Data sources
QuickBird imagery (resolution: 0.6 m) captured on October 2, 2015, and acquired from Google Earth™, was used as the basic data source for this study. Based on GPS control points acquired from field surveys, high-accuracy geometric correction was performed for the QuickBird images using ArcGIS® v. 9.3 to ensure errors were less than 0.5 pixels. The WGS 1984 Web Mercator, a projection used in most web-mapping applications, was adopted as the projected coordinate system. Image classification was mainly based on visual interpretation. To ensure the accuracy of the classification map, a mapping scale of 1:1000 was used. Field surveys and land classification validation were conducted from June to September 2017, and 855 GPS validation points, with approximately 100 points for each landscape type, were acquired via three field surveys over 12 days. The overall accuracy and kappa coefficient of image interpretation were 96.73% and 0.96, respectively, and they fulfilled the requirements of this study.
Landscape classification
By referring to the Land Classification Standard of China (Document No. [2001] 255 of the Ministry of Land and Resources) and considering the landscape function characteristics and current landscape types of the study area, the landscape was classified into the following eight types: grassland, waterbody, forest, garden, cropland, constructed facility, road, and bare land. Fig. 1 shows the spatial distribution of the landscape types and Tab. 1 shows the secondary classifications and definitions of each landscape type.
Fig. 1 - Map of landscape classification in the Nanguo Peach Garden (refer to Tab. 1).
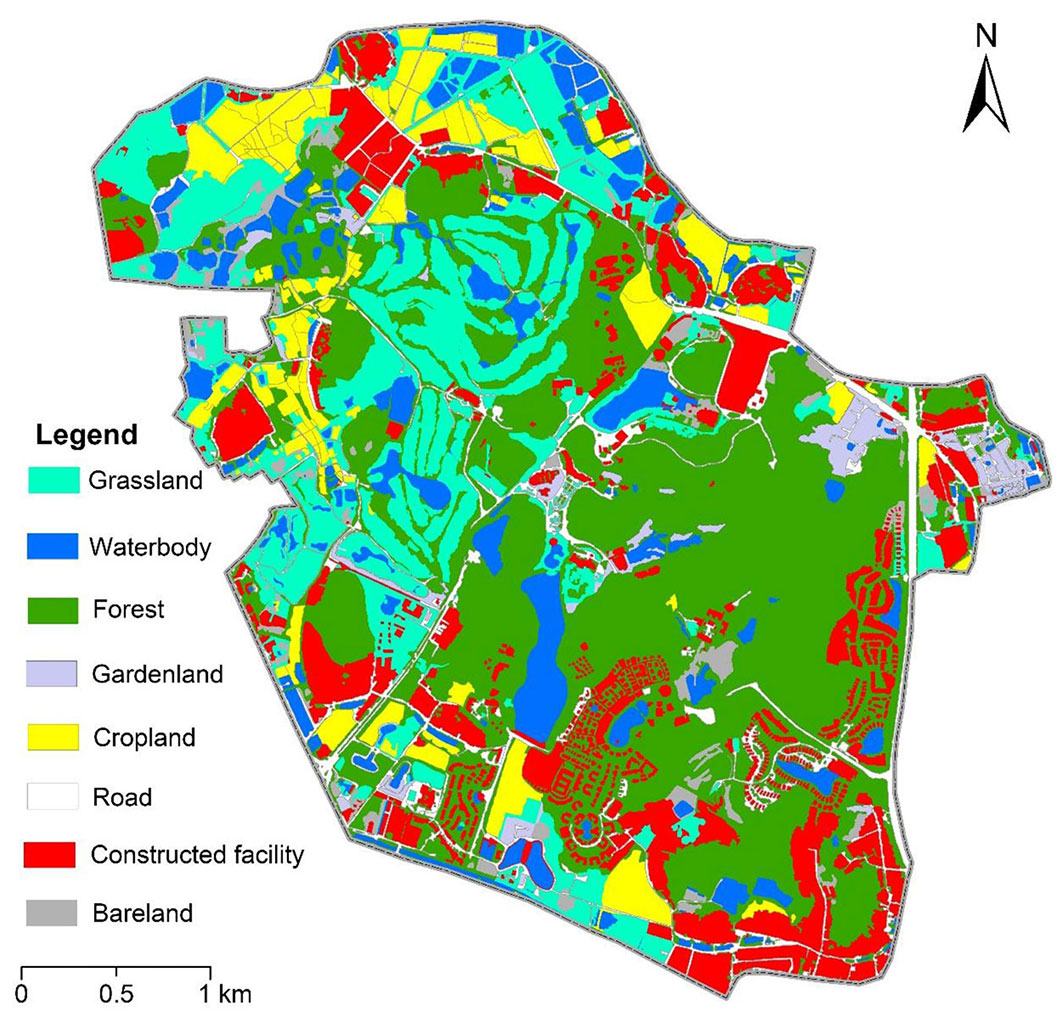
Tab. 1 - Landscape classification system of the Nanguo Peach Garden in Guangdong Province, China.
| Landscape type | Secondary classification | Description |
|---|---|---|
| Grassland | Waste grassland | Land dominated by natural herbaceous plants and weeds |
| Grass lawn | Artificial grassland or bush fallow used for aesthetics and recreational purposes | |
| Waterbody | River and canal | A natural or artificial linear waterway |
| Reservoir and pond | Land surface occupied by a broad waterbody; e.g., lake, reservoir, and pond | |
| Forest | Human habitat forest | Trees around settlements planted to maintain good Feng Shui |
| Corridor forest | Trees aside roads, railway tracks, rivers, or canals | |
| Mountain forest | Natural or artificial forest growing in low mountains with a canopy density of >30% | |
| Garden | Fruit garden | Garden dominated by intensively managed herbaceous plants and fruit trees; e.g., strawberry picking garden and banana plantation |
| Tea garden | Garden mainly used for growing tea | |
| Cropland | Paddy field | Arable land planted with aquatic crops; e.g., irrigated paddy-upland rotation land and paddy fields |
| Vegetable field | Land planted mainly with vegetables; e.g., greenhouse | |
| Constructed facilities | - | Artificial facilities including towns, rural settlements, and other artificial buildings |
| Road | - | Land for building road or other traffic facilities |
| Bare land | - | Land with a canopy density of <5%; e.g., bare land and abandoned grasslands, gardens, and cropland |
Landscape function classification in urban forests
Landscape structure index is a proxy for landscape function, and it depends on landscape classification ([27], [25]). Thus, a tri-level landscape classification system was established on the basis of urban forest structure and function (Tab. 2). The primary classification involved classifying the landscape into patches and corridors based on the structural units that constituted the landscape, by using the functional zoning principles of national forest parks in China. The secondary classification involved classifying the landscape into eco-conservation and landscape recreation areas based on planning targets and functional orientation. Eco-conservation areas were considered as areas with landscape resources characterized by valuable forests. The areas were characterized by less external disturbances and were internally undeveloped. These areas were also dominated by eco-conservation and restoration. Furthermore, landscape recreation areas were considered as areas with landscape resources that had relatively common forest types used for public activities, such as tourism, park management, tourist reception services, and public science education. Through the spatial overlay of eco-conservation and landscape recreational areas with patches and corridors, the landscape could be further classified into eco-conservation patches, eco-conservation corridors, landscape recreational patches, and landscape recreational corridors. The tertiary classification was performed based on the specific functions of the dominant landscape factors.
Tab. 2 - Classification levels of landscape functions in urban forests.
| Primary | Secondary | Tertiary | Description |
|---|---|---|---|
| Patch | Eco-conservation patch | Natural forest patch | In an eco-conservation area, characterized by a natural or quasi-natural forest landscape, complex landscape structure, rich ecosystem, diverse vertical structure, and horizontal structure of the area; e.g., mountainous forest. |
| Natural non-forest patch | In an eco-conservation area, characterized by a waterbody with a natural bank and natural grassland or forested landscape; e.g., waste grassland and ponds. | ||
| Landscape recreation patch | Artificial forest patch | In a landscape recreational area, characterized by an artificial forest with a simple structure and simple ecosystem structure; e.g., human habitat forest. | |
| Artificial non-forest patch | In a landscape recreational area, characterized by artificial hard or semi-hard surface structures and crop plots, and ornamental lawns; e.g., grass lawn, fruit orchard, and tea garden. | ||
| Corridor | Eco-conservation corridor | Natural corridor | Characterized by a complex landscape structure and rich ecosystem. The ecological functions involve the movement of species and material, and the ecological function of water storage and flood control; e.g., corridor forest and river canal. |
| Landscape recreation corridor | Artificial corridor | Provides a spatial contact channel for visitors and managers in the landscape recreational patch; e.g., roads. |
Index system and methods to evaluate landscape health
The current health status of an urban forest landscape generally reflects the effects of previous management strategies. Therefore, the effectiveness of previous management strategies could be assessed by evaluating landscape health based on the current health status. In this study, we combined the factors associated with the landscape composition characteristics of the Nanguo Peach Garden and established various indices that reflected the current status of landscape recreation sustainability and eco-conservation sustainability to determine landscape health. Landscape recreation sustainability was mainly composed of factors related to landscape recreation, while eco-conservation sustainability was mainly composed of factors related to biodiversity function maintenance. Specifically, four patch indices and four corridor indices were used to evaluate the landscape recreation sustainability and eco-conservation sustainability (Tab. 3).
Tab. 3 - Indices of landscape health assessment. (+): The higher the value, the better the sustainability; (-): the lower the value, the poorer the sustainability.
| Evaluation index | Landscape recreation sustainability index |
Eco-conservation sustainability index |
|---|---|---|
| Patch | X1: Landscape recreation patch area ratio + | Y1: Eco-conservation patch area ratio + |
| X2: Landscape recreation patch accessibility + | Y2: Eco-conservation patch fragmentation - | |
| X3: Landscape recreation patch separation - | Y3: Eco-conservation patch separation - | |
| X4: Landscape recreation patch diversity + | Y4: Eco-conservation patch diversity + |
|
| Corridor | X5: Landscape recreation corridor area ratio + | Y5: Eco-conservation corridor area ratio + |
| X6: α index of landscape recreation corridor + | Y6: α index of eco-conservation corridor + | |
| X7: γ index of landscape recreation corridor + | Y7: γ index of eco-conservation corridor + | |
| X8: β index of landscape recreation corridor + | Y8: β index of eco-conservation corridor + |
Step 1: Calculation of patch indices
The patch area ratio refers to the ratio of the patch area to the sampling area, while the landscape recreation patch accessibility refers to the least cost distance to the nearest landscape recreation patch ([40]). In the present study, the cost distance and minimum cumulative resistance model in ArcGIS® were used for the quantitative estimation of landscape recreation patch accessibility. Patch separation is the degree of separation of spatial distribution of individual patches, and it was calculated using the modified method reported by Chen et al. ([5] - eqn. 1):
where Fi is patch separation, Di is the distance index of the i-th patch type, Si is the area index of the i-th patch type, A is the total area of the landscape, i is the patch type, and n is the total number of patches.
Eco-conservation patch fragmentation is the degree of fragmentation of patches with eco-conservation functions, and it was calculated using the following equation (eqn. 2):
where Fn is the patch fragmentation index of the entire landscape, Nc is the total number of grid cells in the landscape data array, and it was calculated using the ratio of the total landscape area (A) and minimum area of patches with eco-conservation functions (Amin), that is, Nc = A / Amin; and Np is the total number of patches with eco-conservation functions ([26]).
Patch diversity is a measure of area and proportion of patches in each patch type. It reflects the complexity of patch types in the landscape. The formula used to determined patch diversity was as follows (eqn. 3):
where H is the Shannon-Wiener index, Pn is the proportion of the total landscape area belonging to the n-th patch type, and k is the total number of patch types. An increase in H indicated an increase in the diversity and complexity of the landscape structure ([42]).
Step 2: Calculation of corridor indices
The corridor area ratio is the ratio of the corridor area to the sampling area. The corridor network was distributed over the landscape matrix, and its connectivity exerts a significant effect on the normal functioning of landscape recreation and eco-conservation patches. In the present study, the corridor circuitry index (α), line-node ratio (β), and connectivity index (γ) were selected to describe corridor structures. The corridor circuitry index α indicates selectivity in the pathways for energy flow, material flow, or species migration, and it characterizes the degree of complexity of a network. The line-node ratio β indicates the average number of connecting lines for each node in the network, that is, the degree of difficulty in connecting one node with other nodes. The corridor network connectivity index γ indicates the degree of connectedness of all nodes in a network ([17]). The three indices were calculated using eqn. 4, eqn. 5, and eqn. 6, respectively:
where L is the number of edges in the network and V is the number of nodes. The values of α are within [0, l], with α = 0 indicating the absence of circuits in the network and α = l indicating the presence of the maximum possible number of circuits in the network.
where L is the number of edges and V is the number of nodes. A higher β value indicates a greater number of alternative pathways connecting each node.
where L is the number of edges and V is the number of nodes. The values of γ are within [0, l], with γ = 0 indicating no linkages between nodes, that is, minimum network connectivity, and γ = 1 indicating that all nodes are linked to each other, that is, maximum connectivity.
Based on the average areas of various landscape types, basic sampling units (size: 340 × 340 m) were established to collect spatial data, and regions having an area less than 50% of the basic sampling unit area were omitted, yielding 147 sampling units. The calculation and spatialization of all these indices were performed using the “Spatial Analyst” module in ArcGIS®. Extreme value normalization was performed for all indices to scale the index values to the [0, 1] range, and the normalized index values were classified into the following five rankings: very poor [0-0.2]; poor (0.2-0.4]; fair (0.4-0.6]; good (0.6-0.8]; and very good (0.8-1.0]. Finally, the Spatial Analyst module in ArcGIS® was used to perform spatial visualization of the various levels of the landscape recreation sustainability indices and eco-conservation sustainability indices for each basic sampling unit.
Methods to comprehensively evaluate landscape health
To reduce subjectivity in the evaluation process, the principal component analysis (PCA) method was selected to determine the weight of the landscape recreation sustainability and eco-conservation sustainability indices. Before the PCA, all indices were subjected to extreme value normalization to eliminate the dimensional effects. Based on the PCA results, the top three dominant component scores of the landscape recreation sustainability and eco-conservation sustainability indices were selected to compute the component score coefficient matrix (Tab. 4). The cumulative eigenvalue of the top three dominant components of the landscape recreation sustainability index exceeded 80.51%, with Kaiser-Meyer-Olkin (KMO) index = 0.617 and Bartlett sphericity test (BST) P < 0.01, whereas the cumulative eigenvalue of the top three dominant components of the eco-conservation sustainability index exceeded 76.26%, with the KMO index = 0.608 and BST P < 0.01. Therefore, the PCA requirements were satisfied for both aspects, and the weight of the dominant components could be determined based on their contribution rates to the calculation of the landscape recreation sustainability and eco-conservation sustainability evaluation values. The weight coefficients of the top three dominant factors of each aspect are shown in Tab. 4.
Tab. 4 - Dominant component score coefficient matrix of landscape recreation and eco-conservation sustainability. For details of “X1-X8” and “Y1-Y8,” see Tab. 3.
| Landscape recreation index |
Scores of dominant factors | Eco-conservation index |
Scores of dominant factors | ||||
|---|---|---|---|---|---|---|---|
| 1 | 2 | 3 | 1 | 2 | 3 | ||
| X1 | 0.018 | 0.535 | -0.035 | Y1 | 0.034 | 0.519 | 0.012 |
| X2 | -0.044 | -0.176 | 0.011 | Y2 | -0.017 | 0.079 | 0.114 |
| X3 | -0.055 | -0.050 | 1.017 | Y3 | -0.008 | 0.014 | 1.024 |
| X4 | -0.003 | 0.537 | -0.039 | Y4 | 0.028 | 0.543 | 0.010 |
| X5 | -0.293 | 0.026 | -0.035 | Y5 | -0.163 | 0.100 | -0.021 |
| X6 | 0.547 | 0.007 | -0.030 | Y6 | 0.736 | 0.016 | 0.002 |
| X7 | 0.186 | 0.018 | -0.025 | Y7 | -0.221 | 0.053 | -0.034 |
| X8 | 0.463 | 0.000 | -0.025 | Y8 | 0.516 | 0.031 | -0.010 |
| Eigenvalue | 3.229 | 2.251 | 0.961 | Eigenvalue | 3.200 | 1.731 | 1.168 |
| Contribution rate | 40.36 | 28.14 | 12.01 | Contribution rate | 40.01 | 21.64 | 14.61 |
| Weight coefficient | 0.501 | 0.350 | 0.149 | Weight coefficient | 0.525 | 0.284 | 0.192 |
The landscape recreation sustainability and eco-conservation sustainability evaluation values of each basic sampling unit were calculated by multiplying the normalized value of each evaluation index (Tab. 3) with the corresponding weight coefficient (Tab. 4) and summing the products. The evaluation values were subsequently classified according to the same five rankings mentioned earlier (very poor to very good). The Spatial Analyst module in ArcGIS® was used to perform spatial visualization of the various levels of the landscape recreation sustainability and eco-conservation sustainability evaluation values for each basic sampling unit.
The landscape health status of a forest landscape is positively correlated with landscape recreation sustainability and eco-conservation sustainability, respectively. Besides, a symbiotic relationship exists between landscape recreation sustainability and eco-conservation sustainability, that is, a healthy forest landscape can only exist with a balanced development of sustainable recreational spaces and those with sustainable eco-conservation efforts ([34]). In accordance with “China forest park landscape resources grade evaluation” (GB/T18005-1999) and “Forest park quality grading and evaluation” (DB44/T1228-2013), the following equation was adopted to comprehensively evaluate landscape health in the present study (eqn. 7):
where Zi is the comprehensive evaluation value of landscape health, Ri is the landscape recreation sustainability evaluation value, Ei is the eco-conservation sustainability evaluation value, and i is the spatial sampling unit.
The results of the comprehensive evaluation were classified according to the five rankings described earlier (very poor to very good), and the Spatial Analyst module in ArcGIS® was used for the spatial visualization of the various levels of the landscape health evaluation results for each basic sampling unit.
Results
Spatial distribution characteristics of indices
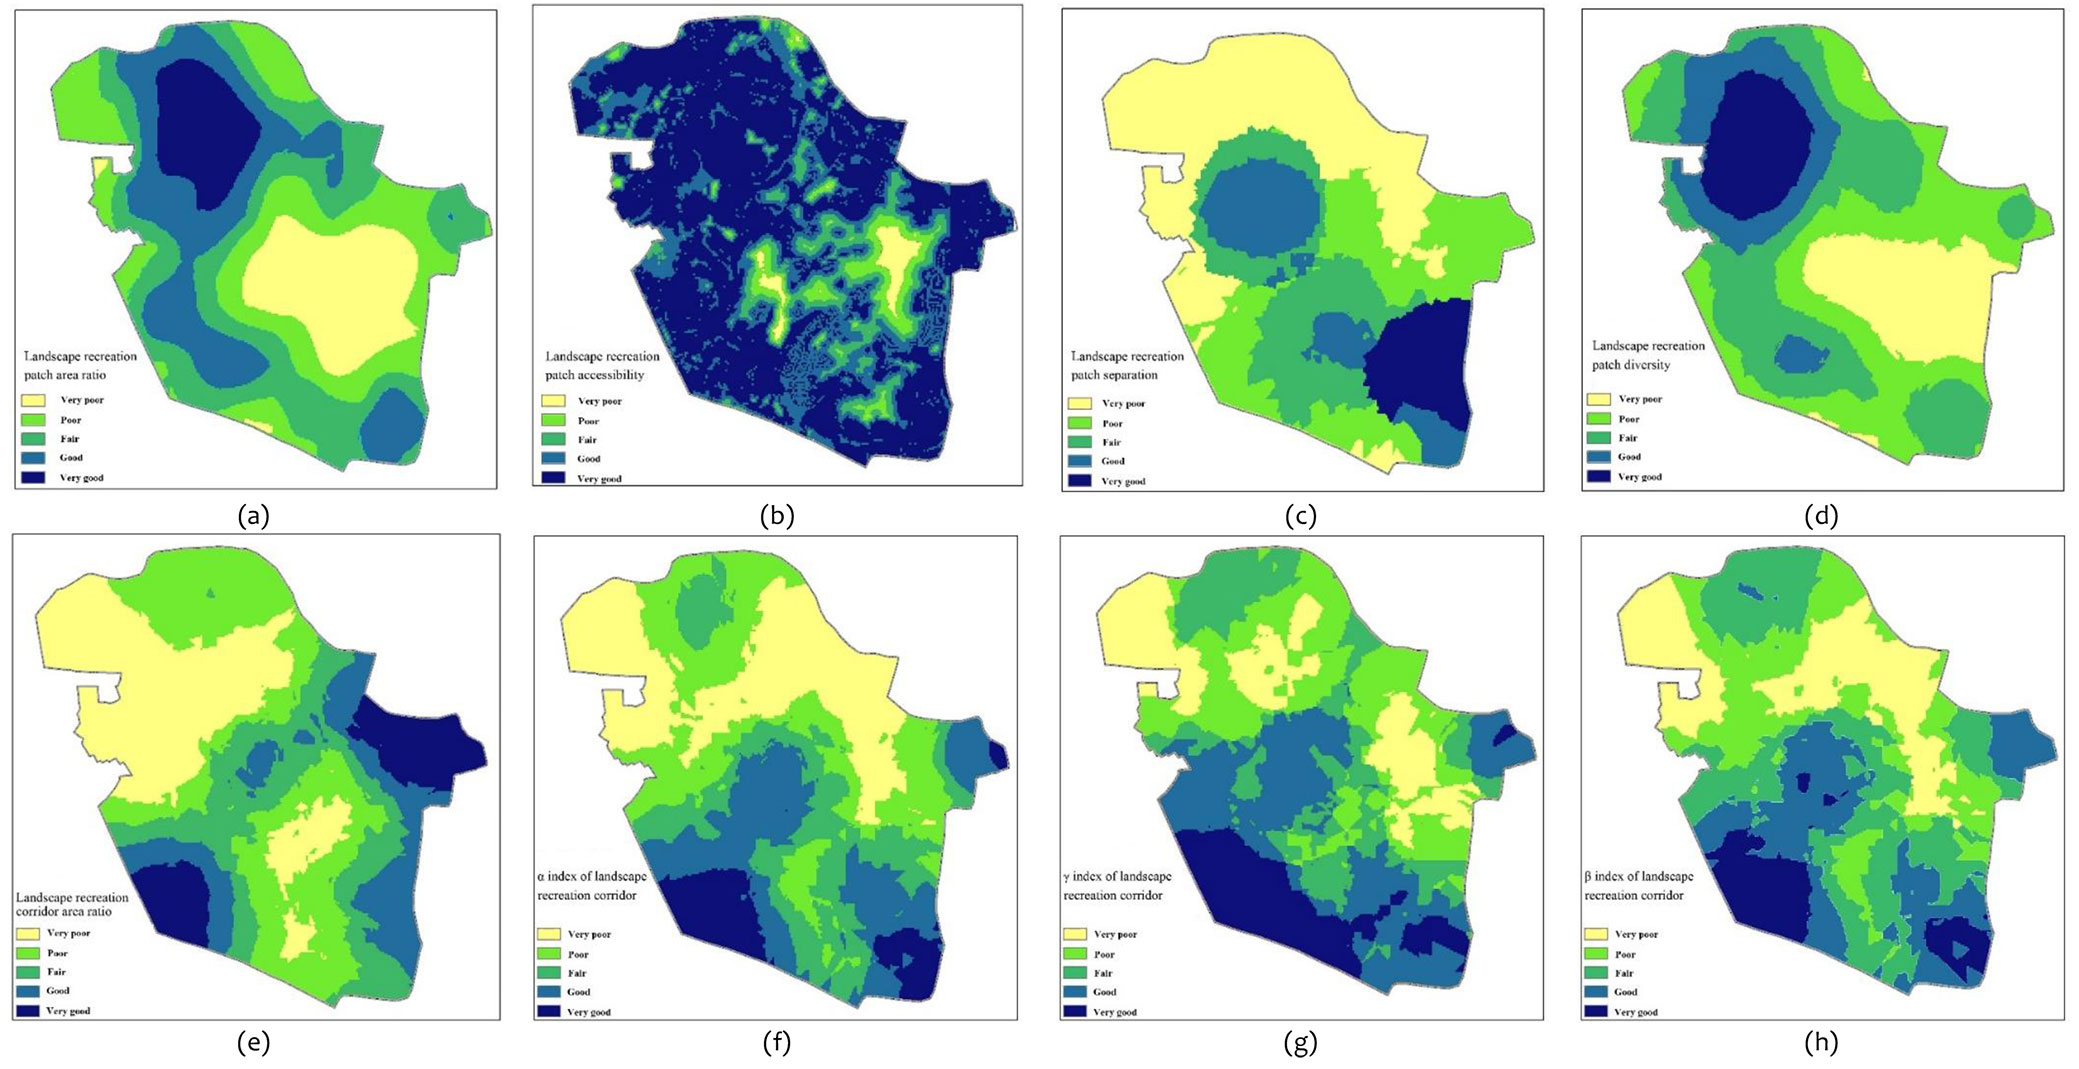
The spatial distribution characteristics of the various indices calculated using the landscape recreation sustainability evaluation method (Fig. 2) revealed that regions with the landscape recreation patch area ratio rated as “very good” accounted for only 12% of the total study area. This indicated that a small area in the landscape recreation patches was distributed in the study area. Most of the landscape recreation patches within the garden had relatively high accessibility and those in the entire study area had a low degree of separation. Less than 8% of the total study area accounted for the less accessible landscape recreation patches. These results showed that the landscape recreation patches were relatively concentrated, making it convenient for tourists to carry out recreational and sightseeing activities. In addition, most of the patches in the study area had a landscape recreation patch diversity rated as “fair” or lower, indicating that the landscape recreation patch types in the study area were not significantly varied. The landscape recreation corridor area ratios in the garden were mainly rated as “fair” or lower, demonstrating a slight inadequacy of landscape recreation corridor areas within the study area. With respect to the three indices, that is, α, β, and γ indices, of landscape recreation corridors, less than 15% of the corridors were rated as “good” or “very good,” whereas almost 45% were rated as “poor” or “very poor.” This indicated that most of the tour routes within the garden had moderate connectivity, with a few alternative routes available to tourists at each node. Therefore, during sightseeing, most tourists would be forced to retrace their steps to the starting point due to a lack of closed paths.
Fig. 2 - Spatial distribution indices of landscape recreation sustainability. (a) Landscape recreation patch area ratio; (b) Landscape recreation patch accessibility; (c) Landscape recreation patch separation; (d) Landscape recreation patch diversity; (e) Landscape recreation corridor area ratio; (f) α index of landscape recreation corridor; (g) γ index of landscape recreation corridor; (h) β index of landscape recreation corridor.
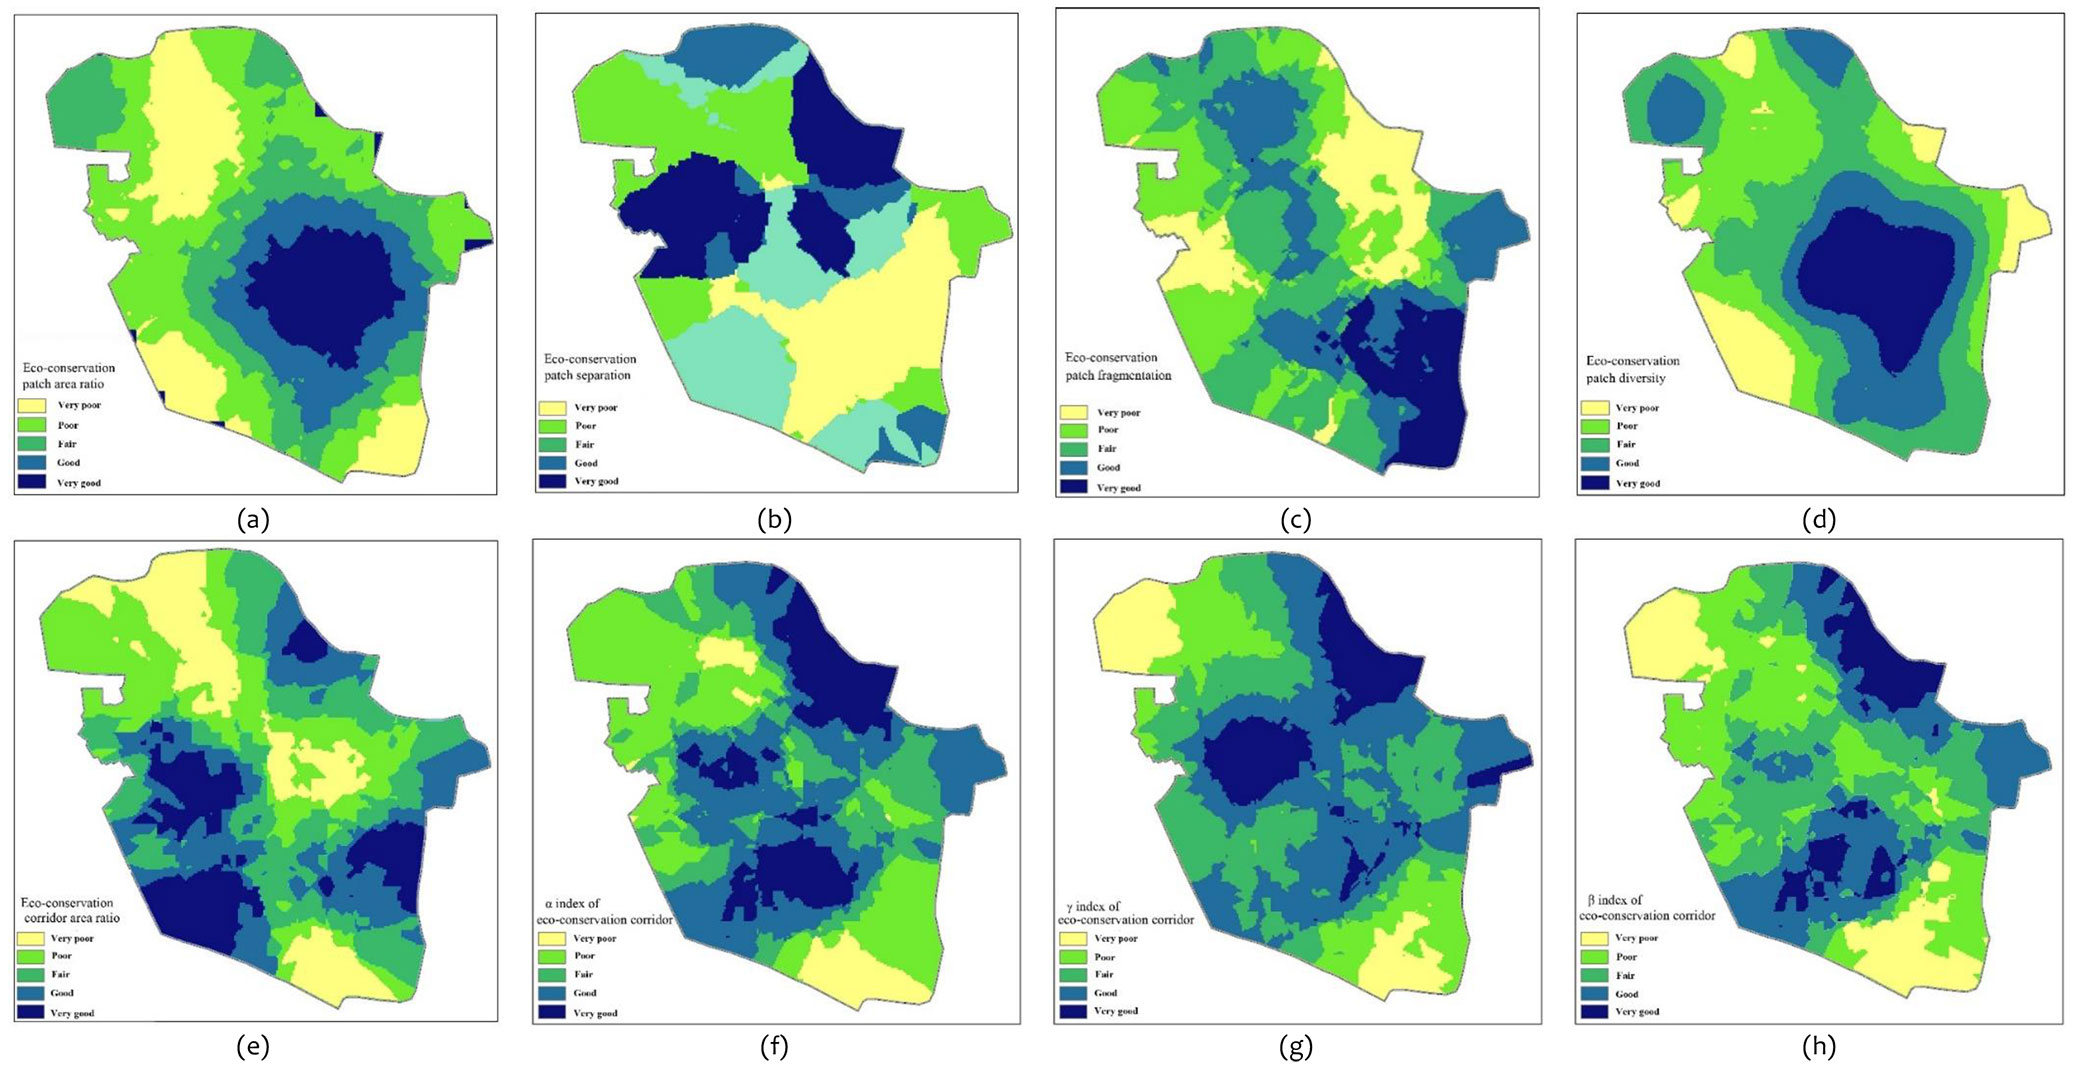
The spatial distribution characteristics of various indices calculated using the eco-conservation sustainability evaluation method (Fig. 3) revealed that regions with the eco-conservation patch area ratio rated as “very good” accounted for only 10% of the total study area. This indicated that a small area of the eco-conservation patches was distributed in the study area. The figure of eco-conservation patch separation and fragmentation showed that most regions were rated as “fair” or lower. As separation and fragmentation were inversely related to eco-conservation sustainability, these results indicated lower levels of separation and fragmentation among the eco-conservation patches of the study area, that is, the distribution of the patches was relatively complete and concentrated. Regions with the eco-conservation patch diversity rating of “fair” or higher accounted for more than 80% of the total study area, demonstrating a relatively high level of eco-conservation patch diversity and good eco-conservation function in the study area. Regions with the eco-conservation corridor area ratio rated as “good” or “very good” accounted for less than 20% of the total study area, indicating a relatively small area of eco-conservation corridors distributed within the study area. The overall α, β, and γ indices of the eco-conservation corridors were rated as “fair” and higher. These results indicated that, despite their small area, the eco-conservation corridors had a good connectivity and could maintain the normal execution of ecological functions.
Fig. 3 - Spatial distribution indices of eco-conservation sustainability. (a) Eco-conservation patch area ratio; (b) Eco-conservation patch separation; (c) Eco-conservation patch fragmentation; (d) Eco-conservation patch diversity; (e) Eco-conservation corridor area ratio; (f) α index of eco-conservation corridor; (g) γ index of eco-conservation corridor; (h) β index of eco-conservation corridor.
Evaluation of sustainability
The landscape recreation sustainability evaluation levels of the study area (Fig. 4a) indicated that the regions with a “very good” rating for landscape recreation sustainability accounted for 19.8% of the total study area and were distributed in the northern (Bagang), southwestern (peach garden), and southeastern (Longtou Village) sections of the garden. Regions with a “good” rating for landscape recreation sustainability accounted for 27.4% of the total study area and could be considered buffer zones of the regions with a “very good” rating, as they were distributed around these top-rated regions. The regions rated as “fair” accounted for 25.5% of the total study area and were mainly distributed in the central section of the garden and traversed the entire garden from south to north, which included the eastern section of Bagang, western section of Pingdinggang, and Bibo Lake. Regions rated as “poor” for landscape recreation sustainability accounted for 18.9% of the total study area, and they were mostly concentrated in the central part of the eastern section of the garden and the northeast corner of the garden, including the east and west of Pingdinggang and Fenghuanggang, the north of Hongji garden, and the western section of Daliangang. Regions with a “very poor” rating accounted for less than 10% of the total study area, and they were mainly distributed in Jianfengling and Hongji garden.
Fig. 4 - Spatial distribution of sustainability level. (a) Landscape recreation sustainability level; (b) Eco-conservation sustainability level.
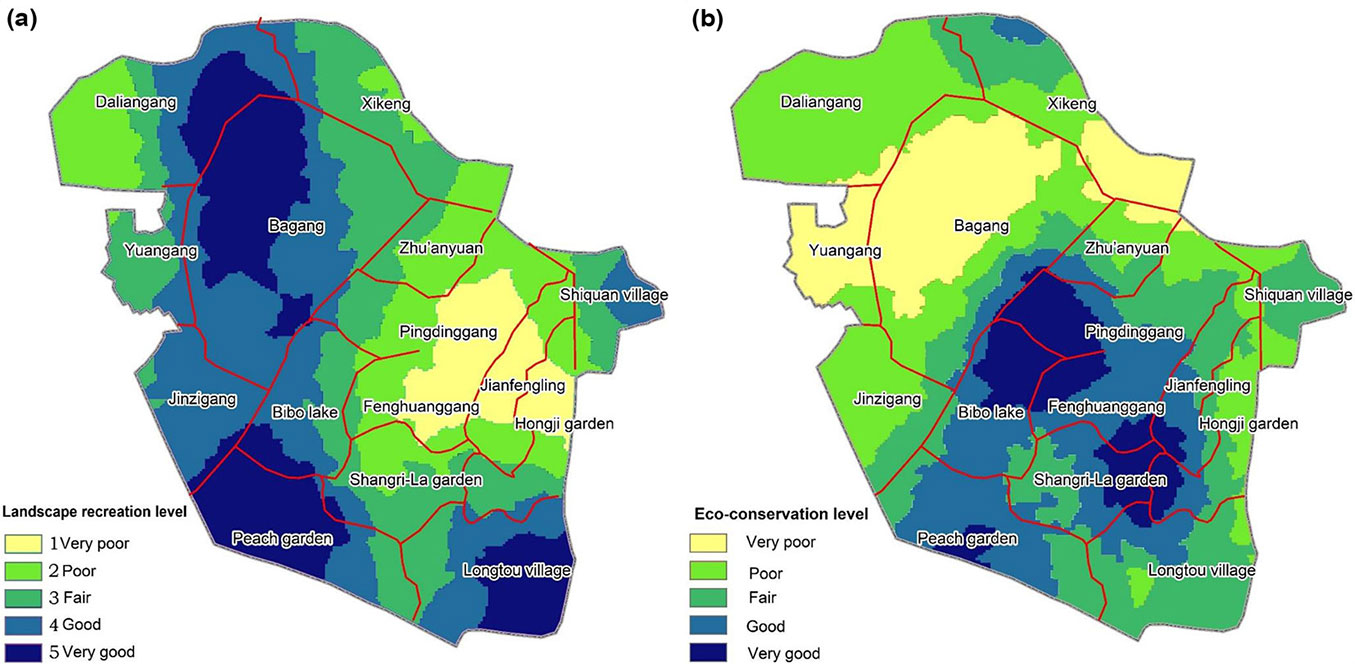
The eco-conservation sustainability evaluation levels of the study area (Fig. 4b) indicated that regions with a “very good” rating in eco-conservation sustainability were concentrated in the central and southeastern sections of the garden, which mainly included the Bibo Lake and Shangri-La garden and accounted for ~9.5% of the total study area. The eco-conservation sustainability in the periphery of these regions gradually transitioned from “good” to “poor.” Furthermore, regions with the poorest eco-conservation sustainability accounted for ~17% of the total study area, and they were concentrated in the north-central section of the garden, which mainly included Yuangang, northern Bagang, and central Xikeng.
Spatial distribution of landscape health
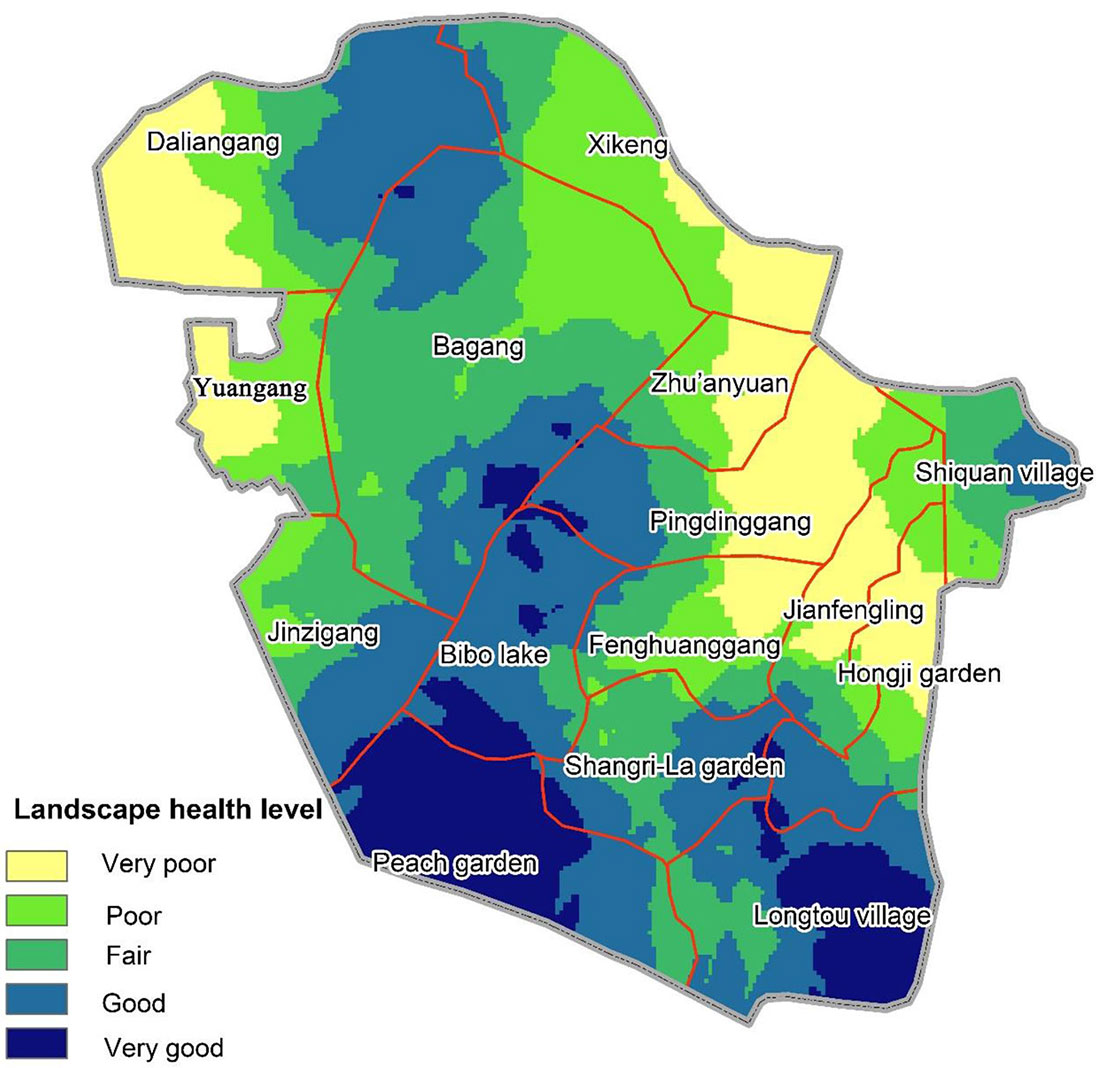
The landscape health of the Nanguo Peach Garden was determined by evaluating both landscape recreation sustainability and eco-conservation sustainability. The spatial distribution of landscape health in the study area was obtained based on the spatial distribution characteristics of both aspects and the equation for the comprehensive evaluation of landscape health (Fig. 5). The overall landscape health of the Nanguo Peach Garden gradually declined from the southwestern region to the northeastern region (Fig. 5). Regions rated as “good” or “very good” accounted for 39.6% of the total study area. Specifically, regions with the best landscape health status (regions rated as “very good”) accounted for 11.1% of the study area, and they were located in the southwestern section of the garden, which mainly included the peach garden and Longtou Village, whereas regions with a “good” rating for health status accounted for 28.5% of the total study area. Regions with the poorest landscape health status (regions rated as “very poor”) accounted for 16.4% of the total study area, and they were mainly distributed in the northwestern section and east of the garden, namely, the west of Daliangang and Yuangang; east of Xikeng, Zhu’anyuan, Pingdinggang, and Fenghuanggang; and between Jianfengling and Hongji garden.
Fig. 5 - Spatial distribution of landscape health in the study region.
Relationships between landscape health and forest internal landscape factors
A complex relationship exists between the landscape health, landscape recreation, eco-conservation sustainability, and internal landscape factors of a forest. For instance, with the enhancement of landscape health status from “very poor” to “very good,” the forest/non-forest patch area ratio in the Nanguo Peach Garden showed a generally decreasing trend, and the “very good” rating of landscape health was achieved at a patch area ratio of 0.65 (Tab. 5). The forest/non-forest patch number ratio generally increased as the health status improved, and the “very good” rating for landscape health was achieved at a patch number ratio of 0.48 (Tab. 5).
Tab. 5 - Ratio of the area and number of forest/non-forest patches in each grade region in Guangdong Province, China. (LH) Landscape health; (EC) Eco-conservation; (LR) Landscape recreation.
| Level | Forest/non-forest patch area ratio |
Forest/non-forest patch number ratio |
||||
|---|---|---|---|---|---|---|
| LH | EC | LR | LH | EC | LR | |
| Very poor | 0.92 | 0.46 | 5.20 | 0.32 | 0.45 | 0.31 |
| Poor | 0.57 | 0.40 | 0.84 | 0.33 | 0.29 | 0.33 |
| Fair | 0.67 | 0.63 | 0.55 | 0.35 | 0.40 | 0.33 |
| Good | 0.67 | 1.33 | 0.51 | 0.38 | 0.36 | 0.34 |
| Very good | 0.65 | 1.85 | 0.49 | 0.48 | 0.45 | 0.47 |
As shown in Tab. 5, with the rating of “very poor” to “very good” for eco-conservation sustainability, the forest/non-forest patch area ratio gradually increased, and the “very good” rating for eco-conservation sustainability was achieved at a patch area ratio of 1.85. Furthermore, the forest/ non-forest patch number ratio exhibited a W-shaped upward trend, with a “very good” rating for eco-conservation sustainability achieved at a patch number ratio of 0.45. The rating of landscape recreation sustainability was negatively correlated with the forest/non-forest patch area ratio (Tab. 5) and positively with forest/non-forest patch number ratio. Therefore, a decrease in the forest/non-forest area ratio or an increase in the patch number ratio would enhance landscape recreation sustainability of the area. Findings of the field surveys indicated that regions with a poorer rating for forest landscape recreation sustainability had a significantly high proportion of conjoined and undeveloped near-natural forests, which weakened the landscape recreation function.
Discussion
Different sustainability patterns of landscape recreation and eco-conservation
Information on sustainability patterns are essential tools to evaluate urban forest landscape health ([7], [11], [10]). In this study, we quantified various weights of sustainability of landscape recreation and eco-conservation index including patch index and corridor index. This promoted our understanding of not only the key index for sustainability, but also the different sustainability patterns of landscape recreation and eco-conservation. There were significant differences in terms of sustainability level for both landscape recreation and eco-conservation. Regions with the “very good” or “good” rating for landscape recreation sustainability accounted for ~47.2% of the total study area, and the same rating for eco-conservation sustainability rating accounted for less than 30% of the total study area. This indicated that the landscape recreation has received more attention than eco-conservation in the Nanguo Peach Garden. The overlapping regions with the “very good” or “good” rating for landscape recreation sustainability and eco-conservation sustainability, accounted for ~10.9% of the total study area. Whereas, the overlapping regions with sustainability rating of “very good” or “good” for landscape recreation, as well as “very poor” or “poor” for eco-conservation, accounted for ~21.0% of the total study area. This showed an overall mutually constraining relationship and a certain degree of dependency between landscape recreation sustainability and eco-conservation sustainability of urban forests. These findings confirmed that landscape recreation and eco-conservation together determined the urban forest landscape health, and this was is in consistent with the findings of other studies ([4], [27]). Regarding the specific indicators, the patch area ratio and diversity as well as the corridor of α and β indices might be the key indicators affecting the sustainability patterns.
The evaluation of forest landscape health performed in this study provided a snapshot of the situation in the Nanguo Peach Garden; however, spatial differences in landscape health are dynamic in nature ([12], [23]). Therefore, in future studies, indices that reflect the dynamic processes of eco-conservation and landscape recreation, such as the ecological and recreational flows of landscapes, should be established for a more comprehensive representation and evaluation of spatial differences in landscape health.
Area ratio and number ratio of forest landscape patch
The scientific arrangement of landscape factors in urban forest is a prerequisite for the healthy development of forests ([24], [43]). Forest/non-forest landscape patches (e.g., buildings, water, and squares) are essential components for urban forest landscape, and increasing attention has increasingly been paid to the interface between them ([1]). The patch area and number might been the key factors affecting urban forest landscape health ([45]). In this study, we quantified the landscape patch area ratio and number ratio of forest/non-forest. With the rating of “good” or “very good” for landscape recreation sustainability and the eco-conservation sustainability at “good” or “very good”, the value of forest/non-forest landscape patch area ratio was in the range of 0.49-0.51 and 1.33-1.85, respectively. Hence, it was difficult to find a value that fulfilled the standard of “good” or “very good” rating for sustainability because of non-overlapping. However, with the same rating, the forest/non-forest landscape patch number ratio was in a range of 0.34-0.47 and 0.36-0.45. There was a wide overlap and therefore that we could easily find values to fulfill the “good” or “very good” rating for sustainability. These findings could help to provide guidelines for urban forest managers to prioritize appropriate patch number ratio strategy for improving the urban forest landscape health. However, because there was a certain (and limited) range of applicability for such relationships ([14]), the definition of the ultimate limits of applicability might determine the most appropriate forest/non-forest patch area ratio and patch number ratio under conditions of optimum forest landscape health, thereby providing a scientific basis for future urban forest landscape planning.
Landscape health and landscape type
It has been reported that there are certain correlations between landscape types and landscape health ([8], [39]). Generally, there were more landscape types in regions with a better landscape than those regions with a single landscape type showing poorer landscape health. To the best of our knowledge, regions with more landscape types were concentrated in the transition zone between forest and non-forest landscapes. Instead, internal areas of forests only had a single landscape type.
The evaluation of differences in landscape health is, to a certain extent, dependent on the spatial scale ([30]). A smaller spatial sampling unit scale results in a larger number of outliers and poorer spatial continuity ([19]), which are detrimental to the study of the corresponding relationship between the landscape health and landscape types. On the contrary, a larger spatial sampling unit scale produces less accurate evaluation results, which do not reflect the actual spatial distribution characteristics, and will increase the chances of incorrect corresponding results of landscape health and landscape type. Therefore, the selection of appropriate spatial sampling unit scales for specific land masses is also crucial, and it requires more attention in the future.
Conclusions
Significant differences were observed in the spatial distribution of landscape recreation sustainability and eco-conservation sustainability in the Nanguo Peach Garden, and their interaction demonstrated an overall inverse relationship with a certain degree of convergence. In general, regions with a “good” rating for eco-conservation sustainability had a “poor” rating for landscape recreation sustainability, indicating the existence of a mutually constraining relationship between the two aspects. However, a mutual relationship could also exist within regions that have a good balance of recreational services and sustainable eco-conservation, as observed in the peach garden in the southwestern section of the study area. Hence, both landscape recreation sustainability and eco-conservation sustainability should be enhanced to effectively improve landscape health of urban forests and consequently achieve healthy development of urban forests. Scientific planning and arrangement, clear functional orientation, and appropriate management measures could contribute to the enhancement of both landscape recreation and eco-conservation sustainability of urban forests.
Close relationships existed between the landscape health and internal landscape factors of a forest. Within a certain range, a decrease in the forest/non-forest patch area ratio and an increase in the forest/ non-forest patch number ratio will improve forest landscape health. Thus, a balance between forest/non-forest landscape area and patch number is necessary to maintain the optimum landscape health in urban forests. The regions with better landscape health statuses were mostly concentrated in the transition zones between the forest and non-forest landscapes (e.g., public green spaces and forest edges), whereas regions with poorer landscape health were mostly natural forests of a single landscape type (e.g., internal regions of forests). Therefore, the landscape health status of urban forests was jointly influenced by the forest and non-forest landscapes within the region, which indicated that it is necessary to comprehensively consider areas and spatial structures of both types of landscape factors for planning and designing urban forest landscapes.
Acknowledgments
ZQ conceived and designed the experiments, analyzed the data, and wrote and revised the manuscript. THH performed the experiments. GCJ supervised the study and revised the manuscript. WYH operated the ArcGIS® 9.3 software and conducted the field experiments. All authors critically contributed to the manuscript and provided the final approval for publication.
We are grateful to all the participants who generously shared their opinions. We also thank Academician Shouzheng Tang from Chinese Academy of Engineering for his thorough, insightful, and affirmative comments. We are thankful to Editage (⇒ http://www.editage.cn/⇒ http://www.editage.cn/) for English language editing of the manuscript.
This study was supported by the Forestry Science and Technology Innovational Specific Project of Guangdong Province (grant no. 2017KJCX034) and the Special Fund for Forest Scientific Research in the Public Welfare (grant number no. 201404301).
References
Gscholar
Gscholar
Gscholar
Gscholar
Gscholar
Gscholar
Gscholar
Gscholar
Gscholar
Gscholar
Gscholar
Gscholar
Authors’ Info
Authors’ Affiliation
Hong-Hui Tang
Chang-Jun Gao
Guangdong Provincial Key Laboratory of Silviculture Protection and Utilization, Guangdong Academy of Forestry, Guangzhou 510520 (P. R. China)
Lingnan Comprehensive Surveying and Designing Institute of Guangdong Province, Guangzhou 510663 (P. R. China)
Corresponding author
Paper Info
Citation
Zhao Q, Tang H-H, Gao C-J, Wei Y-H (2020). Evaluation of urban forest landscape health: a case study of the Nanguo Peach Garden, China. iForest 13: 175-184. - doi: 10.3832/ifor3206-013
Academic Editor
Raffaele Lafortezza
Paper history
Received: Jul 31, 2019
Accepted: Feb 13, 2020
First online: May 02, 2020
Publication Date: Jun 30, 2020
Publication Time: 2.63 months
Copyright Information
© SISEF - The Italian Society of Silviculture and Forest Ecology 2020
Open Access
This article is distributed under the terms of the Creative Commons Attribution-Non Commercial 4.0 International (https://creativecommons.org/licenses/by-nc/4.0/), which permits unrestricted use, distribution, and reproduction in any medium, provided you give appropriate credit to the original author(s) and the source, provide a link to the Creative Commons license, and indicate if changes were made.

Web Metrics
Breakdown by View Type
Article Usage
Total Article Views: 31496
(from publication date up to now)
Breakdown by View Type
HTML Page Views: 26186
Abstract Page Views: 2539
PDF Downloads: 2283
Citation/Reference Downloads: 0
XML Downloads: 488
Web Metrics
Days since publication: 1454
Overall contacts: 31496
Avg. contacts per week: 151.63
Article Citations
Article citations are based on data periodically collected from the Clarivate Web of Science web site
(last update: Feb 2023)
Total number of cites (since 2020): 3
Average cites per year: 0.75
Publication Metrics
by Dimensions ©
Articles citing this article
List of the papers citing this article based on CrossRef Cited-by.
Related Contents
iForest Similar Articles
Research Articles
How do urban dwellers react to potential landscape changes in recreation areas? A case study with particular focus on the introduction of dendromass in the Hamburg Metropolitan Region
vol. 7, pp. 423-433 (online: 19 May 2014)
Research Articles
The concept of green infrastructure and urban landscape planning: a challenge for urban forestry planning in Belgrade, Serbia
vol. 11, pp. 491-498 (online: 18 July 2018)
Research Articles
The willingness of inhabitants in medium-sized city and the city’s surroundings settlements to pay for recreation in urban forests in Poland
vol. 14, pp. 483-489 (online: 27 October 2021)
Research Articles
Fragmentation of Araucaria araucana forests in Chile: quantification and correlation with structural variables
vol. 9, pp. 244-252 (online: 28 August 2015)
Research Articles
Scale dependency of the effects of landscape structure and stand age on species richness and aboveground biomass of tropical dry forests
vol. 16, pp. 234-242 (online: 23 August 2023)
Research Articles
Communicating spatial planning decisions at the landscape and farm level with landscape visualization
vol. 7, pp. 434-442 (online: 19 May 2014)
Short Communications
The Polish landscape changing due to forest policy and forest management
vol. 2, pp. 140-142 (online: 30 July 2009)
Review Papers
Green Infrastructure as a tool to support spatial planning in European urban regions
vol. 6, pp. 102-108 (online: 05 March 2013)
Review Papers
Large-scale effects of forest management in Mediterranean landscapes of Europe
vol. 6, pp. 342-346 (online: 29 August 2013)
Editorials
Adaptation of forest landscape to environmental changes
vol. 2, pp. 127 (online: 30 July 2009)
iForest Database Search
Search By Author
Search By Keyword
Google Scholar Search
Citing Articles
Search By Author
Search By Keywords
PubMed Search
Search By Author
Search By Keyword


