Equations for estimating belowground biomass of Silver Birch, Oak and Scots Pine in Germany
iForest - Biogeosciences and Forestry, Volume 12, Issue 2, Pages 166-172 (2019)
doi: https://doi.org/10.3832/ifor2862-012
Published: Mar 15, 2019 - Copyright © 2019 SISEF
Research Articles
Abstract
In this study we derived allometric functions for estimating the belowground biomass (BGB) of Silver Birch (Betula pendula Roth), Pedunculate Oak (Quercus robur L.), Sessile Oak (Quercus petraea (Matt.) Liebl.) and Scots Pine (Pinus sylvestris L.) in Germany. To assess the impact on German greenhouse gas (GHG) reporting, these new functions were further compared with BGB functions currently used in France and Sweden. For developing new BGB functions 48 Silver Birches, 39 Pedunculate and Sessile Oaks and 54 Scots Pines were destructively sampled. The sampled trees spanned a DBH range from 8.2 to 52.9 cm for Silver Birch, from 7.4 to 42.0 cm for Oak and from 7.2 to 53.2 cm for Scots Pine. After fitting the data, the following values of model efficiency were achieved: 0.81 for Silver Birch, 0.98 for Oak and 0.95 for Scots Pine. The model root mean square error varies between 5.2 kg for Oak, 13.7 kg for Scots pine and 26.9 kg for Silver Birch. Comparison with the currently applied BGB functions in the German GHG inventory from France and Sweden showed that the use of these functions results in systematically different estimates for the BGB of Silver Birch and Oak. Thus, our findings indicate that BGB functions recommended for other European countries (in particular France and Sweden) are not appropriate for estimating the BGB for the tree species concerned in Germany. Currently, the derived data-set for BGB of Silver Birch, Oak and Scots Pine is the largest in Germany and the developed functions are thus the best available for estimating national BGB stock and stock change in Germany at the moment.
Keywords
Belowground Biomass, Allometric Equations, National Greenhouse Gas Inventory, Betula pendula, Quercus robur, Quercus petraea, Pinus sylvestris
Introduction
Forests contain about 90 % of the carbon stored in the terrestrial vegetation and account for 40 % of the carbon exchange between the atmosphere and the terrestrial biome ([10]). Exact and accurate determination of the amount of carbon stored in forest ecosystems and its changes is of gradually increasing importance for understanding the effects on the global carbon cycle, in particular CO2 emissions ([10]). Monitoring carbon of forest ecosystems is also an obligation brought by the United Nations Framework Convention on Climate Change (UNFCCC) and the Kyoto Protocol ([6], [10]), which aim at stabilizing the global greenhouse gas (GHG) concentration in the atmosphere at a level that would prevent dangerous human-induced interference with the climate system. Based on that reasoning, a system for the transparent reporting of anthropogenic GHG emissions and removals was created, which follows a specific reporting guideline framework elaborated by the Intergovernmental Panel on Climate Change ([12], [13], [14]). All parties that signed the UNFCCC are under obligation of preparing, publishing and periodically updating the national inventories by using comparable methods for emissions and removals of GHG from land use, land use change and forestry (LULUCF).
Obtaining accurate national estimates of belowground tree biomass may increase the accuracy of the GHG inventory reporting ([12]). Belowground biomass (BGB) estimates for National GHG Inventory purposes are currently most widely obtained from published root-to-shoot ratios, which have been shown to be globally stable across latitudes and a wide range of environmental conditions, but are not available for several important biomes and may lead to inaccurate estimates in some vegetation types ([26]). Generally, the most accurate way to estimate BGB is the application of species-specific allometric functions with predictors such as diameter at breast height (DBH) and tree height. However, the difficult and time-consuming extraction of roots is often limiting the availability of such models ([26]).
A literature review on the biomass of Silver Birch (Betula pendula Roth), Pedunculate Oak (Quercus robur L.), Sessile Oak (Quercus petraea (Matt.) Liebl.) and Scots Pine (Pinus sylvestris L.) reveals that previous studies focused mainly on the aboveground biomass. Only a few authors have published functions that allow the estimation of the biomass of belowground components for Birch ([22], [16], [24], [27], [25], [2], [29], [20]), Oak ([7], [8]) and Pine ([15], [21], [10], [20]). For the German main tree species European Beech, Norway Spruce and Scots Pine, country-specific methods and equations for BGB assessment are already implemented in the German GHG reporting. For Scots Pine Neubauer et al. ([21]) developed an equation for the BGB, while the equations from Bolte et al. ([5]) are used for European Beech and Norway Spruce. So far, there have been no studies on carbon storage in tree roots of Silver Birch, Pedunculate Oak and Sessile Oak forests growing in Germany. Therefore, the national GHG monitoring system in Germany hitherto has to rely on data from other countries, which are taken from literature.
The objectives of this study were to: (1) derive allometric BGB functions for Silver Birch, Pedunculate Oak and Sessile Oak in Germany; (2) improve the existing BGB function for Scots Pine in Germany ([21]) with new data; and (3) compare these new functions with the BGB functions currently used in the German GHG inventory.
Material and methods
Study sites
Germany has approximately 11 million hectares of forests, 25% of which are Spruce, 22% Pine, 15% Beech, 10% Oak and 5% Birch. The majority of the Pine stands (about 67%) and Birch stands (about 61%) are located in the Northern lowlands and in the hills. Oak stands also have a spatial focus here with about 36% of all German Oak stands (⇒ https://bwi.info/). Therefore, study sites in this area were selected together with the local forest administrations, focusing on typical site conditions, tree species composition and age. The aim was to sample a wide range of ages and diameters. All study sites had to be situated in high forests, which is characterized by continuous cover forestry with selective cuttings and a focus on natural regeneration.
Between 2012 and 2016, 48 Birches, 39 Oaks and 54 Pines were sampled in 20 forest stands distributed across 4 different regions in 3 federal states of Germany (Fig. S1, Tab. S1 in Supplementary Material). Köstler et al. ([18]) described the root architecture of Pedunculate Oak as being similar to that of Sessile Oak, therefore Pedunculate Oak and Sessile Oak were considered together in further assessments. The age of the trees varied from 15 to 220 years for Pine, from 40 to 120 years for Birch and from 30 to 120 years for Oak. The diameter at breast height (DBH) ranged from 7.2 up to 53.2 cm for Pine, from 7.4 to 42.0 cm for Oak and from 8.2 to 52.9 cm for Birch (Tab. S1 in Supplementary Material).
Within the federal state of Brandenburg two research areas were selected (Tab. S1 in Supplementary material). The first study area is located in the foresty district Chorin, division Spechthausen, with an altitude ranging from 50 to 80 m a.s.l., while the second is located in the foresty district Steinföde, division Seilerhof, with an altitude of approximately 55 m a.s.l. In Spechthausen the average annual air temperature is 8.4 °C with a mean annual precipitation of 572 mm. The soils of all stands within this study area are moderately fresh with a low to medium nutrient availability. Depending on the nutrient availability, the potential natural vegetation is divided into the woodruff-beech forest (Galio-Fagetum) or the woodrush-beech forest (Luzulo-Fagetum). The annual air temperature in Seilerhof is 8.5 °C and the mean annual precipitation is 572 mm. The soils are classified as fresh with good nutrient availability. The potential natural vegetation is the woodruff-beech forest (Galio-Fagetum).
The third research area is located in the foresty district Annaburg, division Eichenheide, near the town Annaburg (elevation: 75 m a.s.l.) in the federal state of Saxony-Anhalt. Here, the average annual air temperature is 9.2 °C and the mean annual precipitation is 555 mm. The soils are classified as fresh with moderate nutrient availability. The potential natural vegetation is a birch-common oak forest (Betulo-Quercetum roboris).
The fourth research area is located in the federal state of Thuringia, in the forestry district Jena-Holzland, division Waldeck, which is close to the town of Bad Klosterlausnitz (elevation: 310 m a.s.l.). Here, the average annual air temperature is 7.9 °C with a mean annual precipitation of 615 mm. The soils are fresh and changing fresh with moderate nutrient availability. The potential natural vegetation is the woodrush-beech forest (Luzulo-Fagetum).
Definition of roots
BGB comprises all biomass of living roots referring to the IPCC guidelines ([12]). All roots with a diameter of 2 mm or more are regarded as coarse roots ([12]) and are subject of this investigation. Fine roots of less than 2 mm diameter are often excluded as these often cannot be distinguished empirically from soil organic matter or litter ([12]). Moreover, fine roots only represent a very small percentage of the total biomass ([28]). The total stock of the fine roots, as well as their live/dead biomass-ratio is subject to seasonal variations ([11]). In this study the root system was divided into belowground stump, main- or taproot, secondary roots and secondary taproots (see Fig. S2 in Supplementary Material).
Sample selection and root excavation
The sample trees were selected according to the following criteria: (1) tree social class 1 to 3 (predominant, dominant, co-dominant) after Kraft ([19]); (2) a straight tree trunk; and (3) no tree damages, such as crown breakage or bark injuries. Border trees, as well as trees too close to each other, were not taken into account within this study. In order to fulfill the technical requirements for pulling down a tree, a sample tree also had to meet the following conditions: (i) two anchor trees for attaching the hand winch and the wire cable; and (ii) availability of an appropriate falling gap.
The entire coarse root system of the sample trees had to be surveyed in order to determine the BGB. This requires the extraction of the roots. Different methods, such as excavating, exposing or pulling out the root system can be adopted ([4]). Exposing roots by compressed air or by water in the field requires a high technical and logistical effort ([3]), which is why those methods were not considered. Instead the root system was pulled out, but not after felling the tree, as done in many other studies. Entire trees were pulled down using a hand winch ([18]) utilizing the leverage effect, thus resulting in a fast and cost-efficient procedure for root extraction.
After selecting a sample tree, basic tree variables such as DBH and species were recorded. In order to reduce the effort for pulling down the tree and to avoid the tearing of smaller roots the upper parts of the roots, especially secondary roots, were excavated by spades beginning at the belowground stump. The hand winch (pulling force 3.2 t) was mounted on a neighboring tree. A deflection pulley with a polyester-round sling (3 m, 4 t pulling force) was mounted at a height of at least 2 meters on the sample tree to achieve sufficient pulling force. The end of the pulling cable was mounted on a second anchor tree using a shackle and a round sling (see Fig. S3 in Supplementary Material). The setup of this procedure nearly doubles the pulling force of the hand winch. With the help of the hand winch the tree was pulled into a diagonal position until it fell down due to its own weight, uprooting itself. Then the root was separated from the stem with a chainsaw at a previously marked position. Roots that have been broken or remained in the soil were excavated separately and pulled out manually (Fig. S4 in Supplementary Material).
Determination of belowground biomass
After extraction of the root system, rocks and dirt were removed with hand tools, such as spades and scrapes. The total length and the longitudinal distribution of the coarse roots were measured and the weight (i.e., fresh mass - FM) were determined. For this purpose, a combination of an aluminum tripod, a pulley and an electronic scale were used.
In the next step, samples were taken from the different parts of the root system. Provided that all classes were present, three samples from each class were taken to cover a thin, medium and thick diameter range (see Fig. S2 in Supplementary material). Here, the diameter range of each class was depending on the individual root system size. Consequently, the average diameters of the samples from large roots systems were larger than from small roots systems.
In the laboratory, the samples were weighed to determine their fresh mass (FMs), then dried in a forced-air oven at 85 °C for four days until their weights remain constant, and weighed again for determining the dry mass (DMs).
The total root system dry mass (DMt) of a sample tree was calculated by using the following equation (eqn. 1):
where FMt is the fresh mass of the total root system of a given sample tree and WCs is the water content, which was determined as follows (eqn. 2):
Here WMt is the average water mass of the individual samples from one root system (WMs), calculated as (eqn. 3):
Model fitting
Direct measurements of tree biomass and its components (usually expressed as dry weight of the stem, crown, stump or roots) are labour intensive, time-consuming and expansive. Therefore, allometric equations are developed to determine biomass as a function of easily measurable tree variables, such as DBH or height. The mathematical model most commonly used for biomass prediction is the power function y = β1 · x β2.
As an alternative to fitting a linear model to log-transformed measurements, we used the weighted nonlinear least squares regression (nls), as implemented by the “stats” package of the statistical software R ([23]) to fit power function to the data and obtain estimates for the coefficients β1 and β2 (eqn. 4):
where BGB is the belowground biomass (i.e., DMt) of the individual tree, DBH is the diameter at breast height and β1 and β2 are the scaling coefficients.
The heteroscedasticity of the data made a weighted analysis necessary, to achieve minimum variance parameter estimates ([1]). Data were weighted by 1/DBH2 to correct for non-random residuals and the tendency of over-predicting BGB of small trees.
The goodness-of-fit of the applied power function was evaluated using the root mean square error (RMSE) and the model efficiency coefficient (ME) calculated as follows (eqn. 5):
and (eqn. 6):
where n is the total number of observations, yi is the observed value for observation i, hat{y} is the according predicted value, and bar{y} = (1/n) · Σ yi (i = 1, …, n).
Results
For Birch and Pine our observations cover a fair range of tree size (see Tab. S1 in Supplementary Material). When expressed in terms of DBH, the range was approximately from 8 to 50 cm, corresponding to BGB values between approximately 8 and 350 kg (Fig. 1). The diameter range is in agreement with the silvicultural treatment for that species in Germany, where target diameters of up to 50 cm are used in selective thinnings. For Oaks the observed DBH range was considerably lower with values between 7 and 40 cm, thereby leading to smaller BGB values of up to 160 kg (Fig. 1).
Fig. 1 - Belowground biomass in relation to diameter at breast height (DBH) for Pine, Oak and Birch.
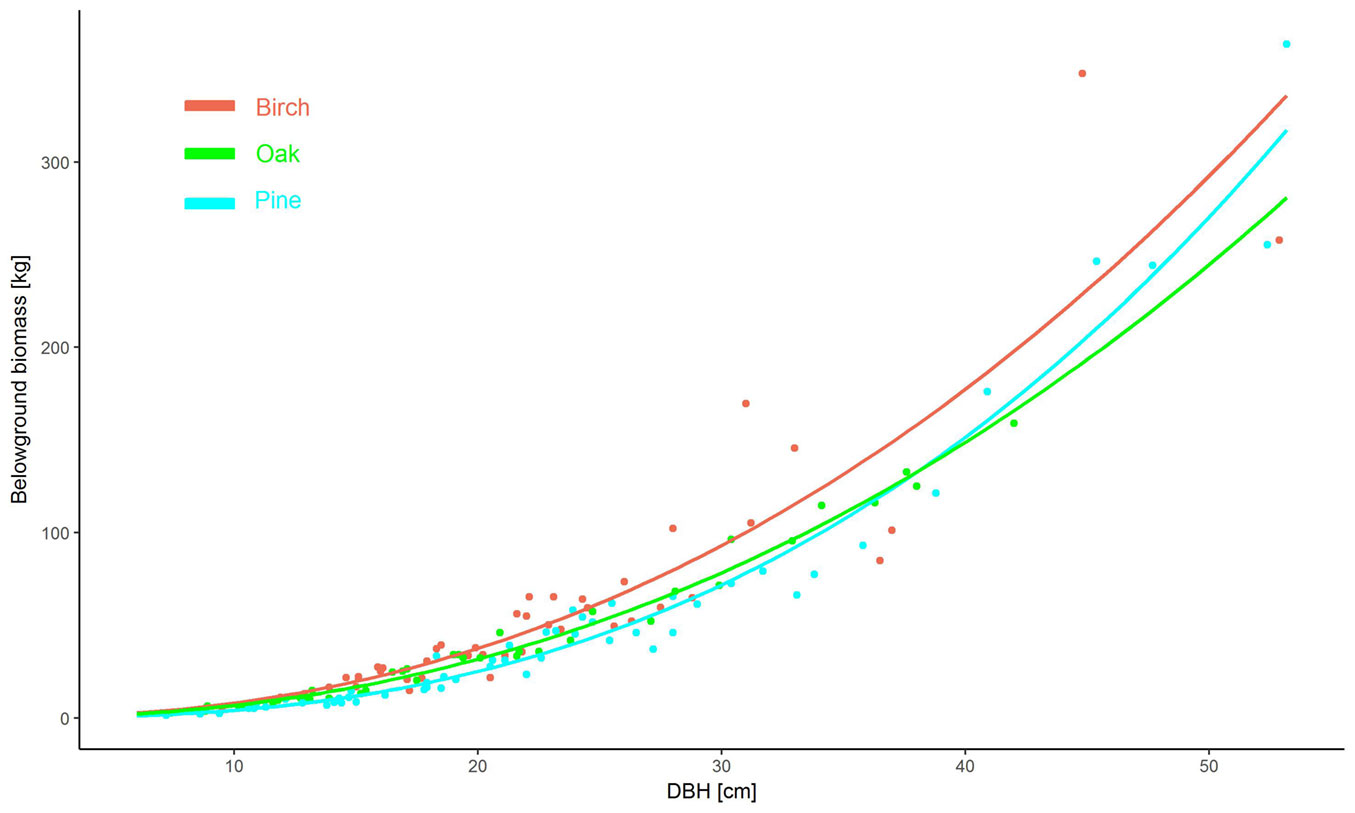
Individuals of Pine and Oak trees were more evenly distributed over the whole range of DBH than the sampled Birch trees, due to a lack of specimen suitable for harvest. For Birch we have no observations of BGB within the range from 200 to 300 kg.
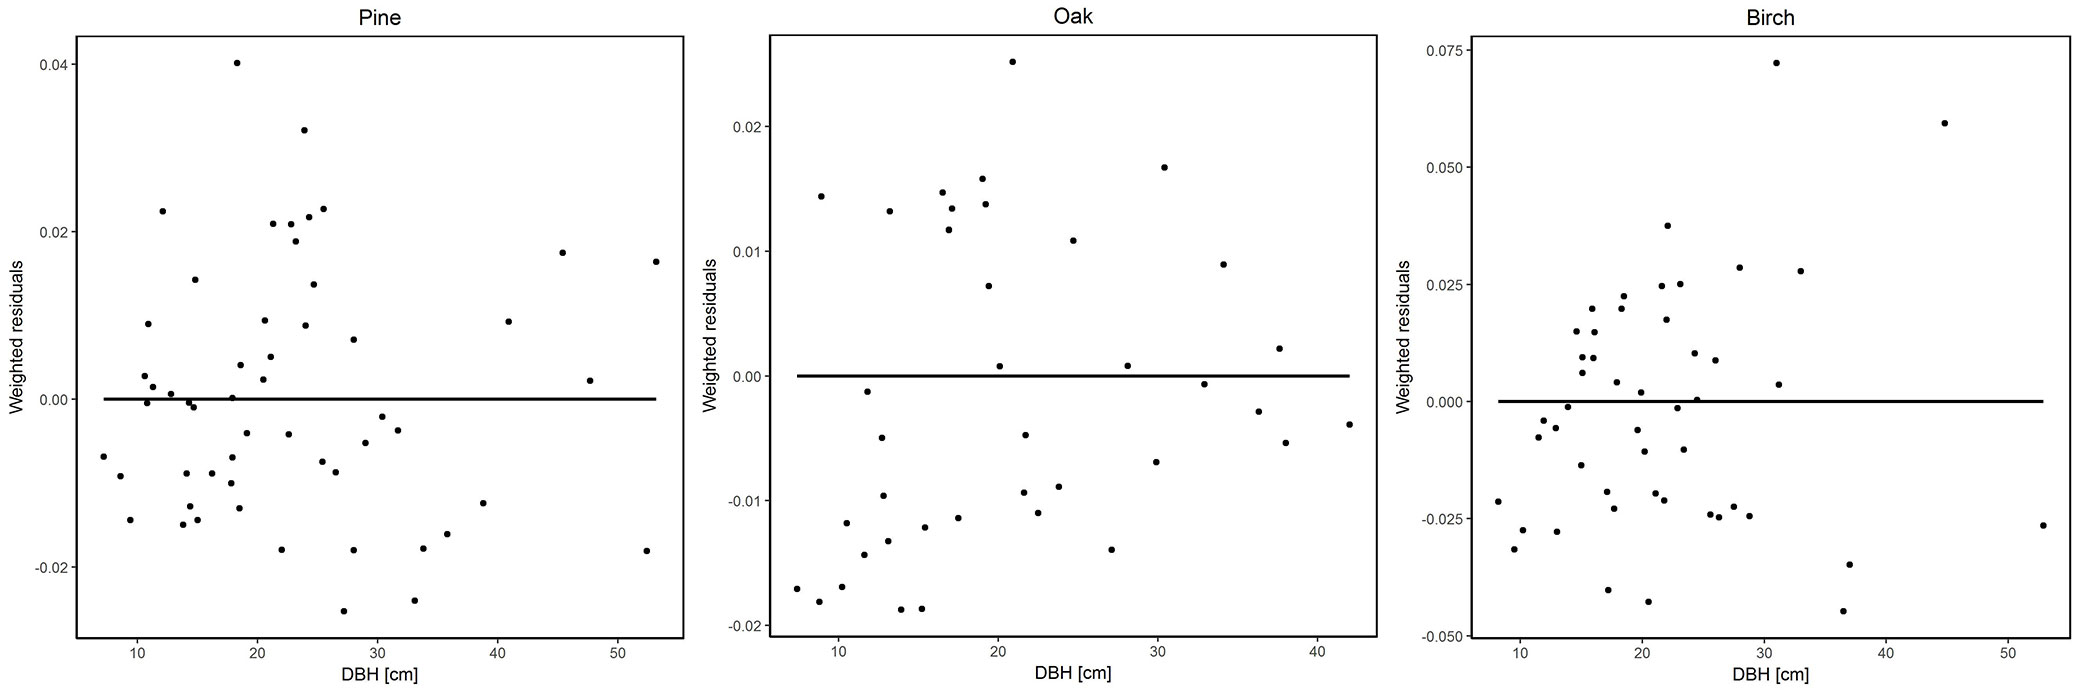
Predicting BGB using DBH, ME values of 0.81 for Birch, 0.98 for Oak and 0.95 for Pine were achieved, indicating good fits to the observed values. All parameters are significant as shown by their narrow confidence intervals (Tab. 1). The plots of predicted vs. observed values of BGB showed no sign of a general lack-of-fit of the fitted models within the data range (Fig. 2). The observed values were evenly distributed around the 1:1 line. Residual analysis (Fig. 3, Fig. 4) revealed that the weighted least-squares regression removed any heteroscedasticity in the data and thus any negative effects on parameter estimation.
Tab. 1 - Estimated coefficients for dry mass estimations of Birch, Oak and Pine roots. (CI): confidence interval; (ME): model efficiency coefficient; (RMSE): root mean square error.
| Tree species |
Coefficient | Coefficient estimates |
CI | ME | RMSE |
|---|---|---|---|---|---|
| Birch |
β
1
|
0.04582 | 0.0092-0.0824 | 0.81 | 26.9 |
β
2
|
2.23951 | 2.0047-2.4742 | |||
| Oak |
β
1
|
0.040113 | 0.0253-0.0548 | 0.98 | 5.2 |
β
2
|
2.227842 | 2.1179-2.3377 | |||
| Pine |
β
1
|
0.010617 | 0.0053-0.0159 | 0.95 | 13.7 |
β
2
|
2.593122 | 2.4549-2.7312 |
Fig. 2 - Observed and predicted values for belowground biomass of Pine, Oak and Birch.
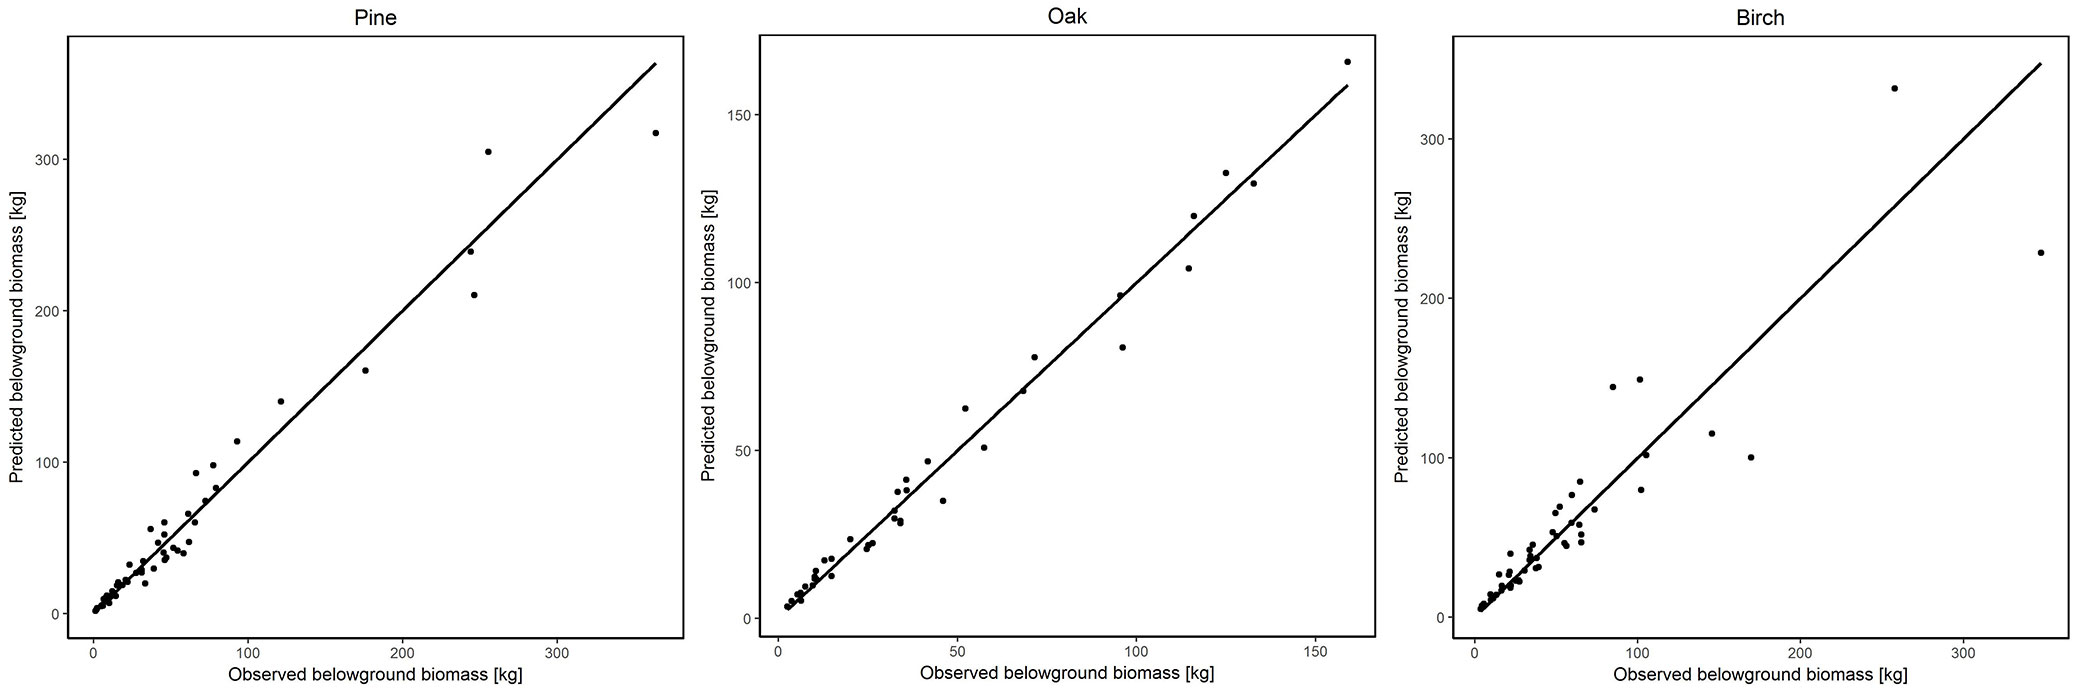
Fig. 3 - Weighted residuals versus predicted belowground biomass of Pine, Oak and Birch.
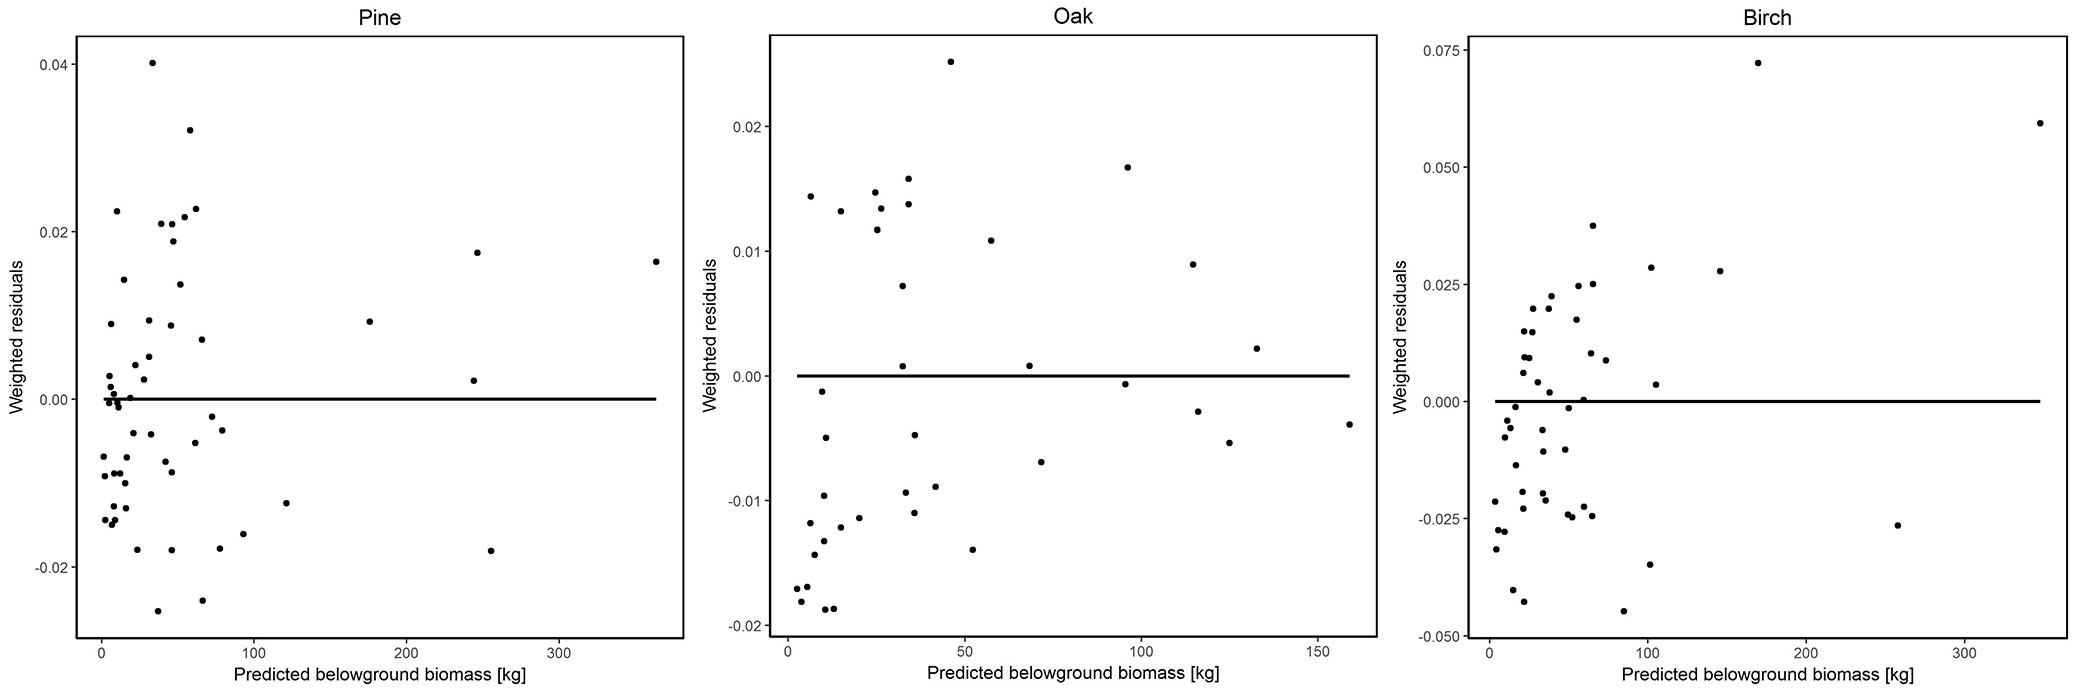
Fig. 4 - Weighted residuals versus DBH of Pine, Oak and Birch.
The predictions from the new functions were compared with the BGB functions currently used in the German GHG inventory (Tab. 2). Here, in particular the functions by Johansson & Hjelm ([17]) for soft hardwoods (i.e., Silver Birch), by Drexhage & Colin ([7]) for Oak and by Neubauer et al. ([21]) for Pine were used for the comparison.
Tab. 2 - Functions and coefficients for calculating belowground biomass within the German greenhouse gas inventory ([9]). (RMSE): root mean square error; (DBH): diameter at breast height. (*): For these function, no figure for RMSE [%] is available. Therefore, the IPCC default value of 50 % has been used. (**): The mean RMSE [%] for both functions (root biomass + root-stump biomass) is 24.2%. (+): in kg.
| Tree species | b0 | Parameter | b1 | RMSE [%] | Region | Source |
|---|---|---|---|---|---|---|
| Spruce | 0.003720 | DBH [cm] | 2.792465 | 34.6 | Solling | Bolte et al. ([5]) |
| Pine | 0.006089 | DBH [cm] | 2.739073 | 26.3 | Barnim | Neubauer et al. ([21]) |
| Beech | 0.018256 | DBH [cm] | 2.321997 | 49.0 | Solling | Bolte et al. ([5]) |
| Oak | 0.028000 | DBH [cm] | 2.440000 | 50.0* | Northeast France | Drexhage & Colin ([7]) |
| Soft Hardwoods** (root biomass) | 0.000010 | DBH [mm] | 2.529000 | 9.6+ | South Sweden | Johansson & Hjelm ([17]) |
| Soft Hardwoods** (root-stump biomass) | 0.000116 | DBH [mm] | 2.290300 | 15.9+ | South Sweden | Johansson & Hjelm ([17]) |
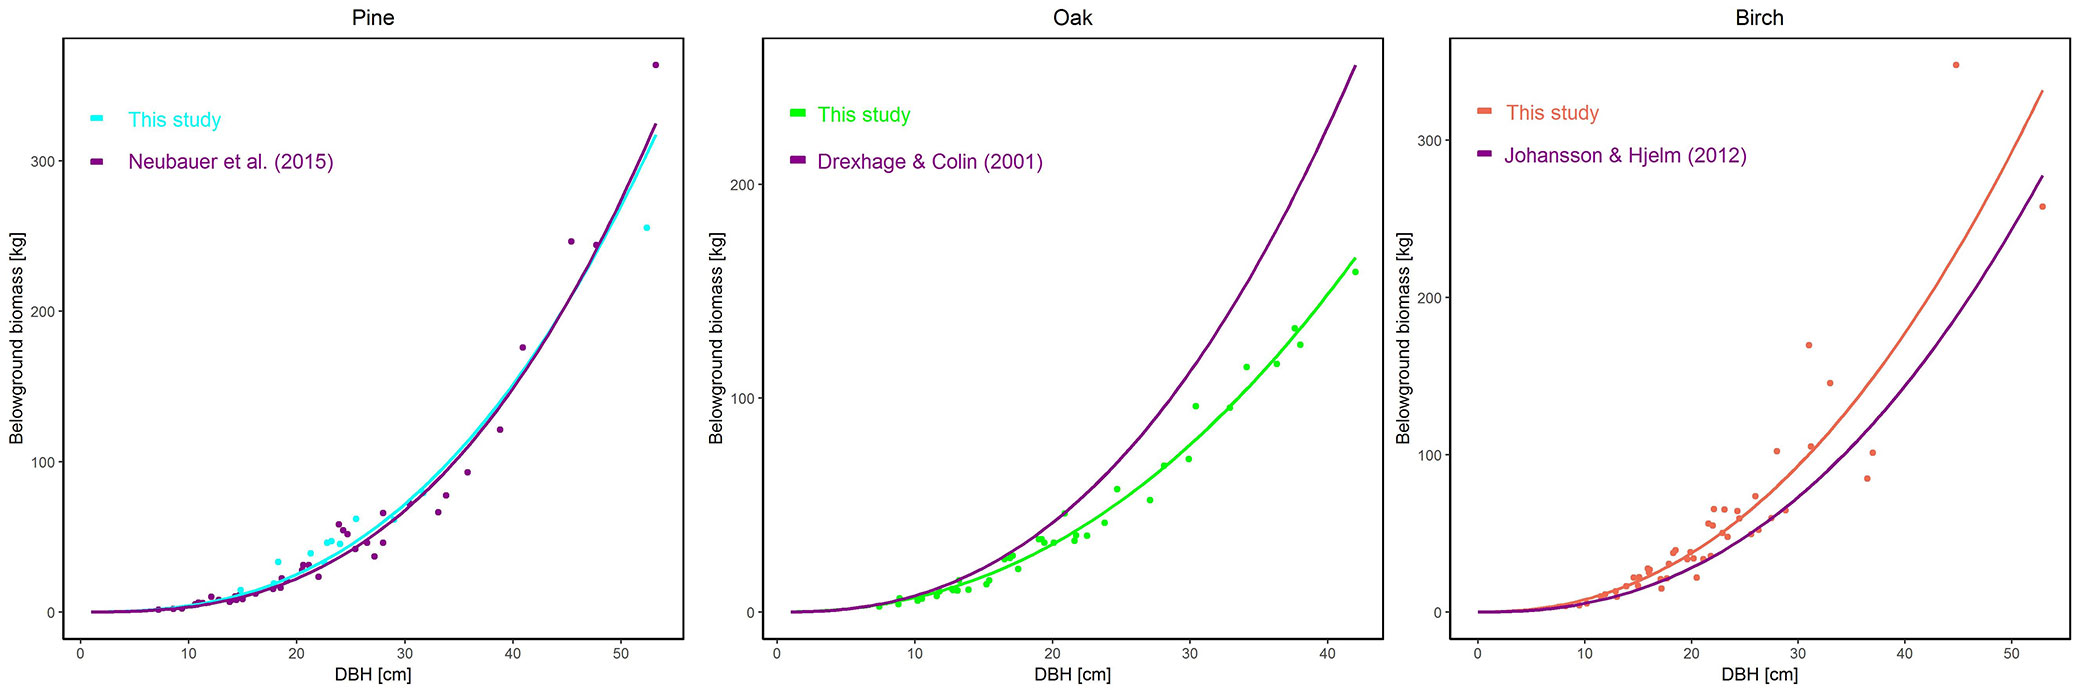
With our functions as reference, the results show that the application of the BGB function of Johansson & Hjelm ([17]) leads to an explicit lower estimation of BGB (Fig. 5), which means that its application to the sample trees of our study would systematically underestimate BGB. However, the Oak function by Drexhage & Colin ([7]) applied to our sample trees would overestimate the BGBs (Fig. 5) because the function delivers systematically higher estimates. For Pine the two compared functions resulted in similar values (Fig. 5). Here it should be noted that in the latter case the methodology is the same, but only the number of trees used for parametrization was extended from 43 to 54 ([21]).
Fig. 5 - Comparison of belowground biomass functions for determining belowground biomass of Pine, Oak and Birch.
Discussion
The study derived tree individual allometric functions estimating BGB of Birch, Oak and Pine, with DBH as predictor variable (Fig. 1). Model fit statistics indicated a good fit of the implemented functions to the observed data (Tab. 1). This indicates that the type of function selected is suitable to calculate BGB and DBH is a good predictor for BGB. This is even more important as DBH is easy to measure and therefore available in many datasets (e.g., forest inventories).
The comparison of the predicted BGB values indicated that the values of Birch and Oak calculated with the functions of Johansson & Hjelm ([17]) and Drexhage & Colin ([7]) are considerably different to the BGB values derived from functions obtained in this study (Fig. 5).
In the case of the function of Drexhage & Colin ([7]) the predicted BGB resulted in higher estimates compared to the BGB determined by the function applied in this study (Fig. 5). In our study BGB of Oak was determined based on the data from 39 trees with DBH of 7.4-42.0 cm and age of 30-120 years (Tab. S1 in Supplementary Material). However, Drexhage & Colin ([7]) used data from 71 trees located in two naturally regenerated stands in north-eastern France. Here, the range of DBH (7.0-17.0 cm) and age (20-28 years) of the sampled trees were smaller than in our study. When looking at the overlapping part of the samples used with regard to DBH it is obvious that also there the function of Drexhage & Colin ([7]) delivers higher estimates. This might be explained by the fact, that the sampled Oak stands represent different climatic and soil conditions within the respective countries, which can result in different DBH dimensions at the same age. A comparison of the functions regarding higher diameters cannot be applied as the sample of Drexhage & Colin ([7]) contains no trees above 17.0 cm. The function might not be recommendable for application to tree sizes outside this range. As the sample of our study contains trees of a much wider diameter range, it better reflects the overall range of diameters found in many forests and therefore might be preferable for use at least in many parts of Germany, where site conditions are comparable to the sampled stands.
The BGB values obtained from the function of Johansson & Hjelm ([17]) compared to the values calculated with the derived function for Birch in our study resulted in lower BGB values (Fig. 5). Johansson & Hjelm ([17]) comprised 72 trees from six Poplar stands growing on former farmland in Sweden. The age of the sampled trees varied between 16 and 23 years and the DBH ranged between 8.1 and 57.4 cm. On the other hand, in our study we used data from 48 Birch trees of age 40 to 120 years. The DBH ranged between 8.2 and 52.9 cm and are approximately in the same range of DBH of the sampled Poplar trees in the study of Johansson & Hjelm ([17]). Here, for example, the reason for the different BGB values might be explained due to the higher age of the sampled Birch trees in comparison to the Poplar trees sampled by Johansson & Hjelm ([17]). Additional factors are very different climatic and site conditions and the different species. As the Poplar trees sampled by Johansson & Hjelm ([17]) were growing on former farmland, which usually represent sites with better nutrient supply, our Birches represent average Birch sites in German forests, which have much lower nutrient supply than agricultural land and even than average forests. This might lead to an intensified growth of the root system of these Birches in order to assure sufficient access to nutrients. However, as Birches are much more prevalent in German forests than Poplar and the sample of this study better represents the conditions of German forests, the function derived here is more suitable for the application in the context of the German GHG inventory for the whole group of soft hardwoods. Finally, the predicted BGB of Pine based on the function determined in this study give similar values (Fig. 5) compared to the function of Neubauer et al. ([21]). As mentioned above, the applied methodology is the same, but the number of trees used in this study for parametrization was extended from 43 to 54. Thus, the application of the adapted function of Pine is recommended for calculating the BGB within the German GHG inventory.
BGB is difficult and expensive to determine and therefore many of the available datasets are relatively small and large diameters are not well represented ([26]). Our BGB functions are based on 48 Birches, 39 Oaks and 54 Pines with a DBH ranging from 8.2 to 52.9 cm, 7.4 to 42.0 cm and 7.2 to 53.2 cm, respectively. Currently, this study includes the largest sampled ranges of DBH for Birch, Oak and Pine in Germany. The sampled stand and site conditions of the derived functions are representative for a large part of the conditions in which Birch, Oak and Pine occurs in Germany.
Conclusions
The developed biomass functions currently represent the largest dataset for BGB of Birch, Oak and Pine in Germany with a wide range of tree sizes and site conditions. Thus, the derived BGB functions for Birch, Oak and Pine are the best available for estimating BGB stock and stock change in Germany at the moment. Therefore, the applied BGB functions of Birch and Oak should be integrated in the German GHG inventory to replace the previously used BGB functions which represent BGB values calculated for stand and sites conditions that are not representative for the growth conditions of Birch and Oak in Germany. This would further improve the quality of the data reported, which is in line with the obligations of the country as set out in the international rules on national GHG inventory preparation, i.e., under the UNFCCC. The biomass functions presented may also be used for neighboring countries, provided that site conditions and diameter distribution for the species concerned are comparable.
Acknowledgements
This research was funded by the Waldklimafonds (project number: 28WB4034). The authors gratefully acknowledge the helpful feedback from Dr. Sebastian Schnell, Dr. Steffen Herrmann and Stuart Krause on the draft manuscript. We would also like to thank the anonymous reviewers for their time and comments.
References
CrossRef | Gscholar
Gscholar
Gscholar
Gscholar
Gscholar
Gscholar
Gscholar
Gscholar
Gscholar
Gscholar
CrossRef | Gscholar
Authors’ Info
Authors’ Affiliation
Karsten Dunger
Katja Oehmichen
Thomas Riedel
Wolfgang Stümer
Thünen Institute of Forest Ecosystems, Alfred-Möller-Straße 1, 16225 Eberswalde (Germany)
Mirko Neubauer
Eberswalde University of Sustainable Development, Alfred-Möller-Straße 1, 16225 Eberswalde (Germany)
Corresponding author
Paper Info
Citation
Röhling S, Demant B, Dunger K, Neubauer M, Oehmichen K, Riedel T, Stümer W (2019). Equations for estimating belowground biomass of Silver Birch, Oak and Scots Pine in Germany. iForest 12: 166-172. - doi: 10.3832/ifor2862-012
Academic Editor
Gianfranco Minotta
Paper history
Received: May 23, 2018
Accepted: Feb 06, 2019
First online: Mar 15, 2019
Publication Date: Apr 30, 2019
Publication Time: 1.23 months
Copyright Information
© SISEF - The Italian Society of Silviculture and Forest Ecology 2019
Open Access
This article is distributed under the terms of the Creative Commons Attribution-Non Commercial 4.0 International (https://creativecommons.org/licenses/by-nc/4.0/), which permits unrestricted use, distribution, and reproduction in any medium, provided you give appropriate credit to the original author(s) and the source, provide a link to the Creative Commons license, and indicate if changes were made.

Web Metrics
Breakdown by View Type
Article Usage
Total Article Views: 34269
(from publication date up to now)
Breakdown by View Type
HTML Page Views: 28048
Abstract Page Views: 2605
PDF Downloads: 3003
Citation/Reference Downloads: 9
XML Downloads: 604
Web Metrics
Days since publication: 1862
Overall contacts: 34269
Avg. contacts per week: 128.83
Article Citations
Article citations are based on data periodically collected from the Clarivate Web of Science web site
(last update: Feb 2023)
Total number of cites (since 2019): 5
Average cites per year: 1.00
Publication Metrics
by Dimensions ©
Articles citing this article
List of the papers citing this article based on CrossRef Cited-by.
Related Contents
iForest Similar Articles
Research Articles
Allometric relationships for volume and biomass for stone pine (Pinus pinea L.) in Italian coastal stands
vol. 6, pp. 331-335 (online: 29 August 2013)
Research Articles
Geographic determinants of spatial patterns of Quercus robur forest stands in Latvia: biophysical conditions and past management
vol. 12, pp. 349-356 (online: 05 July 2019)
Research Articles
Allometric equations to assess biomass, carbon and nitrogen content of black pine and red pine trees in southern Korea
vol. 10, pp. 483-490 (online: 12 April 2017)
Research Articles
Allometric equations to estimate above-ground biomass of small-diameter mixed tree species in secondary tropical forests
vol. 13, pp. 165-174 (online: 02 May 2020)
Research Articles
Effects of planting density on the distribution of biomass in a douglas-fir plantation in southern Italy
vol. 8, pp. 368-376 (online: 09 September 2014)
Research Articles
Belowground biomass models for young oligotrophic Scots pine stands in Latvia
vol. 11, pp. 206-211 (online: 01 March 2018)
Technical Reports
Allometric biomass and carbon factors database
vol. 1, pp. 107-113 (online: 09 July 2008)
Research Articles
Allometric models for estimating biomass, carbon and nutrient stock in the Sal zone of Bangladesh
vol. 12, pp. 69-75 (online: 24 January 2019)
Review Papers
Integration of forest mapping and inventory to support forest management
vol. 3, pp. 59-64 (online: 17 May 2010)
Research Articles
Estimation of forest biomass components using airborne LiDAR and multispectral sensors
vol. 12, pp. 207-213 (online: 25 April 2019)
iForest Database Search
Google Scholar Search
Citing Articles
Search By Author
Search By Keywords
PubMed Search
Search By Author
Search By Keyword


