Is methane released from the forest canopy?
iForest - Biogeosciences and Forestry, Volume 4, Issue 5, Pages 200-204 (2011)
doi: https://doi.org/10.3832/ifor0591-004
Published: Nov 03, 2011 - Copyright © 2011 SISEF
Research Articles
Collection/Special Issue: COST Action FP0903 (2010) - Rome (Italy)
Research, monitoring and modelling in the study of climate change and air pollution impacts on forest ecosystems
Guest Editors: E Paoletti, J-P Tuovinen, N Clarke, G Matteucci, R Matyssek, G Wieser, R Fischer, P Cudlin, N Potocic
Abstract
Laboratory experiments show that rates of CH4 emission from plant material depend exponentially on temperature and linearly on UV irradiance. The UV irradiance shall be spectrally weighted and shorter wavelengths results in higher CH4 emissions. Global upscaling models for estimating aerobic CH4, based on lab results, have be conducted with varying results, but until now field measurements based on profile and eddy covariance measurements have failed to show CH4 emissions from forest canopies. To detect CH4 production or consumption in the canopy of a beech stand we connected a CH4 analyzer to a canopy air profile system that samples air below and above the canopy from seven different heights. A profile system with many vertical sample points can detect gas concentration gradients with a high sensitivity only under conditions with no or little air movements. Under these conditions we found indications of periodic CH4 emissions in the canopy, but more data need to be analyzed before the magnitude of the canopy source of CH4 can be established.
Keywords
Introduction
Methane (CH4) is the second most important anthropogenic greenhouse gas, contributing about 30% to the total net anthropogenic radiative forcing of 1.6 W m-2 ([8]). The atmospheric concentration of methane has been increasing since the beginning of the industrial revolution ([7]) but the growth rate declined from 1983 until 1999, consistent with an approach to steady state. Superimposed on this decline is a significant interannual variability in growth rate ([5]). From 1999 to 2006, the CH4 concentration was about constant, but in 2007 to 2009, globally averaged CH4 increased again. Dlugokencky et al. ([6]) attribute the causes for the current increases to warm temperatures in the Arctic in 2007 and increased precipitation in the tropics in 2007 and 2008.
Most of the methane from natural sources in Earth’s atmosphere is thought to originate from biological processes in anoxic environments, but a large terrestrial source of CH4 was proposed by Keppler et al. ([9]) who observed emissions from vegetation foliage under aerobic experimental conditions. This newly discovered source was estimated to be between 10 and 30% of the total emissions with a significant temperature dependency ([9]). Aerobic CH4 emission from foliage has been confirmed by other groups in the laboratory, but with significantly lower CH4 emissions ([15], [10], [3], [16]). In general, rates of CH4 emission were found to depend exponentially on temperature and linearly on UV irradiance. The UV irradiance has to be spectrally weighted and shorter wavelengths results in higher CH4 emissions. ([15], [10], [3], [16]).
Studies show that pectin is an important precursor for CH4 production in leaves. A global upscaling model for estimating aerobic CH4 emissions, based on lab results and considering only pectin content as a driver has been conducted recently by Bloom et al. ([1]). Their estimate is one to two orders of magnitude lower than previous estimates of global foliar CH4 emissions by Keppler et al. ([9]). Recent studies have reported that pectin is not the only molecular source of UV-driven CH4 emissions and that other environmental stresses may also generate CH4 ([15]). Consequently, further evaluation of such mechanisms of CH4 generation is needed to confirm the contribution of foliage to the global CH4 budget ([1]). It is a giant leap, to scale up from simple lab experiments to the globe, and therefore there is a strong need for field measurements to consolidate the upscaling from the lab experiments.
Forest ecosystems are, in relation to area and biomass, the most significant biomes and consequently are data from forests very central in the understanding of aerobic CH4 emissions. A new and elegant way to show CH4 emissions in situ from forest trees could be by the aid of micrometeorological flux measurements. Until now, field measurements based on eddy covariance have failed to show CH4 emissions from forest canopies ([2], [14]).
To detect any CH4 production in the canopy of a beech stand we connected during autumn a CH4 analyzer to a vertical air sampling system that samples air below and above the canopy from seven heights all in all (profile system). We expected to be able to measure CH4 concentration gradients especially at low wind speeds, when low vertical mixing allows concentration differences to build up.
Material and methods
The Soroe site is located at 55° 29’ 13’’ N, 11° 38’ 45’’ E at an elevation of 40 m above mean sea level in the beech forest “Lille Bøgeskov” near Soro on the island of Zealand, Denmark. It is believed that the forest has never been under plough and that beech trees have been dominating in the area since 2500 B.C. The soils in the area are brown soils classified after the American Soil Taxonomy system as either Alfisols or Mollisols (depending on a base saturation under or over 50%) with a 10-40 cm deep organic layer. The carbon pool in the soil (down to 1 m depth) is 20 kg m-2. The C/N ratio is about 20 in the upper organic soil layers falling to about 10 in the lower mineral layers ([13]). In 2003 the trees around the station were 81 years old beech (Fagus sylvatica L.) trees with an average tree height of 25 m. The roughness length is 1.6 m and the displacement height 19.0 m ([4]). The terrain is flat and there is a homogeneous fetch of 500-2000 m depending on direction. In 2003 the average tree diameter was 38 cm, the stand density was about 283 stems ha-1 and the wood increment calculated on the basis of yield tables was approximately 11 m3 ha-1 yr-1; see Pilegaard et al. ([13]) for further site details.
The site is equipped with a system with the purpose of measuring profile concentrations of gases such as CO2, O3, NO and NO2 with different monitors ([13]). In autumn 2009, a CH4 new analyzer (LGR, DLT-100, Los Gatos Research, CA, USA), was added to the system. The LGR measures CH4, CO2 and H2O via the cavity-ringdown principle with high precision and in our setup continuously at 1 Hz. The vertical profile system consists of a series of Teflon tubes (inner diameter 4.8 mm) with inlets at different heights on a meteorological mast (0.1 m, 0.5 m, 1 m, 5 m, 15 m, 30 m and 41 m - Fig. 1). The tubes are sets of two different lengths: 25 m for heights up to 15 m; 50 m for heights from 15 m to 41 m; i.e., at 15 m both lengths are applied in order to make it possible to investigate tube effects. A constant flow is maintained through the tubes by a diaphragm compressor with a total flow rate of 20 SLPM, i.e., 2.5L continuously on each tube, monitored by a mass flow meter. PTFE coated valves (Type 117, Bürkert GmbH & Co. KG, Ingelfingen, Germany) are installed on the individual tubes to allow the air intake to the monitors to be switched between the different heights (Fig. 1 - [13]).
Fig. 1 - Illustration of the measuring set up with gas monitors and actual sampling heights for the vertical profile system. See description in the text.
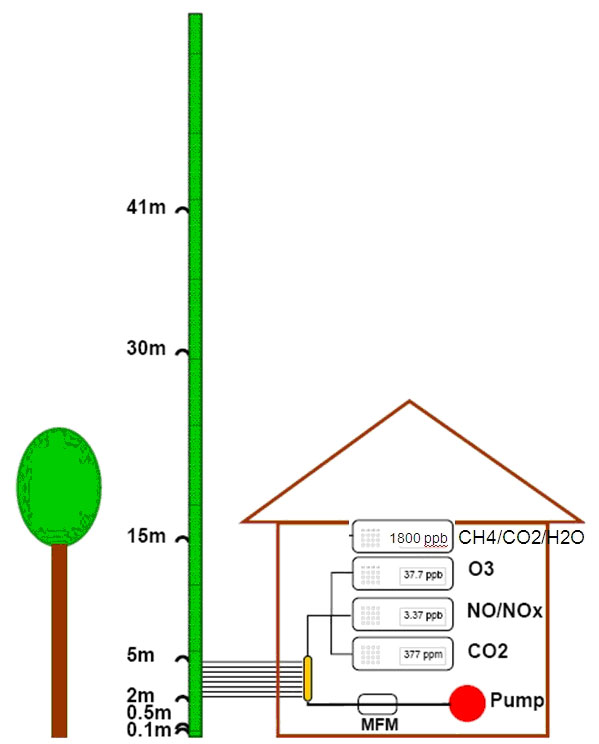
The forest canopy starts with the lower leaves around 13 m above the forest floor and ends around the height of 26 m above the forest floor. The measurement time at each height can be controlled by a computer; currently measurements are made during 2 minutes from each height. The study was conducted in the autumn 2009 in a senescent canopy just before and during leaf fall (23rd October - 16th November). The CO2 data was extracted from the LGR analyzer were synchronized and matched with CO2 data from the other CO2 analyzer (LICOR - 7000) for verification of the individual measuring heights and times.
Results
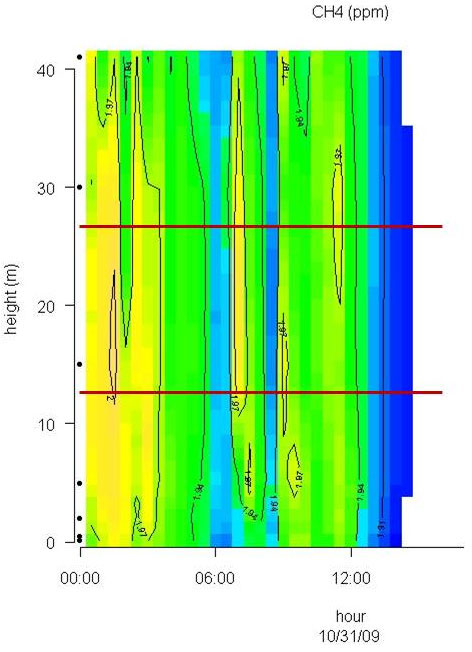
Conditions with low wind speed are needed to detect the build up or depletion of gas concentrations inside a forest canopy gradient. Only during one event during the sampling period did we have sufficiently low wind movements to determine CH4 gradients. In Fig. 2 the relative humidity, PAR, air temperature and friction velocity (u*) are shown from measurements above the canopy during the event with windless conditions, 31st of October. Stabile air conditions (u* > 0.5 m s-1) are seen from midnight until noon (called analysis period). PAR, air temperature and u* increase from 10:00 while relative humidity (RH) decreases. In Fig. 3A, Fig. 3B and Fig. 3C the concentrations of CO2 and CH4, from the LGR analyzer, are shown in relation to sampling height and time for three selected sample hours during the analysis period. The sample periods represent night time at calm conditions (Fig. 3A, 3B) and day time conditions with an increasing u* (Fig. 3C). In Fig. 3A, Fig. 3B and Fig. 3C the CO2 concentration is highest near the forest floor and decreases in the canopy and is lowest above the canopy. The CH4 concentrations are much more variable than CO2, but in general, lowest at the forest floor and highest in the canopy and above the canopy. The processes in the soil play important roles for the development of air concentrations of both CO2 and CH4 above the soil. In this forest it is documented that there is a constant upward CO2 flux due to microbial and root respiration and a constant downward flux of CH4 due to microbial oxidation ([13]). The bell shaped curve for CO2 in relation to sampling height is less explicit in Fig. 3C due to a higher rate of air mixing, but still very clear and it is also possible to detect the inverse relationship for CH4. Here, the increased air mixing reduces the gradients but it also reduces the concentration variations for both gasses. In Fig. 4 a contour plot shows the vertical CO2 concentration for the complete analysis period. The CO2 concentration is high in the lower part of the forest and reaches its maximum near the forest floor. The concentration gradient vanish when u* exceeds 0.5 m s-1 around noon. In Fig. 5 a contour plot shows the vertical CH4 gradients for the complete analysis period. Low concentrations near the forest floor can be seen and higher concentrations are detected in the canopy, shown as “islands”, with higher concentrations around 1:30, 7:00, 9:00 and 11:30 o’clock. Also here the concentration gradient vanishes when u* exceeds 0.5 m s-1.
Fig. 2 - Relative humidity (RH%), PAR, temperature and friction velocity (u*) measured above the canopy in relation to time of day during the analysis period.
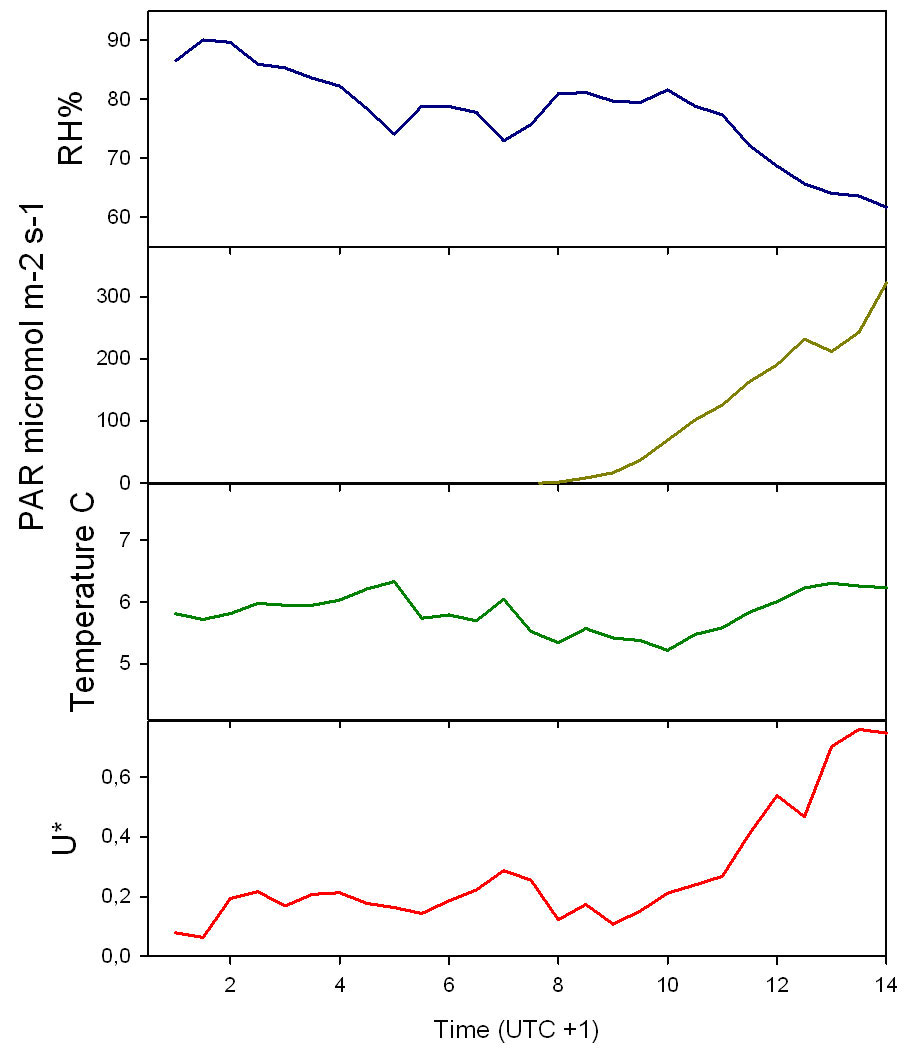
Fig. 3 - CO2 and CH4 concentration in the air in relation to height and time of day on three selected time periods lasting 1 hour each.
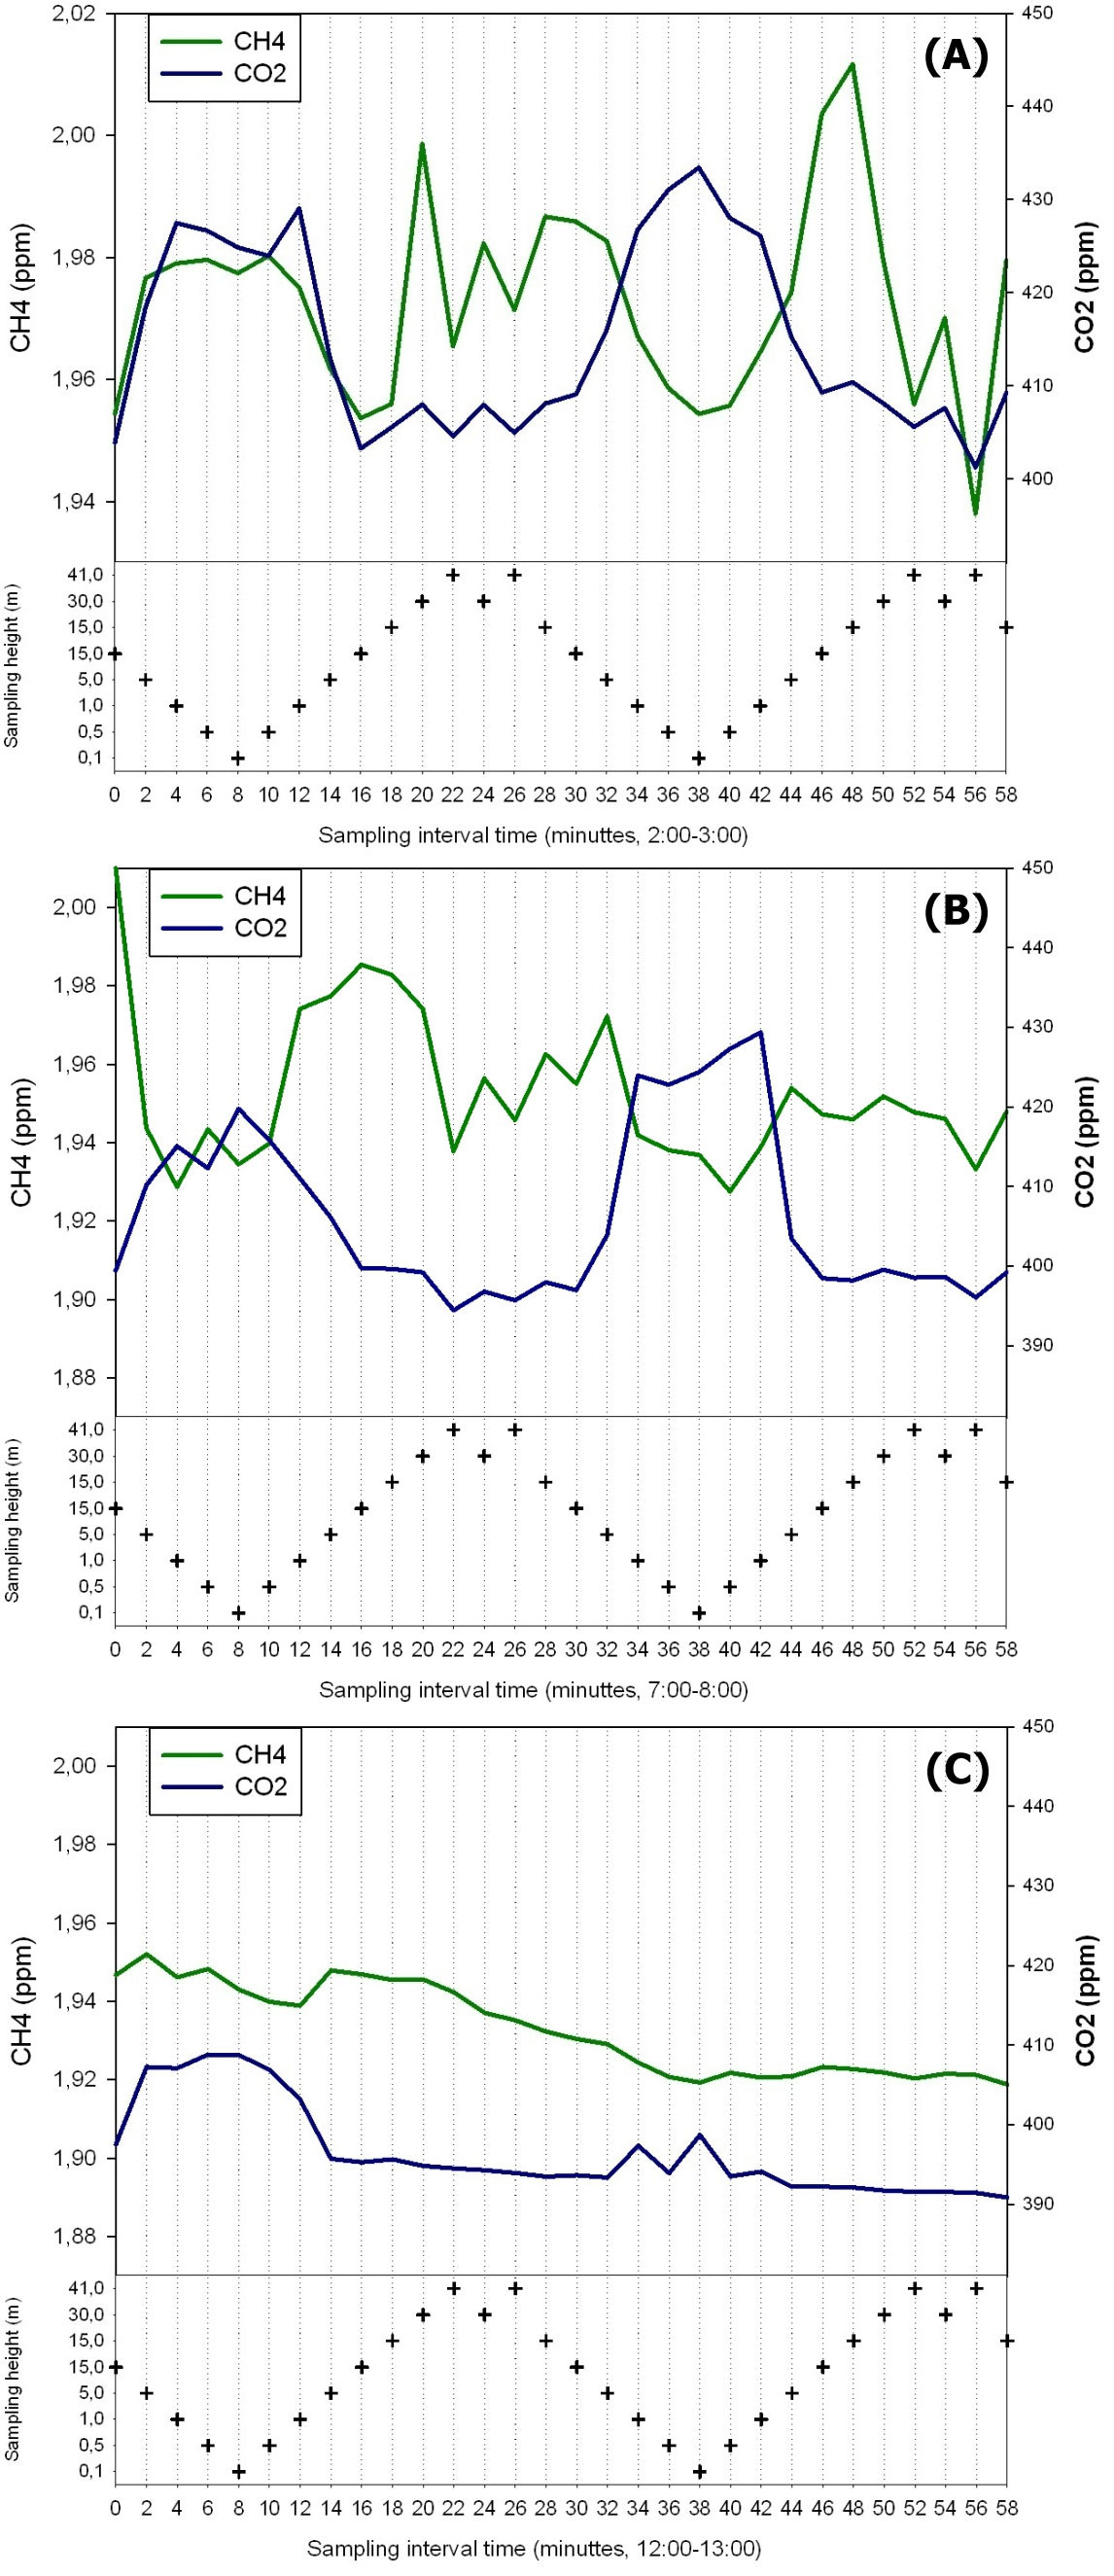
Fig. 4 - Contour plot of the vertical CO2 concentration for the complete analysis period. The horizontal red lines illustrate the top and bottom of the beech canopy. Dots on Y-axis indicate sampling inlets. CO2 concentration increases in the following order: Dark blue, light blue and green.
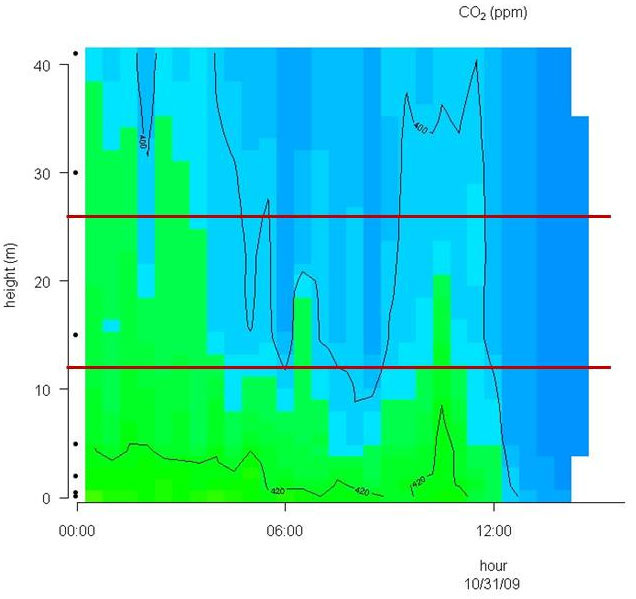
Fig. 5 - Contour plot of the vertical CH4 concentration for the complete analysis period. The horizontal red lines illustrate the top and bottom of the beech canopy. Dots on Y-axis indicate sampling inlets. CH4 concentration increases in the following order: Dark blue, light blue, green and yellow.
Discussion
Methane is produced when plant material is exposed to UV light and there is also a parallel CH4 emission that increases with increasing temperature ([15], [3]). To document and quantify this in the field is a major task because the emission is small compared to the atmospheric concentration and the natural variation is high, as seen in this and others studies ([2], [14], [11]). Plumes from polluted areas containing higher CH4 concentrations can be transported to forest areas as shown by Bowling et al. ([2]) and Smeets et al. ([14]) and this will contribute to large variations in the background CH4 concentration. Two studies find a negative vertical CH4 gradient from above the forest to the forest floor ([2], [14]). A negative CH4 gradient within the canopy could indicate: (1) a soil CH4 sink and no canopy exchange of CH4; (2) a soil CH4 sink and a canopy CH4 sink; or (3) a dominant soil CH4 sink and a smaller canopy CH4 source, with relative magnitudes such that the combined net CH4 flux is a sink ([2]). In our forest, and in three others studies the undisturbed forest floor is detected as a CH4 sink directly by soil chambers ([13], [12]) or indirectly via a profile system ([2]) or eddy covariance measurements ([14]). The CH4 soil deposition measured over a year and reported as annual average varies from 34.2 µg m-2 h-1 ([13]) to 66 µg m-2 h-1 ([12]). The aerodynamic soil fluxes showed 70.8 µg m-2 h-1 during campaigns in July and August ([2]) and 104.4 µg m-2 h-1 in an August campaign ([14]). Simple upscaling of the aerobic CH4 production in Betula populifolia leaves (not sampled at the Soroe site) from the laboratory study at 20 °C ([3]) gives approximately 2 ng CH4 g dw-1 h-1 in dark and 6 ng CH4 g dw-1 h-1 in medium light. For a canopy with a LAI = 5 this will give 2+2+ 2+2+6 = 14 ng CH4 g dw-1 h-1, since only one leaf layer is expose to direct UV light. If the Specific Leaf Area (SLA) is estimated to 140 cm2 g-1 the CH4 emission from the leaves in the canopy will be 1.0 µg CH4 ground m-2 h-1. This number could be higher at more natural conditions if, e.g., emissions from branches, stems, leaf buds, and litter are included, but experimental data are lacking here. However, we hypothesize that the canopy emission and the soil uptake is likely a case nr. 3 with a dominant soil CH4 sink and a smaller canopy CH4 source, with relative magnitudes such that the combined net CH4 flux is a sink according to Bowling et al. ([2]). This will make it almost impossible to determine an aerobic canopy CH4 emission by use of normal aerodynamic methods. In our study we focus on days with windless conditions and in the CH4 contour plot (Fig. 5) several “islands” with high CH4 concentrations are detected around canopy height over the 12 hour period. This could be an indication of a canopy CH4 production since the calm conditions allow a CH4 concentration build up. It is notably, that the three first concentration build-ups in the canopy are generated in the dark or at very low light conditions and at low temperature. Under these conditions a very low CH4 production is expected from the laboratory experiments ([3]). At 11:30 the PAR level is increased to a level were also CH4 production from direct UV light is expected ([3]). However, unfortunately the CH4 build up is without the possibility for a quantification of the production rate with the current method. Using profile measurement inside a forest cannot yet be used for flux rate estimation unless the diffusion coefficient can be estimated. In calm weather conditions, when extreme stabilities are likely to occur, this is even difficult above canopies. The heterogeneous environment inside a forest (stems, leaves, branches, etc.) influence the aerodynamic transport with varying intensities due to variations in wind speed, wind direction, heat flux, turbulence, etc. In general these methods only work in stationary conditions, meaning that the background CH4 concentration doesn’t change. A change in background concentration with time will also lead to vertical concentration gradients, until atmospheric mixing leads to equilibrium between surface fluxes, atmospheric transport and vertical concentration profiles. Averaging over a larger data set would possibly help to test our hypothesis with higher accuracy.
However, despite these limitation, we found the lower CH4 concentrations closer the forest floor to be a plausible indicator for the expected soil CH4 uptake (Fig. 3A, Fig. 3B and Fig. 5) and the CO2 build up at the forest floor (Fig. 4), and conclude that the measuring system detects concentration profiles that would be expected in a normally functioning forest ecosystem. This supports our profile observation showing that CH4 emission occurs in the canopy. Nevertheless, this was only seen in one campaign due to the special demands for windless conditions and the pattern that shows a canopy build up must be repeatedly shown to detect a CH4 production in the canopy. An improvement of the profile system will include more sampling within the canopy layer. The current profile only include one sampling inlet in the canopy while the 6 other sampling inlets are situated above and below the canopy. One or two additional sampling inlets in the canopy will undoubtedly increase the detail level and provide a better understanding how and when the “islands” with higher CH4 concentrations are created and if the canopy can be categorized as a permanent CH4 source. The system will however not be able to quantify any canopy fluxes.
Conclusions
We asked in the headline: is methane released from the forest canopy? and answer Yes, that is very likely since firm evidence has been produced in the laboratory ([15], [10], [3], [16]), and consequently this must also be expected in the canopy in the field under natural conditions. In this study, we see indications for CH4 emissions from the canopy, but more data are needed to be analyzed before the canopy can be considered as a CH4 source or not. Additionally, more controlled experiments under realistic light conditions with a variety of plants are needed to corroborate the hypothesis of small CH4 emissions. However, given the new reduced CH4 emission estimates from laboratory experiments and the large difficulties to quantify such CH4 emissions in the field, one can probably conclude that the small CH4 emissions from leaves are far from offsetting the climate cooling effects of forest due to CO2 sequestration.
Acknowledgements
We acknowledge funding from the EU projects NitroEurope and IMECC for the used scientific infra structures. The concentration profile system was partly maintained by colleagues from Risø DTU’s Wind Energy Department, namely Søren W. Lund and Ebba Dellwik. We acknowledge gratefully generous access to the site granted by the owner, Sorø Akademi, and supported by forest manager Anders Grube and director Jens K. Poulsen.
References
Gscholar
CrossRef | Gscholar
Authors’ Info
Authors’ Affiliation
D Bruhn
P Ambus
KS Larsen
I Ibrom
K Pilegaard
Risø National Laboratory for Sustainable Energy, Technical university of Denmark, Biosystems Division, BIO-309, P.O. Box 49, Frederiksborgvej 399, DK-4000 Roskilde (Denmark)
Corresponding author
Paper Info
Citation
Mikkelsen TN, Bruhn D, Ambus P, Larsen KS, Ibrom I, Pilegaard K (2011). Is methane released from the forest canopy?. iForest 4: 200-204. - doi: 10.3832/ifor0591-004
Paper history
Received: Jan 24, 2011
Accepted: Apr 21, 2011
First online: Nov 03, 2011
Publication Date: Nov 03, 2011
Publication Time: 6.53 months
Copyright Information
© SISEF - The Italian Society of Silviculture and Forest Ecology 2011
Open Access
This article is distributed under the terms of the Creative Commons Attribution-Non Commercial 4.0 International (https://creativecommons.org/licenses/by-nc/4.0/), which permits unrestricted use, distribution, and reproduction in any medium, provided you give appropriate credit to the original author(s) and the source, provide a link to the Creative Commons license, and indicate if changes were made.

Web Metrics
Breakdown by View Type
Article Usage
Total Article Views: 46729
(from publication date up to now)
Breakdown by View Type
HTML Page Views: 39989
Abstract Page Views: 2190
PDF Downloads: 3423
Citation/Reference Downloads: 18
XML Downloads: 1109
Web Metrics
Days since publication: 4551
Overall contacts: 46729
Avg. contacts per week: 71.87
Article Citations
Article citations are based on data periodically collected from the Clarivate Web of Science web site
(last update: Feb 2023)
Total number of cites (since 2011): 11
Average cites per year: 0.85
Publication Metrics
by Dimensions ©
Articles citing this article
List of the papers citing this article based on CrossRef Cited-by.
Related Contents
iForest Similar Articles
Research Articles
Effects of abiotic stress on gene transcription in European beech: ozone affects ethylene biosynthesis in saplings of Fagus sylvatica L.
vol. 2, pp. 114-118 (online: 10 June 2009)
Review Papers
Monitoring the effects of air pollution on forest condition in Europe: is crown defoliation an adequate indicator?
vol. 3, pp. 86-88 (online: 15 July 2010)
Technical Reports
Air pollution regulations in Turkey and harmonization with the EU legislation
vol. 4, pp. 181-185 (online: 11 August 2011)
Research Articles
Long-term monitoring of air pollution effects on selected forest ecosystems in the Bucegi-Piatra Craiului and Retezat Mountains, southern Carpathians (Romania)
vol. 4, pp. 49-60 (online: 05 April 2011)
Editorials
COST Action FP0903: “Research, monitoring and modelling in the study of climate change and air pollution impacts on forest ecosystems”
vol. 4, pp. 160-161 (online: 11 August 2011)
Research Articles
Dust collection potential and air pollution tolerance indices in some young plant species in arid regions of Iran
vol. 12, pp. 558-564 (online: 17 December 2019)
Commentaries & Perspectives
Clean air policy under the UNECE Convention on long-range transboundary air pollution: how are monitoring results “translated” to policy action
vol. 2, pp. 49-50 (online: 21 January 2009)
Research Articles
Tracing the acclimation of European beech (Fagus sylvatica L.) populations to climatic stress by analyzing the antioxidant system
vol. 14, pp. 95-103 (online: 01 March 2021)
Research Articles
A fast screening approach for genetic tolerance to air pollution in Scots pine field tests
vol. 6, pp. 262-267 (online: 01 July 2013)
Research Articles
First results of a nation-wide systematic forest condition survey in Turkey
vol. 4, pp. 145-149 (online: 01 June 2011)
iForest Database Search
Search By Author
Search By Keyword
Google Scholar Search
Citing Articles
Search By Author
Search By Keywords
PubMed Search
Search By Author
Search By Keyword


