The growth dynamics of East European Scots pine (Pinus sylvestris L.) populations - a Lithuanian field trial
iForest - Biogeosciences and Forestry, Volume 17, Issue 2, Pages 59-68 (2024)
doi: https://doi.org/10.3832/ifor4359-016
Published: Mar 06, 2024 - Copyright © 2024 SISEF
Research Articles
Abstract
For the native Lithuanian Scots pine (Pinus sylvestris L.) population, rapidly changing climatic conditions raise new issues, related to survivability and resistance of local provenances to biotic and abiotic stressors. The aim of this study is to revise and update the findings of Abraitis & Ericsson ([3]) who assessed the productivity of Scots pine provenances following 22 years of growth. In this study, we assessed the productivity of same provenances following 39 years of growth. This study was done based on a long-term pine provenance research experiment established in 1975 in Lithuania, as an integral part of the Prokazyn investigation that was launched across the former USSR. Our results indicate a clear effect of latitude as well as longitude on the mean stand performance values of Scots pine provenances. With increasing latitude, mean height, mean quadratic diameter and the volume of growing trees per hectare had a clear decreasing tendency. Except for the mean squared diameter, the impact of the longitude was the same on the mean stand height and the volume of growing trees per hectare. Ranking of Scots pine provenances based on breeding indices showed that provenances that were identified as the most productive ones by Abraitis & Ericsson ([3]) after 17 years of growth, lost their top positions after 39 years of growth. In the case of demand for genetically improved planting material, it could be recommended to use southerner populations which demonstrate higher growth intensity up to 39 years.
Keywords
Scots Pine Provenances, Latitude, Longitude, Radial Growth, Seasonal Effects, Climatic Indicators
Introduction
Forest adaptation to future environmental or social conditions that arise from climate change may significantly alter the effectiveness of contemporary forestry practices in many parts of the globe ([7]). The Intergovernmental Panel on Climate Change ([19]) has concluded that the rise in global temperatures witnessed during the mid-20th century directly coincides with the observed increase in atmospheric greenhouse gas concentrations produced by anthropogenic activity (thus called “anthropogenic climate change”). As global temperatures rise, variability in other climatic regimes is prompted, leading to alterations in global precipitation regimes, and changing inter-annual rainfall and snowfall regimes ([19]).
According to the European Environmental Agency (EEA), the European continent substantially warmed between 1960 and 2017. Thus far, the most significant warming has been observed over the Iberian Peninsula, across central and north-eastern Europe, and over southern Scandinavia ([12]). It is expected that temperatures across Europe will continue to increase throughout this century. The annual average land temperature in Europe is expected to increase by between 1.0 to 4.5 °C, with projections pinpointing the most significant temperature rises within north-eastern Europe and Scandinavia during winter and southern Europe in summer ([12]).
EEA also indicates that annual precipitation since 1960 has been showing an increasing trend of up to 70 mm per decade in north-eastern and north-western Europe. Contrastingly, it decreased of up to 90 mm per decade in some parts of southern Europe ([11]). Future changes in precipitation are projected to have similar patterns, annual precipitation further increasing in northern Europe and decreasing in southern Europe ([11]).
The findings of GreenMatch ([16]) show that Lithuania has been seeing a substantial rise in sea level compared to the other European countries. The surface temperature has increased the most, with an increase of 0.325 °C per decade, and finally, the precipitation in Lithuania had increased by 20 mm per decade, between 1960 and 2015.
Scots pine is highly genetically diverse and widespread across Europe, ranging from northern Scandinavia to the mountains of Spain, Italy, Greece and Turkey ([50]). It is adapted to the sub-Atlantic and the continental climate in Central and Eastern Europe, Scandinavia and Asia ([18]). Scots pine is also an environmentally, socially and economically valuable tree species, covering more than 33% of forested land area in Lithuania ([44]). Yet, it is also sensitive to climate change. High temperatures and drought may be the key factors leading to a tipping point of the balance between trees and secondary pathogens, resulting in increased mortality rates in Scots pine ([34]). Results of long-term experiments by Oleksyn et al. ([28]) and Reich & Oleksyn ([35]) indicate that except for far northern locations (> 62° N), Scots pine will likely experience reduced growth rates and declining survival rates or both across southern and central Europe. Other findings reveal that in central and southern Europe the incremental growth of local Scots pine populations was the least sensitive to environmental alterations and differed least under different growth conditions ([39]).
Bernier & Schoene ([7]) stated that there are three possible approaches for aiding the adaptation process of forests to climate change: no intervention (business as usual), reactive adaptation (action taken after the fact) and planned adaptation (redefining forestry goals and practices in advance). According to the authors, planning in advance is the most appropriate measure to cope with climate change. Planned adaptation, among all others mentioned which must be at different levels, also includes new opportunities that arise from climate change, for example planting provenances or species that will grow faster under projected climatic conditions ([7]). Due to climates change, populations may become poorly adapted to local growth conditions ([13]). However, long-distance gene flow can promote adaptive evolution in novel environments by increasing genetic variation ([23]). Since extreme weather is likely to be a key determinant of long-term tree health and persistence, further experimental research should focus on climatic indicators that have expressed relation to growth, survival, and phenology ([30]).Many provenance trials have been completed in Europe and across the globe. The benefits of provenance transfer were first described by Von Wangenheim ([48]), meanwhile one of the first reports regarding the performance of Scots pine provenances was published in France by Vilmorin ([47]). Additionally, the International Union of Forest Research Organizations (IUFRO) organized international provenance trials in 1907, 1938, 1939 and 1982 ([14], [45], [42]).
In the former Soviet union, 33 geographic trials of Scots pine were established from 1974 to 1976 and were called Prokazin-type series trials ([41]). The Prokazin-type series trials aimed to assess adaptation, resistance and productivity of neighbouring, as well as remote pine provenances for improving the genetic diversity of Scots pine and ensuring the sustainable development of pine stands in future. In Lithuania, the provenance trials were established in Kazlu Ruda, Mazeikiai, and Plunge forest districts from 1974 to 1976 ([3], [2]). Abraitis & Ericsson ([3]) identified the most superior Scots pine provenances under Lithuanian growth conditions, after 22 years of growth. By using the breeding index they identified (39) Cierkasy, (27) Mogilov, (48) Kostroma (Transcarpathian), (38) Sumsk, (24) Elva, (54) Tambov, (29) Gomel and (55) Voronez provenances, among the best provenances regarding the productivity and growth.
The aim of this study is to revisit the selected provenances and revise whether the findings of Abraitis & Ericsson ([3]) are still valid after 39 years of growth regarding the productivity of analyzed Scots pine provenances. Accordingly, four main tasks were set to: (i) estimate the mean growth and yield values of different pine provenances growing under Lithuanian climatic conditions; (ii) test the impact of latitude and longitude of the location of provenances’ origin on their mean growth and yield values; (c) define the most important stand level indicators that influence mean size and health of pine provenances and (d) identify the most productive pine provenances by using the Abraitis & Ericsson ([3]) breeding index.
Materials and methods
Establishment of the experiment
From 1974 to 1976 across the former USSR, a series of Scots pine provenance experiments were established. The program was headed by YE. P. Prokazin, from the Forest Seed Laboratory of the All-union Forest Research Institute (later program was referred to as Prokazin series, see [32], [41] for details).
In 1975, the field test of the Prokazin series with 48 provenances from the former Soviet union was established in 1975 in Jure forest district (54° 47′ 21″ N, 23° 35′ 19″ E) in central Lithuania (Fig. 1, Fig. 2, Tab. 1). The seeds were collected in natural, phenotypically superior stands, where genetically superior seeds are produced in commercial quantities.
Fig. 1 - The experimental design of the Jure provenance test plantation. Populations were planted in large un-replicated plots of about 100 trees each. Black dots indicate the positions of trees. The numbers in the middle of each square indicate the planted provenances listed in Tab. 1.
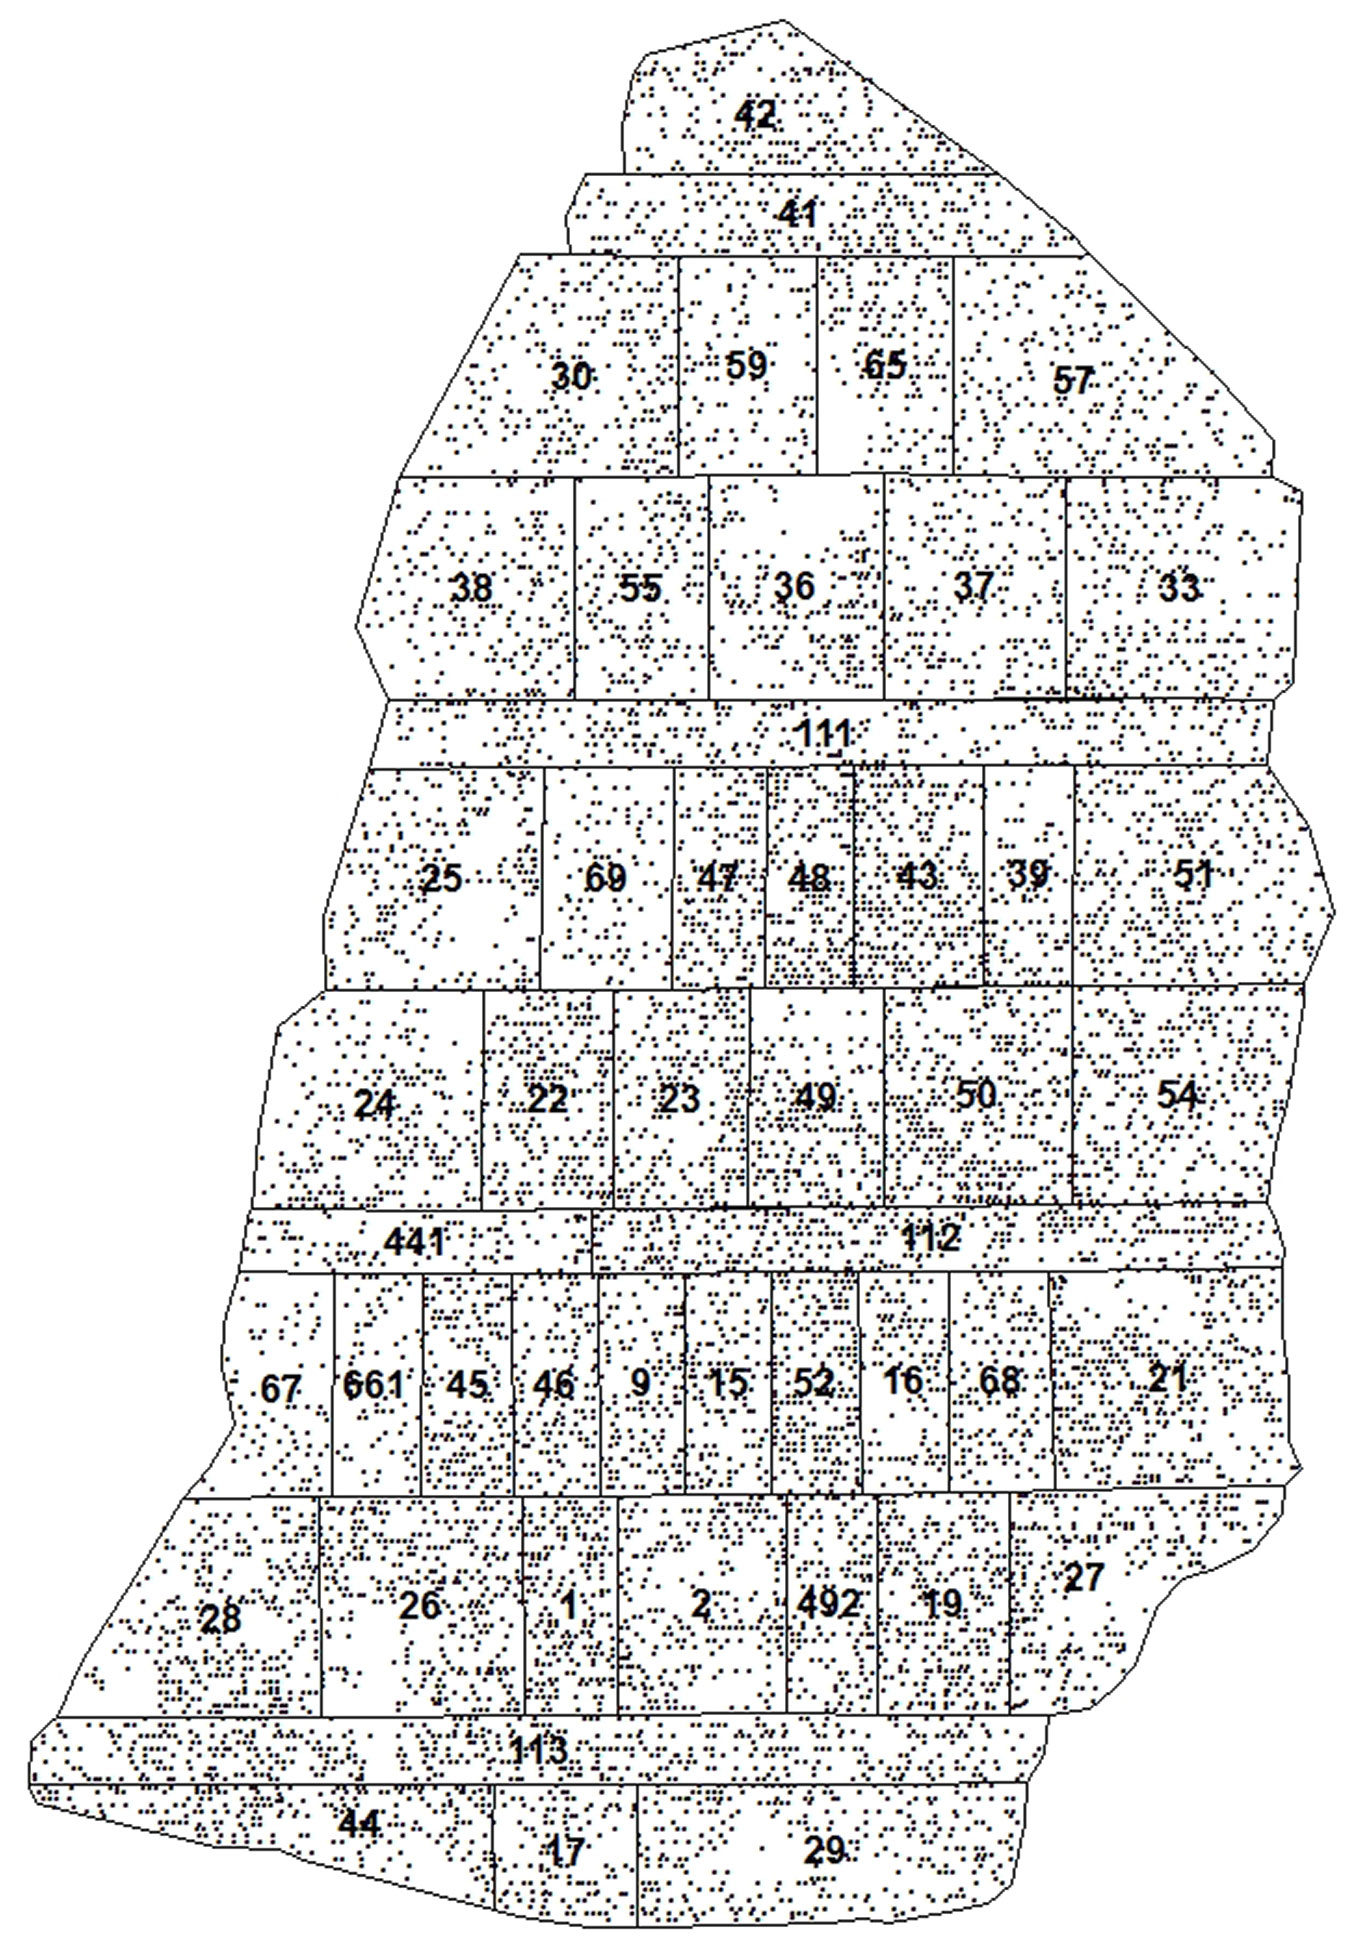
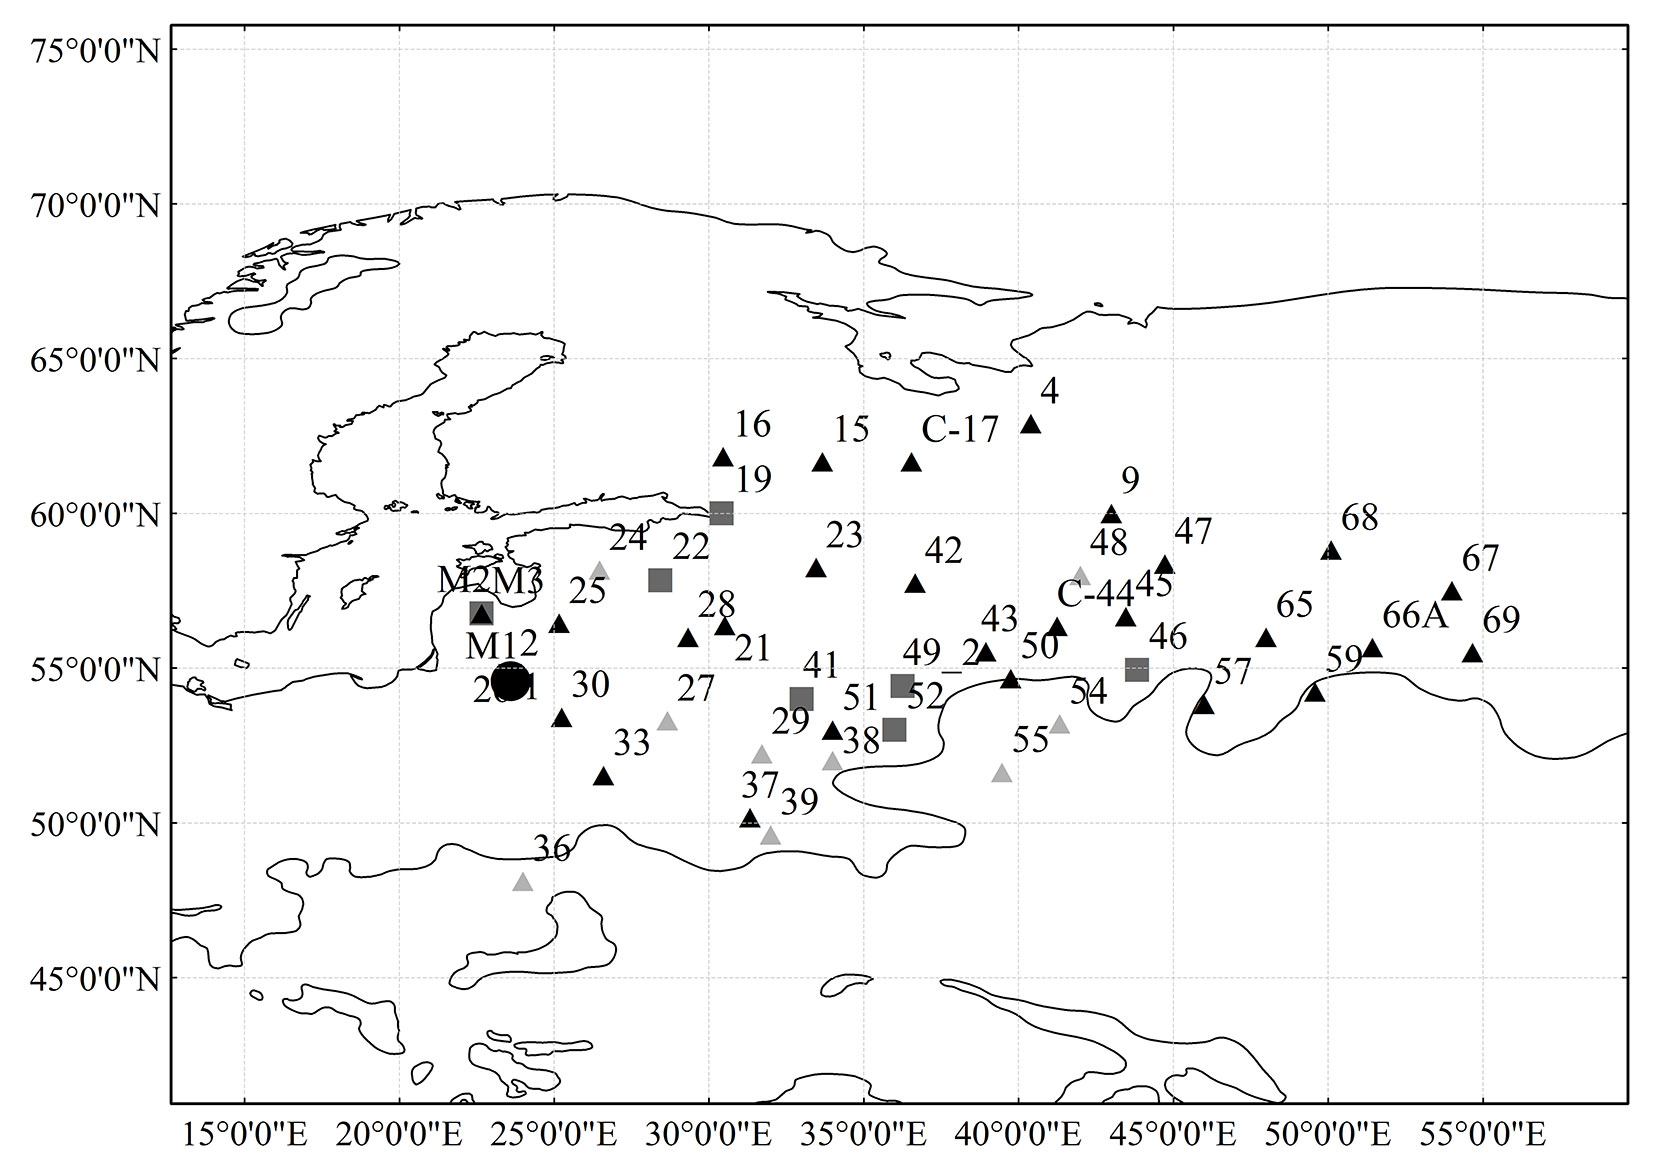
Fig. 2 - The place of origin of the Scots pine provenances, planted in Jure provenance test plantation. Black line indicates distribution range of Scots pine (shapefiles taken from [9]). Bigger black circle indicates the location of experiment. Light grey triangles visualizes the provenances evaluated as the best ones by ([3]). Dark grey squares show the top performing provenances defined by this study, based on the breeding indices.
Tab. 1 - Geographical data of the considered provenances (Prov.).
| Prov. | Country | Region | Lat N | Long E | Prov. | Country | Region | Lat N | Long E |
|---|---|---|---|---|---|---|---|---|---|
| 28 | BLR | Vitebsk | 56°00′ | 29°20′ | 43 | RUS | Moscow | 55°32′ | 38°57′ |
| 29 | BLR | Gomel | 52°14′ | 31°43′ | 45 | RUS | Gorky | 56°40′ | 43°28′ |
| 30 | BLR | Gardin | 53°25′ | 25°15′ | 46 | RUS | Gorky | 54°56′ | 43°50′ |
| 24 | EST | Elva | 58°10′ | 26°28′ | 47 | RUS | Kostroma | 58°22′ | 44°44′ |
| 1 | LTU | Kazlu Ruda | 54°45′ | 23°35′ | 48 | RUS | Kostroma | 58°00′ | 42°00′ |
| 2 | LTU | Kazlu Ruda | 54°45′ | 23°35′ | 50 | RUS | Ryazan | 54°40′ | 39°45′ |
| 26 | LTU | Prienai | 54°42′ | 23°58′ | 51 | RUS | Bryansk | 53°00′ | 34°00′ |
| M1 | LTU | Mazeikiai | 56°46′ | 22°40′ | 52 | RUS | Orlov | 53°00′ | 36°00′ |
| M2 | LTU | Mazeikiai | 56°46′ | 22°40′ | 54 | RUS | Tambov | 53°12′ | 41°20′ |
| M3 | LTU | Mazeikiai | 56°46′ | 22°40′ | 55 | RUS | Voronez | 51°38′ | 39°28′ |
| 25 | LVA | Jaunjelgava | 56°27′ | 25°10′ | 57 | RUS | Penza | 53°50′ | 46°00′ |
| 4 | RUS | Archangelsk | 62°54′ | 40°24′ | 59 | RUS | ulyanovsk | 54°14′ | 49°35′ |
| 9 | RUS | Vologda | 60°00′ | 43°00′ | 65 | RUS | Tarty | 56°00′ | 48°00′ |
| 15 | RUS | Karelia | 61°40′ | 33°40′ | 67 | RUS | udmurtia | 57°30′ | 54°00′ |
| 16 | RUS | Karelia | 61°50′ | 30°28′ | 68 | RUS | Tver | 58°49′ | 50°06′ |
| 19 | RUS | Leningrad | 60°00′ | 30°25′ | 69 | RUS | Baskiria | 55°30′ | 54°40′ |
| 21 | RUS | Pskov | 56°23′ | 30°31′ | 49_1 | RUS | Kaluga | 54°25′ | 36°16′ |
| 22 | RUS | Pskov | 57°50′ | 28°26′ | 49_2 | RUS | Kaluga | 54°25′ | 36°16′ |
| 23 | RUS | Novgrod | 58°15′ | 33°28′ | 66A | RUS | Tver | 55°40′ | 51°26′ |
| 27 | RUS | Magilov | 53°18′ | 28°40′ | C-17 | RUS | Karelia | 61°40′ | 36°33′ |
| 38 | RUS | Sumsk | 52°01′ | 34°00′ | C-44 | RUS | Vladimir | 56°21′ | 41°15′ |
| 39 | RUS | Cerkasy | 49°37′ | 32°00′ | 33 | UKR | Rovno | 51°32′ | 26°36′ |
| 41 | RUS | Smolensk | 54°00′ | 33°00′ | 36 | UKR | Lvov | 48°07′ | 24°00′ |
| 42 | RUS | Kalinin | 57°45′ | 36°40′ | 37 | UKR | Kijev | 50°10′ | 31°20′ |
The experimental site belongs to Pinetum Vaccinio-myrtillosa forest type with moderately dry and comparatively fertile oligotrophic mineral soils - Haplic Arenosol, where the water table is deeper than 5 m and suitable for pine growth ([10]).
The trail was designed in large non-replicated provenance plots with about 100-200 trees per provenance (Fig. 1). The smallest trials, less than 1000 m2 were set for Russian Vologda, Karelia, Kostroma, Gorky provenances and the largest ones, more than 2700 m2, were established for Russian Penza and local Lithuanian Mazeikiai provenances. About 4400 seedlings per hectare were planted in each trial area with a spacing of 1.5 × 1.5 m ([3]). No thinning was performed in this trial until now.
The geographical data and the size of trial plots of assessed provenances in Jure provenance test plantation are presented in Tab. 1. As the data in Tab. 1 shows, provenances were introduced from various regions: 3 provenances were introduced from Belorussia, 1 from Estonia, 1 from Latvia, 6 from Lithuania, 34 from Russia, and 3 from ukraine. The covered range of latitude of introduced provenances varied from 48° 07′ to 62° 54′ N and the longitude ranged from 22° 40′ to 54° 40′ E.
Climatic trends from 1975 to 2013 in the Kaunas Region
The climate data, covering the 1975-2013 period was obtained from the Kaunas region meteorology station, located 25 km from the experimental area.
The long-term mean annual temperature changed between +4.6 °C (1987) and +8.5 °C (2008), with a statistically significant increase of 0.044 °C per year ([19]). Annual precipitation in the same period changed from 450 mm in 1976 to 840 mm in 2010, increasing by approximately 3.3 mm per year ([4]).
Yearly maximum air temperatures (p<0.0001) were also found to have increased, with temperatures in June rising by 0.035 °C per year, and in July by 0.093 °C per year. Additionally, maximum February precipitation levels increased by approximately 0.6 mm per year, meanwhile, data shows that summertime (July-August) peak precipitation levels have increased by 0.8 mm per year. However, statistical analysis shows that the increase in summertime peak precipitation is not statistically significant ([4]).
Field measurements
Field measurements were completed in the autumn of 2013, when trees were 39 years old. For each tree in the trial, the status of a tree (growing or dead), position, diameter at breast height (dbh), tree height (h) height to crown base (hcb) and defoliation were estimated. In total, the mentioned data was collected for 9539 trees, representing 48 pine provenances.
The position of each tree was estimated by measuring the distance of the tree from the southwest corner (abscissa and ordinate coordinates) by using the tape with an accuracy of 1 cm. The dbh for each tree in the sample plot was measured at 1.3 metres above the ground using a caliper with the precision of 1 mm. Tree height and height to crown base were measured by using a clinometer with of ± 0.5m. To define the height to the crown base position, the method proposed by Biging & Wensel ([8]) was applied. To estimate crown width, four measurements of crown radius were completed according to the main compass directions (north, east, south and west) by using a tape measure with a precision of ± 0.1 m ([37]). A visual assessment for defoliation was carried out by two experts at the end of August 2014, assessing the defoliation level of each tree in the range from 0% to 100%, with a precision of 5%. For this purpose, European forest monitoring methodology was used by establishing five defoliation classes ([46]): healthy trees (up to 10%); slightly damaged trees (11-25%); moderately damaged trees (26-60%); severely damaged trees (61-99%); defoliation complete - dead trees (100%).
Estimation of the mean growth and yield values
The following yield parameters were estimated for each provenance in the experiment: number of trees per hectare (N), survival rate (Sr), mean diameter (Dq), mean height (Hq), basal area (BA) and volume (V) of growing trees per hectare.
We calculated the number of trees per hectare by dividing the number of trees in a trial plot by plot size. The Sr of each provenance was estimated as a ratio of the number of growing trees per hectare during the last inventory and the number of planted trees per hectare. The Dq in the trial plot was estimated as the quadratic mean diameter of all growing trees (eqn. 1):
where Dq is the quadratic mean diameter (in cm), dbh is tree diameter at the breast height (in cm), and K is the number of trees per plot. The stand height curves for each provenance at the time of inventory, were developed by using Michailoff ([27]) formula (eqn. 2). The mean Hq was estimated by using regression coefficients a0 and a1 that were taken from eqn. 2. Also, respective Dq values were used (eqn. 1). The mean height to crown base (Hcb) is estimated alike Hq, by putting hcb values in eqn. 2:
where h is tree height (in m), dbh is the tree diameter at breast height (in cm), Hq is the mean stand height (in m), Dq is the quadratic mean diameter (in cm), a0 and a1 are the regression coefficients.
The basal area of growing trees per hectare (BA) was estimated by summing up basal areas of all trees growing in the trial, and then dividing it by the size of the trial. The volume of each tree was estimated by using its dbh, height and form factor. Form factors (fs) were estimated by using eqn. 4 ([24]):
where fs is a form factor, h is the height of the tree (in m), dbh is the tree diameter at the breast height (in cm).
Volume of growing trees per hectare (V, m3 ha-1) was calculated by summing up volumes of all trees growing in the trial plot.
The generic geographical transfer effects
The generic geographical transfer effects on the mean growth and yield values of Scots pine provenances were defined by plotting Sr, Dq, Hq and V over the latitude and longitude of the origin place of each provenance. Also, depending on the relation type linear or polynomial models were fitted and coefficients of determination (R2) were estimated. For this purpose, we used R software ver. 4.2.2 ([33]).
The impact of latitude and longitude on the mean growth and yield values
Pearson’s correlation analysis was performed to clarify inter-relations between the most important stand level and geographical origin indicators (V, Dq, Hq, Sr, defoliation, latitude and longitude) with α < 0.05.
Also, multiple linear regression analysis was performed, and several regression models were developed to identify the partial impact of latitude and longitude on the mean growth and yield values. The volume of growing trees (V) per hectare, mean diameter of trees Dq, defoliation and Sr were used as dependent variables in the regression analysis. As the independent variables, we used eleven indicators, representing groups of origin, dendrometry, health and competition. The place of the origin was defined by its longitude and latitude. The dendrometry of each provenance was expressed by its Dq, Hq, mean height to crown base (Hcb), mean crown width (Cw) and mean crown horizontal area (Cha). The health of each provenance was defined by using its Sr and defoliation. The mean competitiveness of each provenance was estimated by using mean values of distant dependent competition indices, estimated for each tree. To identify the competitors, the inverse search cone was placed at the height of the crown base of a target tree, with opening angle of 80 degrees. Next, two competition indices proposed by Pretzsch ([31]) and Hegyi ([17]) were estimated (eqn. 5, eqn. 6):
where CIPrz is a competition index proposed by Pretzsch ([31]), K is the number of trees per plot, i is a subject tree, j is a competitor(s), ba is a basal area of a tree in cm2, hca is a tree horizontal crown area m2, β is the gradient of a straight line connecting the base of search cone and top of competitor tree, HSCB is a height of the search-cone base, distij is the distance between competitor and target trees (in m). For each dependent variable, the first multiple regression model was constructed by using all independent variables in order to define combined effects. Then, the second model was developed without mean defoliation and competition indices. Next, the third model was constructed by using only variables indicating the place of origin - longitude and latitude. The fourth model was constructed to clarify the influence of the Sr and the fifth the influence of dendrometry variables.
To detect the individual effects of geographical origin variables latitude and longitude on analysed dependent variables, also second-degree polynomial regression models were developed. The goodness of fit of the developed multiple linear regression models was evaluated by estimating the coefficient of determination R2.
Ranking of Scots pine provenances
All investigated Scots pine provenances were ranked by using the breeding index proposed by Abraitis & Ericsson ([3]) that is presented in eqn. 7:
where ti is a breeding index, Xi is a population mean value of a certain trait, X is an overall mean of the same trait, S is a standard deviation. Breeding indices were estimated for V, Sr, Dq and Hq. Overall, performance of each scots pine provenance was evaluated according to the sum of indices of all the traits (V, Sr, Dq and Hq) studied.
Results
The generic geographical transfer effects
The pine provenances from geographical gradients between 54°-55° N and 35°-36° E, clearly had the highest survival rate reaching 40% (Fig. 3a, Fig. 3b). The survival rates of the provenances transferred over a larger distance, from far northern, and southern eastern or western regions mostly, did not reach more than 20%. The survival rate of distant eastern provenances from longitude over 50° E, did not reach more than 12%.
Fig. 3 - The effect of latitude (LAT) and longitude (LONG) on survival and wood yield of Scots pine provenances. Red circles indicate the location of local Lithuanian provenances.
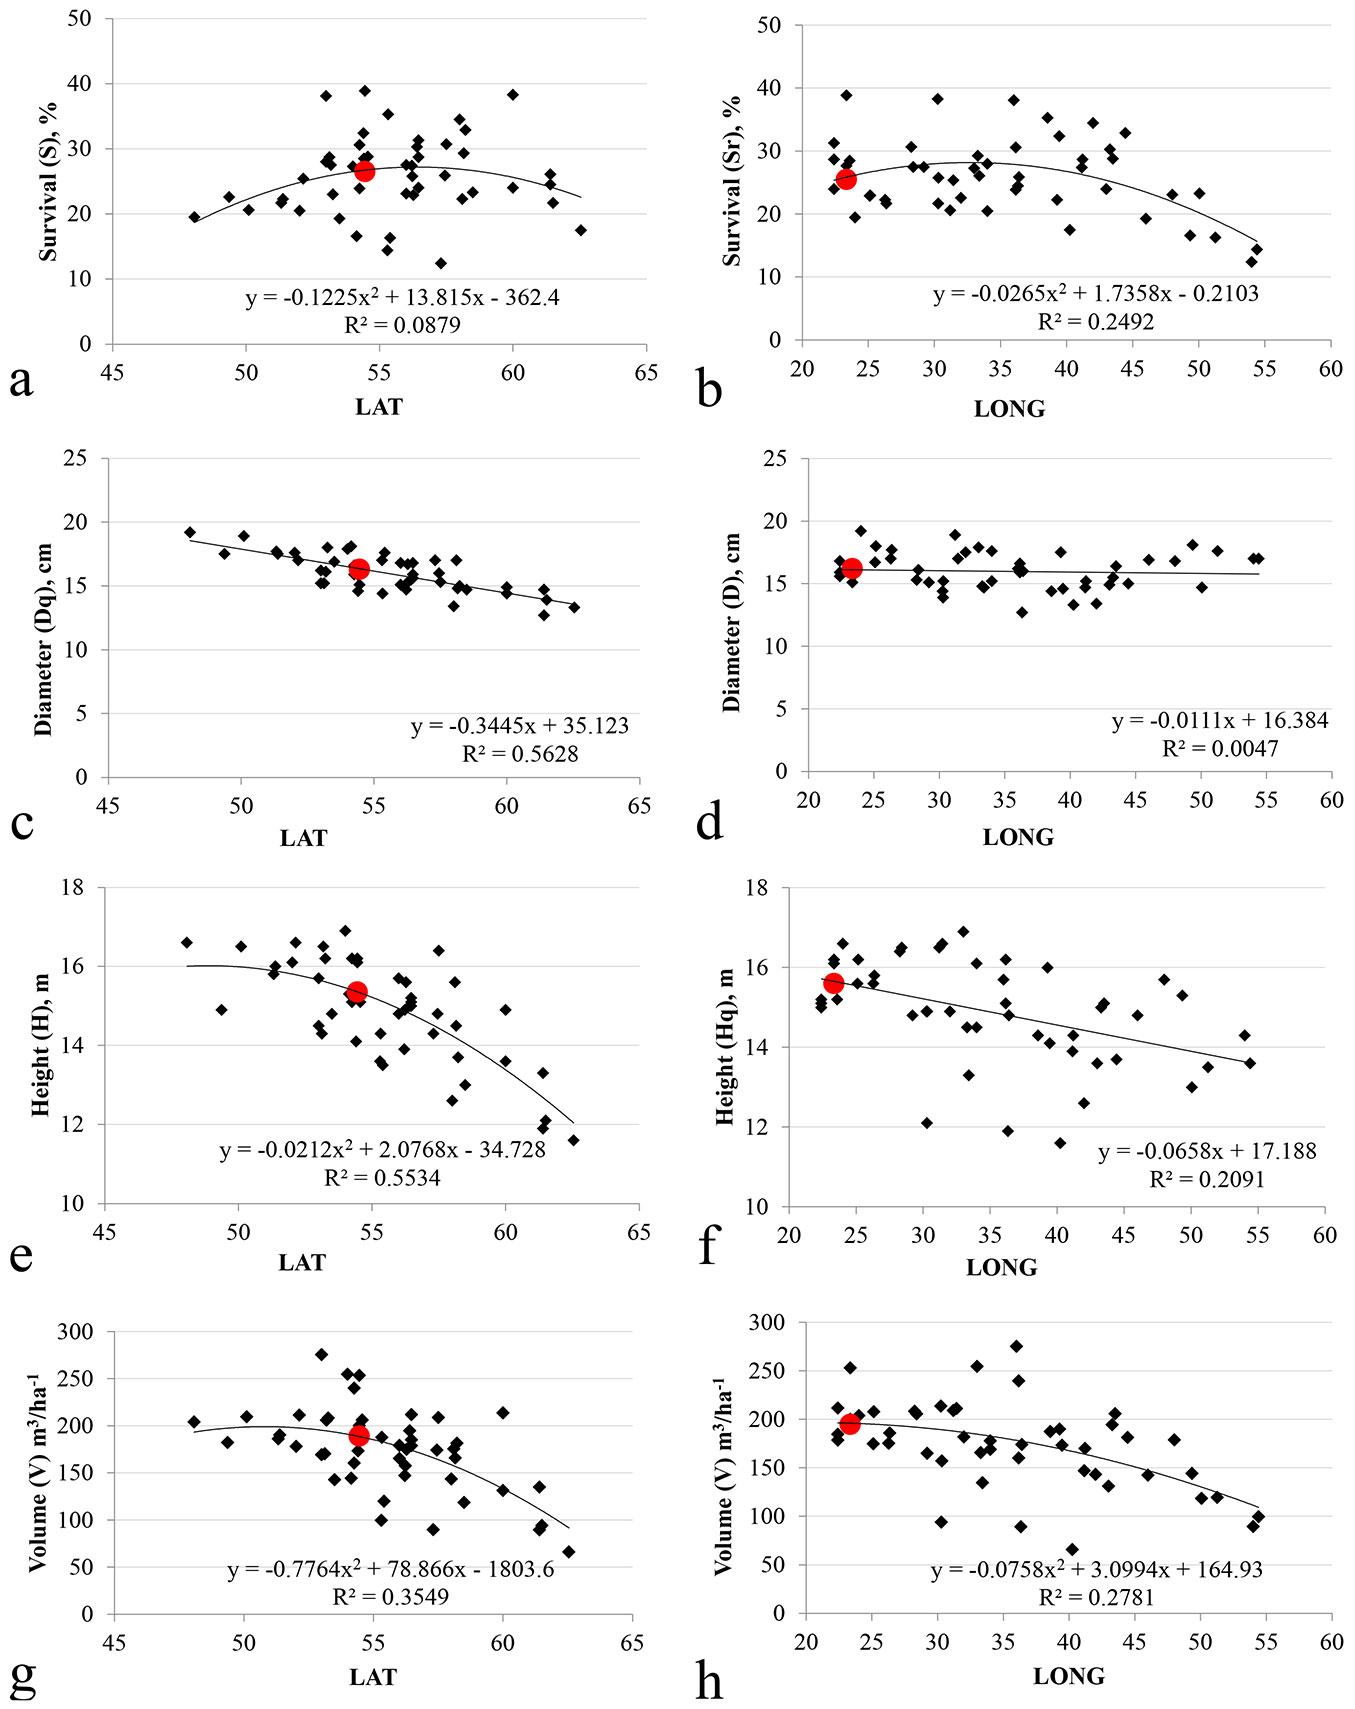
The local Lithuanian provenances had among the highest survival rates over the latitude gradient, however, on the longitudinal gradient provenances of adjacent continental origin boasted higher survival rates (Fig. 3a, Fig. 3b).
Longitude had a stronger effect on the survival rate compared to latitude, as demonstrated by the higher share of variation in survival rate accounted for by longitude compared to latitude (R2=0.249 and R2=0.088, i.e., 24.9% and 8.8%, respectively).
The southernmost pine provenances showed the highest tree diameter Dq (Fig. 3c). For the latitudinal gradient, tree diameter decreased when moving northwards (R2=0.56). The developed linear model showed that longitude managed to explain only 1.1% of Dq variation (R2= 0.005 - Fig. 3d).
In contrast to diameter, the latitudinal response of tree height was not linear, after latitudes of 55 (Lithuania) the rate of tree height gain decrease was markedly higher (Fig. 3e). A similar but less expressed nonlinear trend in tree height response was observed for the longitudinal transfer, where the local provenances were the tallest followed by a gradual reduction of tree height moving eastward in origin (Fig. 3f). The relationships between Hq and latitude, Hq and longitude were clearly nonlinear and well defined by using polynomial equations (R2=0.553 and R2=0.209).
Provenances from (52) Orlov, (41) Smolensk, and (1) Kazlu ruda, Lithuania demonstrated the highest wood yield of 275.5, 254.7 and 253.4 m3 ha-1, respectively. Contrastingy, provenances from (69) Baskiria, (16, C-17) Karelia, (67) Udmurtia and (4) Archangelsk, did not reach 100 m3 ha-1 and their V was far below the V of the lowest local Mazeikiai, Lithuanian provenance that reached 178.9 m3 ha-1. The timber yield of Belorussian, Latvian, Estonian and Ukrainian provenances ranged between 165.3 and 211.4 m3 ha-1 and did not differ significantly (p>0.157) from the productivity of local provenances.
The provenances from the geographical gradients 50°-55° N and 25°-35° E yielded the highest wood volume. The local Lithuanian provenances were among the most productive ones over the latitudinal gradient, though not over the longitudinal gradient (Fig. 3g, Fig. 3h). The relationship between V and latitude, V and longitude, also, were clearly nonlinear and well defined by polynomial model (R2=0.355 and R2=0.278).
The partial impact of latitude and longitude on stand-level variables
The correlation analysis of the most important stand level and geographical origin indicators revealed that the geographical origin of provenances, expressed by latitude (LAT) and longitude (LONG) were among the key factors, significantly contributing to V (correlation values with LAT and LONG: r=-0.592 and r=-0.514, respectively), Hq (r= -0.764 and r= -0.457), survival rate (r= 0.094 and r= -0.335), defoliation (r= 0.608 and r= -0.024) and especially Dq (r= -0.7502 and r= -0.068 - Tab. 2).
Tab. 2 - Pearson’s correlation coefficients among the geographical variables and measured traits on provenance mean level (N=47). (*): p<0.05.
| Response variable | Origin | Dendrometry | Health | Mean Competition | ||||||||
|---|---|---|---|---|---|---|---|---|---|---|---|---|
| LAT | LONG | V, m3 ha-1 | Dq, cm | Hq, m | Hcb, m | C W | Cha, m2 | Sr % | DEF, % | CI Hg | CI PRZ | |
| V, m3 ha-1 | -0.592* | -0.514* | - | 0.390* | 0.815* | 0.846* | 0.866* | -0.192 | 0.605* | -0.441* | -0.093 | -0.091 |
| Dq, cm | -0.750* | -0.068 | 0.390* | - | 0.750* | 0.675* | 0.526* | 0.468* | -0.457* | -0.693* | -0.262 | -0.292* |
| Hq, m | -0.764* | -0.457* | 0.815* | 0.750* | - | 0.963* | 0.880* | 0.119 | 0.106 | -0.566* | -0.189 | -0.223 |
| Sr, % | 0.094 | -0.335* | 0.605* | -0.457* | 0.106 | 0.220 | 0.351* | -0.537* | - | 0.103 | 0.134 | 0.165 |
| DEF,% | 0.608* | -0.024 | -0.441* | -0.693* | -0.566* | -0.533* | -0.405* | -0.307* | 0.103 | - | 0.413* | 0.420* |
The first multiple linear regression model (Model 1 - Tab. 3) showed that the highest share of V variation explained when Dq, Hq, LONG and Sr are included in the model. These indicators accounted for 97.5% of V variation. The second model (Model 2 - Tab. 3) proved that DEF, CIHg and CIPRZ had no impact in Model 1 (R2=0.974). Geographical origin, which was expressed by LAT and LONG, explained 62% of V variation (Model 3 - Tab. 3).
Tab. 3 - Multiple regression analysis of trees survival rate, volume, mean diameter and crown defoliation of different provenances in relation to their geographical origin, dendrometry, health and mean competition index. (SEE): standard error of estimate.
| Model | Index | Origin | Dendrometry | Health | Competition | Model statistics | |||||||||
|---|---|---|---|---|---|---|---|---|---|---|---|---|---|---|---|
| LONG | LAT | Dq (cm) |
Hq (m) |
Hcb (m) |
CW (m) |
Cha (m2) |
Sr (%) |
DEF (%)% |
CI Hg | CI PRZ | R2 | F | SEE | ||
| 1 | B | 0.267 | - | 15.77 | 9.577 | - | - | -2.501 | 5.244 | - | -6.727 | - | 0.975 | 254.8 | 7.45 |
| p-value | <0.0001 | - | 0 | <0.0001 | - | - | 0.0329 | 0 | - | 0.2386 | - | ||||
| 2 | B | 0.254 | - | 15.453 | 9.825 | - | - | -2.268 | 5.252 | - | - | - | 0.974 | 302.3 | 7.49 |
| p-value | 0.0002 | - | <0.0001 | <0.0001 | - | - | 0.0496 | <0.0001 | - | - | - | ||||
| 3 | B | 1.021 | 1.01 | - | - | - | - | - | - | - | - | - | 0.619 | 35.81 | 27.4 |
| p-value | <0.0001 | <0.0001 | - | - | - | - | - | - | - | - | - | ||||
| 4 | B | - | - | - | - | - | - | - | 4.385 | - | - | - | 0.366 | 25.98 | 35 |
| p-value | - | - | - | - | - | - | - | <0.0001 | - | - | - | ||||
| 5 | B | - | - | -10.901 | 22.906 | - | 13.844 | - | - | - | - | - | 0.812 | 61.81 | 19.5 |
| p-value | - | - | 0.0017 | 0.0009 | - | 0.0068 | - | - | - | - | - | ||||
| 6 | B | 0.304 | -0.104 | - | 0.514 | - | - | - | -0.105 | -0.08 | 0.356 | - | 0.93 | 88.6 | 0.42 |
| p-value | 0.0526 | 0.0014 | - | <0.0001 | - | - | - | <0.0001 | <0.0001 | 0.293 | - | ||||
| 7 | B | 0.329 | -0.102 | - | 0.519 | - | - | - | -0.103 | -0.074 | - | - | 0.928 | 105.7 | 0.42 |
| p-value | 0.0346 | 0.0017 | - | <0.0001 | - | - | - | <0.0001 | <0.0001 | - | - | ||||
| 8 | B | 0.944 | -0.328 | - | - | - | - | - | - | - | - | - | 0.7 | 51.4 | 0.83 |
| p-value | 0.0009 | <0.0001 | - | - | - | - | - | - | - | - | - | ||||
| 9 | B | 0.907 | -0.217 | - | 0.375 | - | - | - | - | - | - | - | 0.748 | 42.6 | 0.768 |
| p-value | 0.0006 | <0.0001 | - | 0.0065 | - | - | - | - | - | - | - | ||||
| 10 | B | - | - | - | 0.711 | - | - | - | -0.122 | -0.088 | - | - | 0.902 | 132.5 | 0.48 |
| p-value | - | - | - | <0.0001 | - | - | - | <0.0001 | <0.0001 | - | - | ||||
| 11 | B | - | - | - | - | - | - | - | -0.096 | -0.208 | - | - | 0.631 | 37.6 | 0.92 |
| p-value | - | - | - | - | - | - | - | <0.0001 | <0.0001 | - | - | ||||
| 12 | B | -0.008 | 0.029 | -3.454 | - | - | 1.423 | - | -0.461 | - | - | 5.105 | 0.646 | 12.17 | 2.97 |
| p-value | 0.8945 | 0.9097 | <0.0001 | - | - | 0.0435 | - | 0.0012 | - | - | 0.0197 | ||||
| 13 | B | - | - | -3.512 | - | - | 1.433 | - | -0.463 | - | - | 5.194 | 0.646 | 19.13 | 2.9 |
| p-value | - | - | <0.0001 | - | - | 0.0182 | - | 0.0008 | - | - | 0.013 | ||||
| 14 | B | - | - | -2.57 | - | - | - | - | -0.209 | - | - | - | 0.538 | 25.68 | 3.24 |
| p-value | - | - | <0.0001 | - | - | - | - | 0.0235 | - | - | - | ||||
| 15 | B | - | - | -2.182 | - | - | - | - | - | - | - | - | 0.481 | 41.67 | 3.39 |
| p-value | - | - | <0.0001 | - | - | - | - | - | - | - | - | ||||
| 16 | B | - | 0.232 | -4.943 | - | 2.512 | 1.706 | - | - | -0.446 | - | 2.995 | 0.809 | 28.33 | 2.81 |
| p-value | - | 0.4443 | <0.0001 | - | 0.005 | 0.0178 | - | - | 0.0019 | - | 0.1527 | ||||
| 17 | B | - | - | -5.061 | - | 2.517 | 1.723 | - | - | -0.405 | - | - | 0.795 | 40.82 | 2.84 |
| p-value | - | - | <0.0001 | - | 0.0055 | 0.0175 | - | - | 0.0026 | - | - | ||||
| 18 | B | - | - | -4.303 | - | 2.869 | 1.553 | - | - | - | - | - | 0.745 | 41.95 | 3.13 |
| p-value | - | - | <0.0001 | - | 0.0039 | 0.0487 | - | - | - | - | - | ||||
Stand health indicators, like Sr of pine trees, were also significant in predicting V. When only Sr was used in the regression model (Model 4 - Tab. 3), it explained 37% of V variation. When only Dq, Hq and CW were used, they managed to explain 81% of V variation (Model 5 - Tab. 3).
The next models were developed to clarify significant predictors to Dq variation. When LAT, Hq, survival rate and DEF were used in the regression model, the highest share (93%) of variation was due to Dq (Model 6 - Tab. 3). Excluding non-significant competition indices from the model made LAT a significant predictor, though the explained variation remained almost the same at 92.8% (Model 7 - Tab. 3). Geographical origin (expressed by LAT and LONG) were both significant, explaining 70% of Dq variation (Model 8 - Tab. 3). The effect of health parameters, i.e., survival rate and mean defoliation (DEF) on Dq was less significant, accounting for up to 63 % of variation (Models 10 and 11 - Tab. 3). The least significant predictor was Hq, which resulted to explain 56 % of Dq variation (Models 9 and 10 - Tab. 3).
Multiple linear regression analysis also clarified that the most important SR predictors are Dq, Hcb, Cha, and DEF that explained 81% of Sr variation (Model 16 - Tab. 3). Due to the collinearity between LAT and LONG of provenance origin and its Dq, the location of origin becomes insignificant in the final multiple regression model. Exclusion of CIPRZ and LAT, that were non-significant in the previous model, decreased the share of explained variation to 79.5% only (Model 17 - Tab. 3). When only stand-level parameters were used indicating tree size Dq, Hcb and Cha, 74.5% of Sr variation was explained (Model 18 - Tab. 3).
The results showed that only LONG significantly influenced the Sr accounting for 27.5% of its variation. Despite the obtained significant relationships, the origin of provenance lost its significant effect on both parameters of pine provenance health DEF and Sr. Also, no significant effect was established between Sr and CIs. Finally, Sr had a significant effect mainly on mean stand values of considered pine provenances, however, this effect is controversial. Higher Sr resulted in higher V of the provenances but lower Dq. Finally, no significant effect of Sr was detected on Hq, yet there is a positive effect on Hcb and CW.
Ranking of Scots pine provenances
Ranking of Scots pine provenances based on tree breeding indices (Tab. 4) showed that the provenances (39) Cierkasy, (27) Mogilov, (48) Kostroma (Transcarpathian), (38) Sumsk, (24) Elva, (54) Tambov, (29) Gomel and (55) Voronez previously identified as best performing by Abraitis & Ericsson ([3]) were later outcompeted by other provenances at 39 years, failing to retain the same growth intensity past the initial 22 years of growth. Their breeding indices based on volume growth ranged from 0.847 to -0.082. The top five provenances had breeding index ranging between 2.296 and -1.491, and included the following provenances: (52) Orlov, (1) Kazlu ruda, (41) Smolensk, (49_2) Kaluga and (19) Leningrad. Contrarily, the lowest performance were shown by the following provenances: (16, C-17) Karelia, (67) udmurtia and (4) Archangelsk, with their breeding index ranging from -1.800 to -2.437.
Tab. 4 - Ranking of Scots pine provenances regarding the breeding indices, based on: (V) volume of growing trees, in m3 ha-1; (Sr) survival rate, in %; (Hq) mean height, in m; (Dq) mean diameter, in m; (all) summed V, Sr, Hq and Dq values of breeding indices. (*): best Scots pine provenances as previously indicated by Abraitis & Ericsson ([3]), based on volume of growing trees (m3 ha-1) breeding index.
| Rank | Prov. | Country | Region | Breeding index | Rank | Prov. | Country | Region | Breeding index | ||||||||
|---|---|---|---|---|---|---|---|---|---|---|---|---|---|---|---|---|---|
| V | S r | H q | D q | All | V | S r | H q | D q | All | ||||||||
| 1 | 52 | RUS | Orlov | 2.296 | 0.276 | 0.019 | 0.005 | 2.595 | 25 | 50 | RUS | Ryazan | -0.010 | 0.147 | -0.017 | -0.032 | 0.089 |
| 2 | 1 | LTU | Kazlu Ruda | 1.796 | 0.294 | 0.030 | -0.020 | 2.100 | 26 | 38 | RUS | Sumsk* | 0.096 | -0.122 | 0.028 | 0.036 | 0.039 |
| 3 | 41 | RUS | Smolensk | 1.825 | 0.032 | 0.046 | 0.043 | 1.947 | 27 | 42 | RUS | Kalinin | 0.008 | 0.000 | -0.002 | 0.000 | 0.007 |
| 4 | 49_2 | RUS | Kaluga | 1.491 | 0.107 | 0.030 | 0.014 | 1.641 | 28 | 24 | EST | Elva* | 0.038 | -0.081 | 0.017 | 0.023 | -0.004 |
| 5 | 19 | RUS | Leningrad | 0.901 | 0.281 | 0.001 | -0.036 | 1.146 | 29 | 25 | LVA | Jaunjelgava | 0.026 | -0.067 | 0.017 | 0.016 | -0.009 |
| 6 | M2 | LTU | Mazeikiai | 0.858 | 0.122 | 0.008 | -0.002 | 0.986 | 30 | 54 | RUS | Tambov* | -0.082 | 0.064 | -0.013 | -0.018 | -0.049 |
| 7 | 22 | RUS | Pskov | 0.786 | 0.109 | 0.035 | -0.016 | 0.914 | 31 | 51 | RUS | Bryansk | -0.107 | 0.048 | -0.008 | -0.018 | -0.085 |
| 8 | 29 | BLR | Gomel* | 0.847 | -0.011 | 0.039 | 0.023 | 0.898 | 32 | 23 | RUS | Novgrod | -0.182 | 0.077 | -0.008 | -0.027 | -0.140 |
| 9 | 46 | RUS | Gorky | 0.727 | 0.066 | 0.005 | 0.009 | 0.807 | 33 | 28 | BLR | Vitebsk | -0.195 | 0.037 | -0.002 | -0.020 | -0.180 |
| 10 | 27 | RUS | Magilov* | 0.722 | 0.037 | 0.037 | 0.002 | 0.798 | 34 | 49_1 | RUS | Kaluga | -0.304 | -0.045 | 0.005 | -0.002 | -0.345 |
| 11 | 37 | UKR | Kijev | 0.802 | -0.119 | 0.037 | 0.066 | 0.785 | 35 | 21 | RUS | Pskov | -0.371 | -0.002 | 0.001 | -0.018 | -0.390 |
| 12 | 30 | BLR | Gardin | 0.774 | -0.065 | 0.030 | 0.045 | 0.785 | 36 | 48 | RUS | Kostroma* | -0.686 | 0.195 | -0.051 | -0.059 | -0.601 |
| 13 | 2 | LTU | Kazlu Ruda | 0.594 | 0.041 | 0.028 | -0.002 | 0.660 | 37 | C-44 | RUS | Vladimir | -0.602 | 0.034 | -0.022 | -0.029 | -0.619 |
| 14 | 36 | UKR | Lvov | 0.684 | -0.144 | 0.039 | 0.072 | 0.651 | 38 | 59 | RUS | Ulyanovsk | -0.668 | -0.210 | 0.010 | 0.048 | -0.820 |
| 15 | 45 | RUS | Gorky | 0.472 | 0.100 | 0.003 | -0.011 | 0.563 | 39 | 57 | RUS | Penza | -0.704 | -0.149 | -0.002 | 0.020 | -0.833 |
| 16 | 43 | RUS | Moscow | 0.311 | 0.213 | -0.013 | -0.036 | 0.475 | 40 | 15 | RUS | Karelia | -0.880 | 0.005 | -0.035 | -0.029 | -0.940 |
| 17 | 26 | LTU | Prienai | 0.411 | 0.059 | 0.008 | -0.004 | 0.473 | 41 | 9 | RUS | Vologda | -0.964 | -0.043 | -0.029 | -0.025 | -1.059 |
| 18 | 55 | RUS | Voronez* | 0.368 | -0.081 | 0.026 | 0.034 | 0.346 | 42 | 68 | RUS | Tver | -1.248 | -0.058 | -0.042 | -0.029 | -1.378 |
| 19 | M3 | LTU | Mazeikiai | 0.250 | 0.064 | 0.003 | -0.009 | 0.308 | 43 | 66A | RUS | Tver | -1.221 | -0.217 | -0.031 | 0.036 | -1.432 |
| 20 | 47 | RUS | Kostroma | 0.173 | 0.159 | -0.026 | -0.022 | 0.283 | 44 | 69 | RUS | Baskiria | -1.676 | -0.259 | -0.029 | 0.023 | -1.941 |
| 21 | 33 | UKR | Rovno | 0.275 | -0.095 | 0.021 | 0.039 | 0.240 | 45 | 16 | RUS | Karelia | -1.800 | -0.095 | -0.063 | -0.047 | -2.004 |
| 22 | 39 | RUS | Cerkasy* | 0.187 | -0.074 | 0.001 | 0.034 | 0.147 | 46 | C-17 | RUS | Karelia | -1.908 | -0.031 | -0.067 | -0.074 | -2.081 |
| 23 | M1 | LTU | Mazeikiai | 0.112 | -0.043 | 0.005 | 0.018 | 0.093 | 47 | 67 | RUS | udmurtia | -1.902 | -0.305 | -0.013 | 0.023 | -2.196 |
| 24 | 65 | RUS | Tarty | 0.117 | -0.063 | 0.019 | 0.018 | 0.091 | 48 | 4 | RUS | Archangelsk | -2.437 | -0.189 | -0.074 | -0.061 | -2.761 |
The highest breeding indices based on survival, were estimated for provenances (1) Kazlu Ruda, (19) Leningrad, and (52) Orlov and were equal to 0.294, 0.281 and 0.276, respectively. In contrast, the lowest indices were calculated for provenances (68, 66A) Tver, (69) Baskiria and (67) Udmurtia, which showed breeding index of - 0.217, -0.259 and -0.305, respectively.
Provenances from (29) Gomel and (27) Magilov, previously identified as the best performing by Abraitis & Ericsson ([3]), were among the top five provenances along with (41) Smolensk, (36) Lvov and (37) Kijev when the breeding index was calculated based on mean height, with values ranging from 0.046 to 0.037. The lowest values ranging from -0.051 to -0.074 were estimated for provenances from (48) Kostroma, (16, C-17) Karelia and (4) Archangelsk.
In terms of highest mean diameter, the highest breeding indices were found for provenances from (36) Lvov, (37) Kijev, (59) Ulyanovsk and (30) Gardin, with values of 0.072, 0.066, 0.048, 0.045, respectively. Meanwhile, the lowest indices were found fro provenances from (43) Moscow, (16, C-17) Karelia, (48) Kostroma, and (4) Archangelsk (-0.036, -0.047, -0.059, -0.061, -0.074, respectively).
The final ranking of Scots pine provenances was calculated by summing up the values of all indices. Overall, the top ten performing provenances were (52) Orlov, (1) Kazlu Ruda, (41) Smolensk, (49_2) Kaluga, (19) Leningrad, (M2) Mazeikiai, (22) Pskov, (29) Gomel, (46) Gorky and (27) Magilov. Only two provenances, namely (29) Gomel and (27) Magilov. remained in the initial top 10 best performing provenances after additional 17 years of growth since the original experiment.
Discussion
Climate change has already impacted on forest ecosystems and further changes of such magnitude are anticipated to cause local extinction events, leading to the loss of important species for functions and services, as well as to reduced forest carbon stocks or sequestration capacity ([40]). During the last years, Scots pine forests suffered a mass withering and dieback across eastern Europe ([43]). Ozolinčius et al. ([29]) analysed scenarios of climate change up to the end of XXI century in Lithuania and come to the conclusion that growing conditions will become less suitable for the two major conifer tree species like Norway spruce and Scots pine, due to increased temperatures and various biotic and abiotic factors. Thus, planning in advance is the most appropriate measure to cope with these changes ([7]).
Scots pine is a highly adaptable tree species ([38]) growing under a wide range of climatic conditions. Its native range spans from Western Europe to Eastern Siberia, the Caucasus Mountains and Anatolia in the south, the Fennoscandian part of the Arctic Circle in the North. Due to its adaptability and wide industrial application, many progeny trial studies have taken place to select the most productive Scots pine provenances from select populations of various origins, such as the Prokazin type series trials ([41]).
Our results on the productivity of various pine populations confirmed previous findings that seeds transferred northward in medium distances show better or similar performance in terms of productivity when tested against provenance of local origin ([49], [5]). On the other hand, seeds transferred from northern populations to far south, show poor performance in productivity compared to local seeds ([20], [25], [42]).
Berlin et al. ([6]) stated that survival is one of the most important factors indicating provenance’s ability to adapt to new environmental conditions. The results presented in Fig. 3a and Fig. 3b show that Lithuanian populations were among the most resistant regarding the latitude direction. Yet, local populations demonstrated lower survival rates compared to those populations originating from latitudes between 30° and 40° E. However, the survival rates for the populations introduced from the Far East were very low. Shutaev & Giertych ([41]) stated that populations from the Northwestern region (Fennoscandia) generally have very good survival rates but low performances in height and diameter. According to the authors, populations from the Baltic region show good height and diameter growth, but showing only average survival rates. Provenances from the Eastern continental region (Belarus and Ukraine) as well as from central regions of European Russia showed great results regarding diameter and height growth, but score relatively poorly in survival rate. Also, the authors found only a few pine provenances that could be easily grown in other regions.
However, other authors, such as Govindarajulu ([15]), stated that Scots pine could show significant genetic variation even at very short geographical distances. The growth and adaptability of different Scots pine populations depends very much on their acquired genetic traits ([28], [1]). Our findings indicate that the geographical origin of pine provenances, expressed by their longitude and latitude, through their direct effect on main yield parameters of pine provenances and indirect effect on the survival rate of trees, is the key factor that defines the level of adaptive capacity of pine populations.
Estimation of breeding indices showed that most of Scots pine provenances that were identified as best performing by Abraitis & Ericsson ([3]), lost their positions at age 39. This could be related to several reasons. First, Scots pine provenances, originating from different regions, have different growth rate at different ages and their volume increment culminates later ([5]), though research performed by Jansons et al. ([22]) did not confirmed these findings. Therefore, some provenances that demonstrated slower growth until age 17, started growing faster from 17 to 39 years of age. The other reason could to be related to climate change. According to Augustaitis et al. ([4]), long-term mean annual temperature changed between +4.6 °C in 1987 and +8.5 °C in 2008, and the annual precipitation during the same period changed from 450 mm in 1976 to 840 mm in 2010. Also, Linkevičius et al. ([26]) using a standardized precipitation evapotranspiration index for the 1985-2013 period, integrated over six months, came to conclusion that the water-balance effect on tree ring formation shifted towards the negative side in the analyzed period, indicating the increasingly negative consequences of droughts. However, southern provenances, unlike eastern, western, northern, or central provenances, did not show a significant reduction of growth due to drought ([26]). Yet, this does not explain why the southernmost provenances from (48) Kastroma, (39) Cierkasy, (38) Sumsk, (55) Voronez and (54) Tambov identified as best performers by Abraitis & Ericsson ([3]) were later overtaken by provenances which originate from regions only slightly farther north, e.g., (52) Orlov, (41) Smolensk and (49_2) Kaluga (Fig. 2). Repo et al. ([36]) found that frost hardiness of stems and needles was initiated earlier among northern provenances than in southern ones, while the maximum hardening potential was a limiting factor for south-to-north provenance transfer, due to differences in frost hardening timing. Therefore, it can be hypothesized that southwestern populations previously identified as the best performers by Abraitis & Ericsson ([3]) suffered from spring and autumn frost damage the most, thus losing their overall growth potential in the long term.
The variation in the ranking of provenances over time based on their growth performances is poorly described in the literature because long-term investigations are needed. However, Jansons & Baumanis ([21]) while studying Scots pine provenances of Russian, Ukrainian, Polish and Eastern Germany origins came to conclusion that the variation in their ranking can be considerable. For example, provenance Niesky in Liepaja at the age of 15 years was ranked in 26th place and at the age of 28 years at the 3rd place. However, Scots pine provenance Rytel of Polish origin demonstrated rather stable growth and increased its positions from third to the first in the same period. Another polish provenance Rychtal dropped from 12-th to 45-th position in the same period. Provenance Kiev from Ukraine showed very poor and stable performance while the provenance Borisov from Belarus shifted in ranking from the 5-th to the 10-th position. As a consequence, we recommend the evaluation of Scots pine provenances to be always based on long term investigations.
It is worth to highlight the limitations of this study. While performing ranking of Scots pine provenances, data from Venta test plantation, formerly evaluated by Abraitis & Ericsson ([3]) was not available anymore, therefore the data from Kazlu Ruda (Jure) test plantation was used. However, both the abovementioned test plantations belong to the same Prokazyn program and were established during the same period by applying common methods also used in the Prokazyn series test plantations. Additionally, it should be highlighted that due to exclusion and separate analysis of one test plantation from Prokazyn series, our experiment in Kazlu Ruda lacks true experimental design with necessary replications for this study. Moreover, since the repeated measurements were not done in time, we do lack data regarding the history of mortality and change in competition in plots.
We did not investigate about possible relationships between provenances by performing genetic distance analysis. Instead, we based all our analysis on latitude and longitude that describes the place of origin. Thus, further research on this topic will be necessary, possibly using other provenances previously unavailable for this study, which could show even better growth indices. In this study only Eastern European Scots pine provenances were considered, whereas future research should also include Scots pinr provenances from Scandinavia, Germany or Poland. Therefore, the findings of this study should be taken as the basis of further research or implementation in silvicultural practices.
Conclusions
The results of growth performances of 48 Scots pine provenances after 39 years of growth showed that most of the introduced provenances were outperformed by local Lithuanian provenances in terms of growth or survival performance indices. Indeed, some provenances from Russian (67) Udmurtia, (16, C-17) Karelia, (4) Archangelsk or (69) Baskiria regions, have shown remarkably lower survival and productivity rates when compared to local Lithuanian provenances.
A clear effect of latitude and longitude of the site of origin on the mean stand performance values of Scots pine provenances was found. With increasing latitude, mean tree height, mean quadratic diameter and the tree volume per hectare had a clear decreasing tendency. Except for the mean squared diameter, the longitude of the site of origin affected both the mean stand height and the tree volume per hectare.
Different physiological adaptation of Scots pine provenances to the local environmental conditions of Lithuania may reflect local selective pressure on plant traits, including growth and survival.
Ranking of Scots pine provenances based on breeding indices showed that provenances originally identified as the most productive by Abraitis & Ericsson ([3]) did not maintain the same high growth rates after 39 years of growth. In the 17 years of growth following the original assessment, except for (29) Gomel and (27) Magilov, most provenances were not listed among the best performers.
In case there had been a need to improve the genetic structure of the local pine population, it would be recommended to use planting material from the (52) Orlov, (41) Smolensk or (49_2) Kaluga regions. However, these recommendations are rather limited since the experiment is incomplete, as Scots pine only reach maturity at 100 years of age.
Acknowledgments
The authors would like to express their gratitude to Dr. Julius Danusevičius and Prof. Darius Danusevičius for their great effort in establishing and managing the experimental plantation used in this study. The authors also would like to express their gratitude to the anonymous reviewers for their valuable and constructive comments.
References
Gscholar
Gscholar
Gscholar
CrossRef | Gscholar
Gscholar
Gscholar
Gscholar
Gscholar
Gscholar
Gscholar
Gscholar
Gscholar
Gscholar
Gscholar
Gscholar
Gscholar
Gscholar
Gscholar
Gscholar
Gscholar
Authors’ Info
Authors’ Affiliation
Giedrius Šidlauskas 0009-0001-6262-4498
Almantas Kliučius 0000-0001-9135-766x
Marius Mikalajunas
Diana Sidabriene
Paulina Andriuškevičiute
Algirdas Augustaitis 0000-0003-3938-3611
Vytautas Magnus university, Agriculture Academy, Faculty of Forest Sciences and Ecology, Studentu 13, Akademija, LT-53362 Kaunas distr. (Lithuania)
Lithuanian Research Centre for Agriculture and Forestry, Instituto al. 1, Akademija, LT-58344 Kedainiai (Lithuania)
Corresponding author
Paper Info
Citation
Linkevičius E, Šidlauskas G, Kliučius A, Armoška E, Mikalajunas M, Sidabriene D, Andriuškevičiute P, Augustaitis A (2024). The growth dynamics of East European Scots pine (Pinus sylvestris L.) populations - a Lithuanian field trial. iForest 17: 59-68. - doi: 10.3832/ifor4359-016
Academic Editor
Andrea Cutini
Paper history
Received: Apr 07, 2023
Accepted: Nov 28, 2023
First online: Mar 06, 2024
Publication Date: Apr 30, 2024
Publication Time: 3.30 months
Copyright Information
© SISEF - The Italian Society of Silviculture and Forest Ecology 2024
Open Access
This article is distributed under the terms of the Creative Commons Attribution-Non Commercial 4.0 International (https://creativecommons.org/licenses/by-nc/4.0/), which permits unrestricted use, distribution, and reproduction in any medium, provided you give appropriate credit to the original author(s) and the source, provide a link to the Creative Commons license, and indicate if changes were made.

Web Metrics
Breakdown by View Type
Article Usage
Total Article Views: 2065
(from publication date up to now)
Breakdown by View Type
HTML Page Views: 1506
Abstract Page Views: 188
PDF Downloads: 343
Citation/Reference Downloads: 0
XML Downloads: 28
Web Metrics
Days since publication: 52
Overall contacts: 2065
Avg. contacts per week: 277.98
Article Citations
Article citations are based on data periodically collected from the Clarivate Web of Science web site
(last update: Feb 2023)
(No citations were found up to date. Please come back later)
Publication Metrics
by Dimensions ©
Articles citing this article
List of the papers citing this article based on CrossRef Cited-by.
Related Contents
iForest Similar Articles
Short Communications
Growth of Stone pine (Pinus pinea L.) European provenances in central Chile
vol. 10, pp. 64-69 (online: 29 August 2016)
Research Articles
Genetic variation and heritability estimates of Ulmus minor and Ulmus pumila hybrids for budburst, growth and tolerance to Ophiostoma novo-ulmi
vol. 8, pp. 422-430 (online: 15 December 2014)
Research Articles
Patterns of genetic variation in bud flushing of Abies alba populations
vol. 11, pp. 284-290 (online: 13 April 2018)
Research Articles
A fast screening approach for genetic tolerance to air pollution in Scots pine field tests
vol. 6, pp. 262-267 (online: 01 July 2013)
Research Articles
Comparison of range-wide chloroplast microsatellite and needle trait variation patterns in Pinus mugo Turra (dwarf mountain pine)
vol. 10, pp. 250-258 (online: 11 February 2017)
Research Articles
Impact of climate change on radial growth of Siberian spruce and Scots pine in North-western Russia
vol. 1, pp. 13-21 (online: 28 February 2008)
Research Articles
Genetic control of intra-annual height growth in 6-year-old Norway spruce progenies in Latvia
vol. 12, pp. 214-219 (online: 25 April 2019)
Review Papers
Indicators of drought effects in Pinus sylvestris: genetic analyses to corroborate the results of empirical methods
vol. 3, pp. 89-91 (online: 15 July 2010)
Research Articles
Bud flush phenology and nursery carryover effect of paper birch provenances
vol. 8, pp. 809-817 (online: 19 May 2015)
Research Articles
Juvenile growth response of European beech (Fagus sylvatica L.) to sudden change of climatic environment in SE European trials
vol. 2, pp. 213-220 (online: 22 December 2009)
iForest Database Search
Google Scholar Search
Citing Articles
Search By Author
- E Linkevičius
- G Šidlauskas
- A Kliučius
- E Armoška
- M Mikalajunas
- D Sidabriene
- P Andriuškevičiute
- A Augustaitis
Search By Keywords
PubMed Search
Search By Author
- E Linkevičius
- G Šidlauskas
- A Kliučius
- E Armoška
- M Mikalajunas
- D Sidabriene
- P Andriuškevičiute
- A Augustaitis
Search By Keyword


