Predicting the impacts of climate change on the distribution of Juniperus excelsa M. Bieb. in the central and eastern Alborz Mountains, Iran
iForest - Biogeosciences and Forestry, Volume 11, Issue 5, Pages 643-650 (2018)
doi: https://doi.org/10.3832/ifor2559-011
Published: Oct 04, 2018 - Copyright © 2018 SISEF
Research Articles
Abstract
In recent years, global climate change has had significant biological, temporal, and spatial effects on many terrestrial habitats. The objective of this study was to evaluate the effect of climate change on the geographic distribution of Juniperus excelsa and prioritize its habitats for protection against these effects until 2070. The study was conducted using the MaxEnt species distribution model and two data series GFDL-CM3 and MRI-CGCM3 under scenarios RCP2.6 and RCP4.5 of the 5th IPCC report. Our results revealed that elevation, minimum temperature of coldest month, precipitation of coldest quarter, annual mean temperature, and slope aspect, in that order, have the greatest effects on the species’ distribution in the study area. Under optimistic scenario RCP2.6, both models predicted that the species’ presence area will grow, but under RCP4.5, models predicted that by 2070, some parts of its habitat in western and central heights will be lost because of change in climate parameters like minimum temperature of coldest month and precipitation of coldest quarter. Under the latter scenario, the northeastern parts of the study area showed no changes in terms of climatic parameters and climatic niche. The results of both climate data series indicated that the Juniperus excelsa will slowly migrate to higher elevations to cope with the changing climate. Assessment of the results through field studies showed that outputs of GFDL-CM3 are closer to the reality.
Keywords
Juniperus excelsa, Climate Change, Irano-Turanian Forests, MaxEnt Model, Climatic Niche
Introduction
In recent years, there has been a growing attention from research community to the effects of global climate change on species and habitats ([4]). Climate change has exerted significant biological, spatial and temporal effects on terrestrial habitats ([6], [31]). In 2007, the Intergovernmental Panel on Climate Change (IPCC) reported that even in the most optimistic scenario, the past decades trend of rising carbon dioxide in the atmosphere will continue for several decades, and this is expected to have major effects on animal and plant species ([13]). In recent years, easy access to climate and species distribution data has simplified the use of Species Distribution Models (SDMs) in ecology research. These models relate the environmental parameters to the presence or absence of plant-animal species by the use of quantitative equations, which are then used to predict the species distribution in unsampled areas, the environmental changes and the resulting ecological consequences ([9], [15], [19], [29]). Researchers have developed several SDMs for assessing the response of plant communities ([14]), forest ecosystems ([7]) and individual species ([18]). SDMs can be classified into two categories: profile techniques and group discrimination techniques. Profile techniques, like BIOCLIM ([34]), Gower similarity or DOMAIN ([45]), GARP ([2]), Ecological niche factor analysis or BIOMAPPER ([24]) and MAXENT ([35]) use presence-only records. These methods are used when absence data is unavailable or unreliable. Group discrimination techniques use both present and absence records and are classified into two categories: (i) global models like GLM ([20]) and local models like MARS ([33]); and (ii) classification techniques, like CART ([45]) and GAM ([27]), which are known as “nonparametric” models ([46]). There have been numerous studies on the SDMs application to the assessment of plant species response to change in climate parameters. In a study by Khanum et al. ([26]), the effect of climate change on three species of medicinal plant Asclepiads in Pakistan was assessed by the MaxEnt model. In this study, three AOGCM models HadCM3, CCCMA and CSIRO scenario A2 were employed to predict the desirable habitat of these three species in 2050. The results of this study proved the good performance of the MaxEnt model in predicting the distribution of species, especially the rare ones. In a study by Remya et al. ([41]), the MaxEnt model was used to predict the proper distribution of Myristica dactyloides species in eastern India; prediction was made for the years 2050 and 2070 at a scale of 1 km by two different CMIP5 models GFDL-CM3 and NorESM1-M and with the help of MaxEnt model. The results revealed that variables influencing the species’ distribution are air temperature, annual precipitation and precipitation of the wettest month. It was also shown that by 2050 and 2070, the area of species distribution will shrink to some extent. The results also demonstrated the good performance of MaxEnt model for predicting climate change-induced habitat alteration and for planning conservation measures. Li et al. ([28]), studied the geographical boundaries of Pinus tabulaeformis in China using the MaxEnt model under 7 GCM models and four RCP scenarios. Their results revealed that Precipitation of Wettest Month (PWM), Annual Biological Temperature (ABT), Mean Temperature of Coldest Month (MTCM), Annual Mean Temperature (AMT), Precipitation of Driest Month (PDM), Cloudiness index (CL), Annual Precipitation (AP) and Mean Temperature of Warmest Month (MTWM) are the variables with the highest effect on P. tabulaeformis species in the area and explain 94.6% of changes.
Juniperus excelsa, commonly called Juniper, is one of the valuable tree species living in semi-arid mountains and harsh environments of the Irano-Turanian phytogeographic region ([42]). The species is also present in eastern Mediterranean, the Balkans, Turkey, and mountains of Iran, Afghanistan and Pakistan. In Iran, Juniper communities are present in the mountainous forests of the central Iranian plateau at the altitude of 1700 to 2800 (3400 in the southern regions) m a.s.l. ([39]). Zohary ([51]) argued that current Juniper communities of Iran are remnants of vast forests formerly covering this region, which have been reduced due to anthropogenic factors, climate conditions and erosion of mountain areas. Among various Juniperus species in Iran, J. excelsa has the highest frequency and is sensitive to environmental changes, especially climatic variations ([36]). J. excelsa is also one of the most important forest species in terms of soil conservation ([12]), as its communities, whether in pure or mixed populations, are located in soils with heavier textures and higher water saturation than other forest communities in the Irano-Turanian region ([38]). According to the IUCN Red List ([25]), J. excelsa is classified into the category of Least Concern, but Iranian environmental protection organization claims that J. excelsa forests are endangered and rapidly shrinking, especially in the southern slopes of the Alborz Mountains. In addition, local residents extract various parts of this plant for economic purposes. Thus, considering the importance of J. excelsa in soil conservation and biodiversity, its future distribution in the Alborz Mountains is worthy of attention. Knowing the future distribution of these species, the preservation measures aimed at preventing further loss of habitat and controlling the risk of desertification can be planned with greater accuracy. The goal of this study was therefore to determine the geographical distribution of J. excelsa in an important part of its habitat in Iran at present and in the future using the results of climate models under forecasted scenarios RCP 2.6 and RCP4.5.
Material and methods
Study area
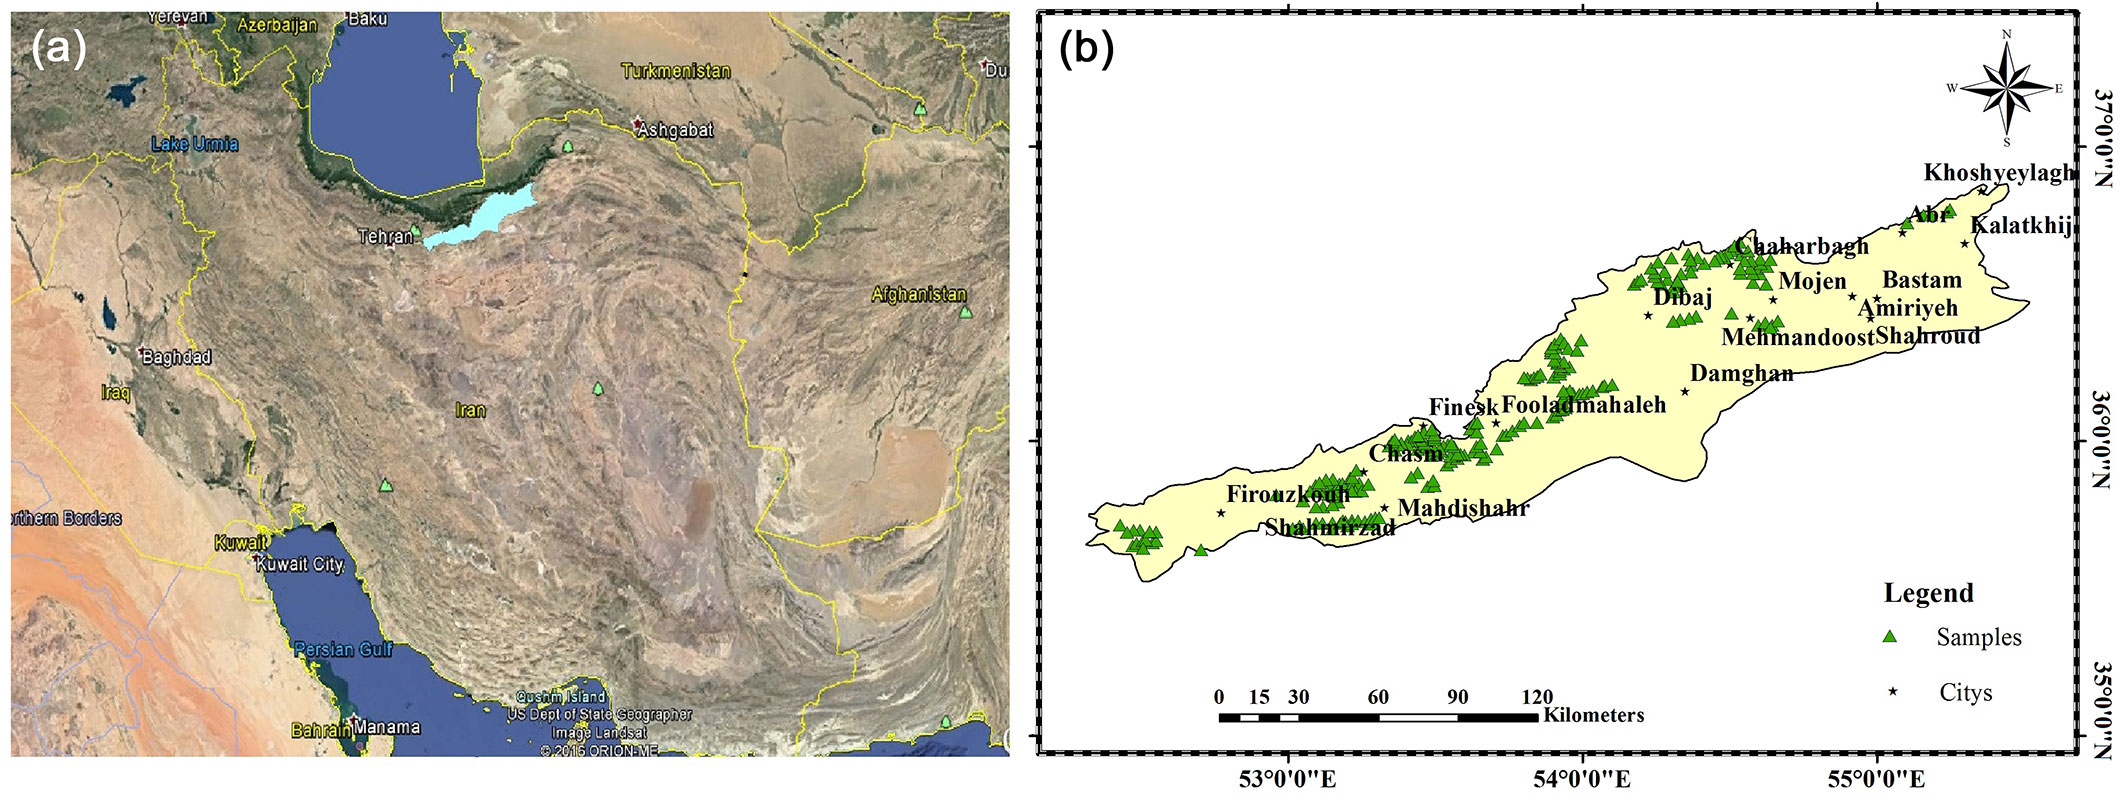
The study area encompasses the southern slopes of the eastern Alborz Mountains (between 35° 31′ - 36° 52′ N and 52° 31′- 55° 26′ E) in Semnan and Tehran provinces, located in the center-north parts of Iran, and has an area of 14.656.14 km2 (Fig. 1). The elevation ranges between 996 and 3861 m a.s.l. and its annual mean temperature varies between 1.1 and 16 °C. In terms of vegetation cover, the study area is located in the Irano-Turanian phytogeography region with tree and shrub species distributed at elevations between 1000 and 3000 m a.s.l. ([42]). J. excelsa is present at elevations between 1800 to 2800 m a.s.l. and Pistacia atlantica and Amygdalus spp. communities can be found at elevations between 1300-1800 m a.s.l. ([40]). According to the De Martonne’s aridity index (I), this area falls into the arid and semi-arid class with 5>I>21. A climatograph of the study area is shown in Fig. S1 (Supplementary material).
Fig. 1 - (a) Location of the study area (light blue) in Iran. (b) Geographic distribution of sampling sites (green triangles) within the study area.
Sampling
First, the population of J. excelsa in the study area was identified by satellite images and field studies; then this population was divided into several homogeneous subpopulations in terms of physiographic factors such as slope, aspect, and altitude. The maps of slope, aspect and altitude were overlaid and maximum effort was made to select at least one presence site in different environmental combinations (homogenous classes resulting from physiographic parameters). For a sufficiently powerful analysis, the ratio of the number of sites to the number of predictor variables should be at least 0.1, although this value is also affected by the spatial correlation ([30]). Finally, 240 J. excelsa presence sites with spatial scale of 30 arc-seconds (~ 900 × 900 m) were selected and used as model input.
Environmental variables
Nineteen substantial bioclimatic variables for J. excelsa habitat were selected from the WorldClim database (⇒ http://www.worldclim.org/bioclim - [23]). These variables have been derived from monthly temperature and precipitation parameters over the period of 1950-2000 and are closely associated with growth and development of species, thus they are widely used in the assessment of species distribution ([10], [17], [47]). To verify the accuracy of acquired data, the variable “Monthly Mean Temperature” was compared with 50-year records from meteorological stations located in the study area. Statistics and information of selected synoptic stations (4 stations) were collected from Iran Meteorological Organization. Kendall’s Tau-b coefficient of correlation between observed data and Worldclim data was calculated. In all stations, the results showed correlations of more than 0.9, which confirmed the suitability of Worldclim data for the present study.
In addition to bioclimatic data, layers such as slope and aspect were produced from a digital elevation model (DEM) with resolution of 90 m. This model was downloaded from the USGS website (⇒ https://www.usgs.gov/) and then resampled by ArcGIS® ver. 10.2 (ESRI, Redlands, CA, USA) to a spatial scale of 30 arc-seconds (~900 m - Tab. 1). The model input variables were selected using Pearson’s correlation coefficients (± 0.8 - [37]) and PCA ([5]) methods according to ecological significance of variables for the species. Pearson’s correlation coefficients and PCA were determined by inter-variable analysis with statistical software SPSS® ver. 23 (IBM, Armonk, NY, USA). Climate data to be used for prediction was collected from WorldClim database available from CMIP5 (IPPC Fifth Assessment) for the years 2050 (average of 2041-2060 period) and 2070 (average of 2061-2080 period). This data has been predicted using 19 GCM models under four greenhouse gas concentration scenarios known as Representative Concentration Pathways (RCPs). In this study, the climate models GFDL-CM3 (Geophysical Fluid Dynamics Laboratory version 3) developed by NOAA (National Oceanic and Atmospheric Administration) and MRI-CGCM3 developed by MRI (Meteorological Research Institute) were used under scenarios RCP2.6 and RCP4.5. MRI-CGCM3 is an improved version of MRI-CGCM2 and is composed of atmosphere-land, aerosol, and ocean-ice models and a subset of the MRI’s earth system model MRI-ESM1 ([50]). Scenario RCP 2.6 represents an optimistic conditions with peak radiative forcing of about 3 w m-2 (~490 ppm CO2-eq) before 2100 followed by a decline to 2.6 w m-2. Scenario RCP 4.5 represents a more moderate projection with stabilization of radiative forcing at 4.5 w m-2 (~650 ppm CO2-eq) by 2100 ([50]).
Tab. 1 - Input variables for the MaxEnt model and the percentage contribution (%) and permutation importance (%) of each variable. (*): Variables selected after Pearson’s correlation analysis and used in modeling; (CV): coefficient of variation.
| No | Code | Environmental variables |
Unit | Percentage contribution (%) |
Permutation importance (%) |
|---|---|---|---|---|---|
| 1 | Bio1* | Annual mean temperature | °C | 6.7 | 3.5 |
| 2 | Bio2 | Mean diurnal range (mean of monthly max and min temperature) | °C | - | - |
| 3 | Bio3* | Isothermality ([Bio2/Bio7] × 100) | - | 1 | 1.3 |
| 4 | Bio4 | Temperature seasonality (standard deviation × 100) | CV | - | - |
| 5 | Bio5* | Maximum temperature of warmest month | °C | 0.9 | 0.1 |
| 6 | Bio6* | Minimum temperature of coldest month | °C | 26.9 | 0.6 |
| 7 | Bio7 | Temperature annual range (Bio5-Bio6) | °C | - | - |
| 8 | Bio8* | Mean temperature of wettest quarter | °C | 1.7 | 5 |
| 9 | Bio9 | Mean temperature of driest quarter | °C | - | - |
| 10 | Bio10 | Mean temperature of warmest quarter | °C | - | - |
| 11 | Bio11 | Mean temperature of coldest quarter | °C | - | - |
| 12 | Bio12* | Annual precipitation | mm | 3.4 | 3.6 |
| 13 | Bio13* | Precipitation of wettest period | mm | 0.1 | 1 |
| 14 | Bio14 | Precipitation of driest period | mm | - | - |
| 15 | Bio15* | Precipitation seasonality (CV) | CV | 1.1 | 2.4 |
| 16 | Bio16 | Precipitation of wettest quarter | mm | - | - |
| 17 | Bio17 | Precipitation of driest quarter | mm | - | - |
| 18 | Bio18* | Precipitation of warmest quarter | mm | 0.7 | 8.2 |
| 19 | Bio19* | Precipitation of coldest quarter | mm | 15.9 | 16.5 |
| 20 | DEM* | Elevation | m | 35.2 | 54.2 |
| 21 | Aspect* | Geographic aspects (9 categories) | - | 1.7 | 0.6 |
| 22 | Slop | Slope | % | 4.8 | 3 |
MaxEnt model
MaxEnt ([35]) is a machine-learning model for predicting the species’ potential distribution using the environmental information and the species’ presence data ([11]). This model can use both continuous and categorical data and can incorporate interactions between different variables ([35]). Studies have shown that MaxEnt can well compete with highly accurate prediction methods, even when sample size is small ([3]). This model was run for the present and future (2050-2070) distributions. When constructing the model, 75% of data (selected at random) was used for training and the remaining 25% was used as test data; the maximum number of background points was set to 10.000, the number of iterations was set to 15, and the remaining settings were left at their default values ([48]). MaxEnt model was evaluated by using the area under the receiver operating characteristic (ROC) curve (AUC), True Skill Statistic (TSS) test and Kappa test ([1]). While generating response curves, the MaxEnt model estimates the relative effect of each predictor ([26]). Species’ presence potential was classified using the four probability classes defined by Yang et al. ([48]): least potential (<0.2), moderate potential (0.2-0.4), good potential (0.4-0.6) and high potential (>0.6).
Results
Current distribution of Juniperus excelsa
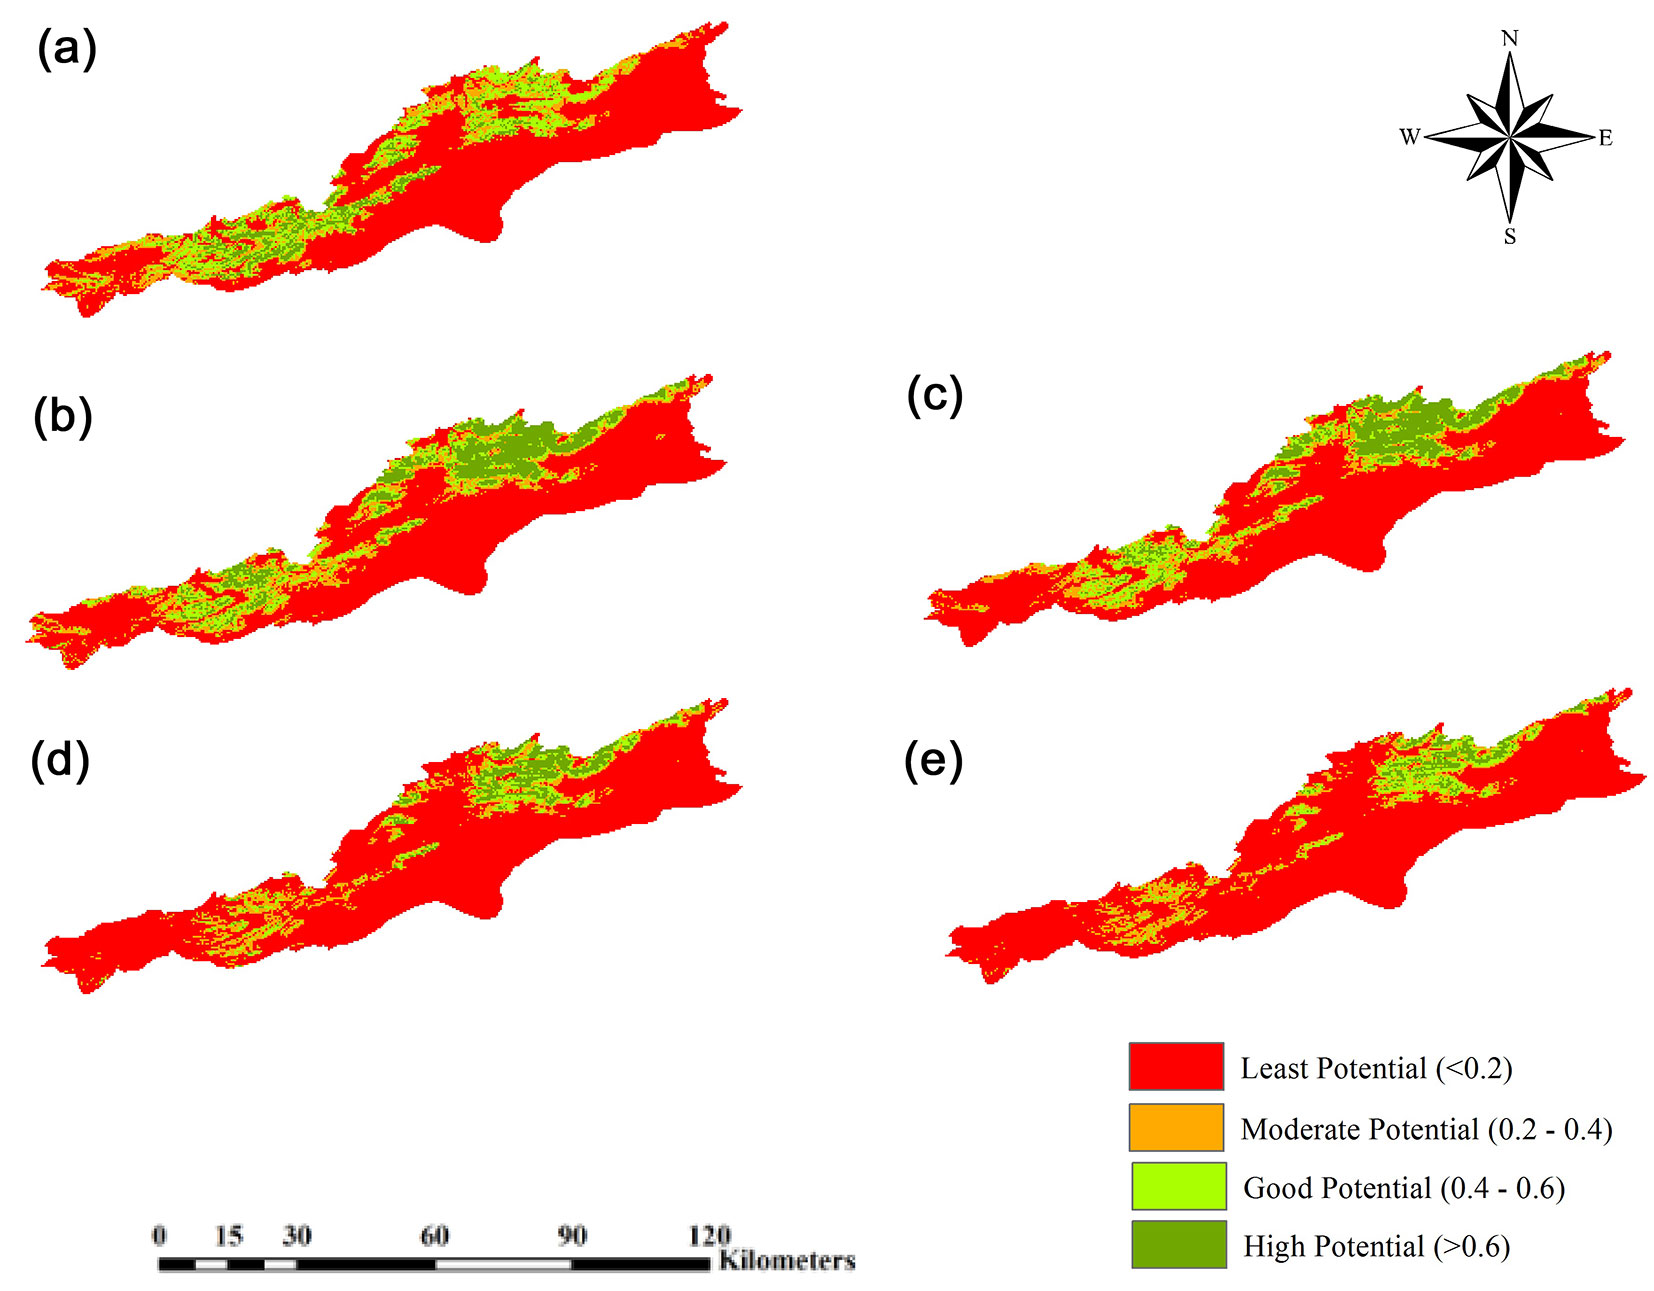
According to the results obtained from the model (Tab. 1), about 90% of the current distribution of the species was explained by 5 variables: (i) elevation (35.2%); (ii) minimum temperature of coldest month (26.9%); (iii) precipitation of coldest quarter (15.9%); (iv) annual mean temperatures (6.7%); and (v) slope (4.8%). The species’ response curves for these 5 variables are plotted in Fig. S2 (Supplementary material). The evaluation results (AUCmean = 0.948, TSS = 0.781 and Kappa = 0.402) indicate the excellent, very good and moderate performance of MaxEnt model in estimating the distribution of J. excelsa, respectively. According to the map of species’ presence potential (Fig. 2), 963.33 km2 of the study area have a low potential, 199.67 km2 have a moderate potential, 206.63 km2 have a good potential, and 95.99 km2 have a high potential in this respect.
Fig. 2 - Distribution of Juniperus excelsa by GFDL-CM3 Model. (a): Current potential distribution of Juniperus excelsa; (b): future potential distribution in 2050 under RCP2.6; (c): future potential distribution in 2070 under RCP2.6, (d): future potential distribution in 2050 under RCP4.5; (e): future potential distribution in 2070 under RCP4.5.
Future distribution of Juniperus excelsa by GFDL-CM3 Model
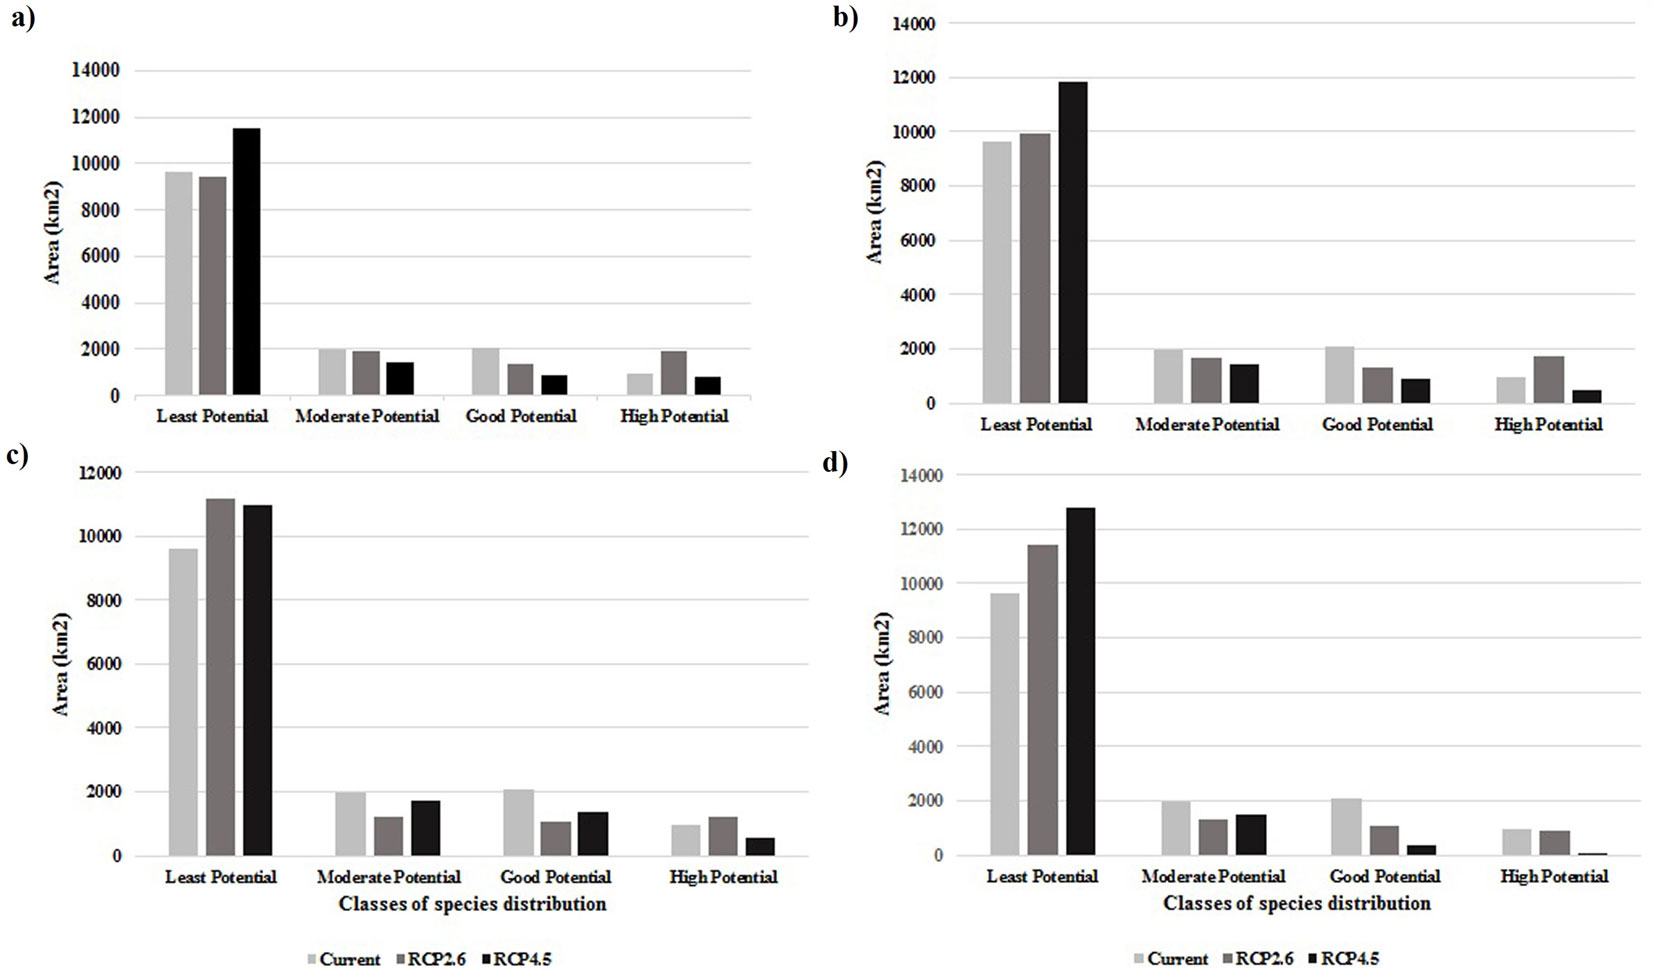
The distribution pattern in the years 2050 (average of 2041-2060 period) and 2070 (average of 2061-2080 period) was estimated using the GFDL-CM3 and scenarios RCP2.6 and RCP4.5. The results showed that under the optimistic scenario RCP2.6, a broader distribution of J. excelsa is predicted by the years 2050 and 2070, particularly in high potential class, for which the area will be 937.17 km2 (or 6.4% higher than the current area - Fig. 3). The results of GFDL-CM3 under RCP4.5 scenario predicted a decrease in the species’ distribution area, particularly in the western and northern parts of the study area (eastern Tehran and northern Semnan, respectively), and that by 2070, distribution of J. excelsa will be limited to eastern Alborz (northeastern Semnan - Fig. 2). Fig. 3 shows an increase by more than 15% (2229.12 km2) in areas with low species presence potential, which means that climate change effects will lead to the replacement of currently suitable habitats with low potential ones. According to the results, by 2070 the current area of good potential habitats will be reduced by 8% (1185.03 km2) and that of high potential habitats will be reduced by 3% (494.1 km2).
Fig. 3 - Comparison of Juniperus excelsa distribution in current and future situations. (a): Under GFDL-CM3 data in 2050; (b): under GFDL-CM3 data in 2070; (c): under MRI-CGCM3 data in 2050; (d): under MRI-CGCM3 in 2070.
Future distribution of Juniperus excelsa by MRI-CGCM3 model
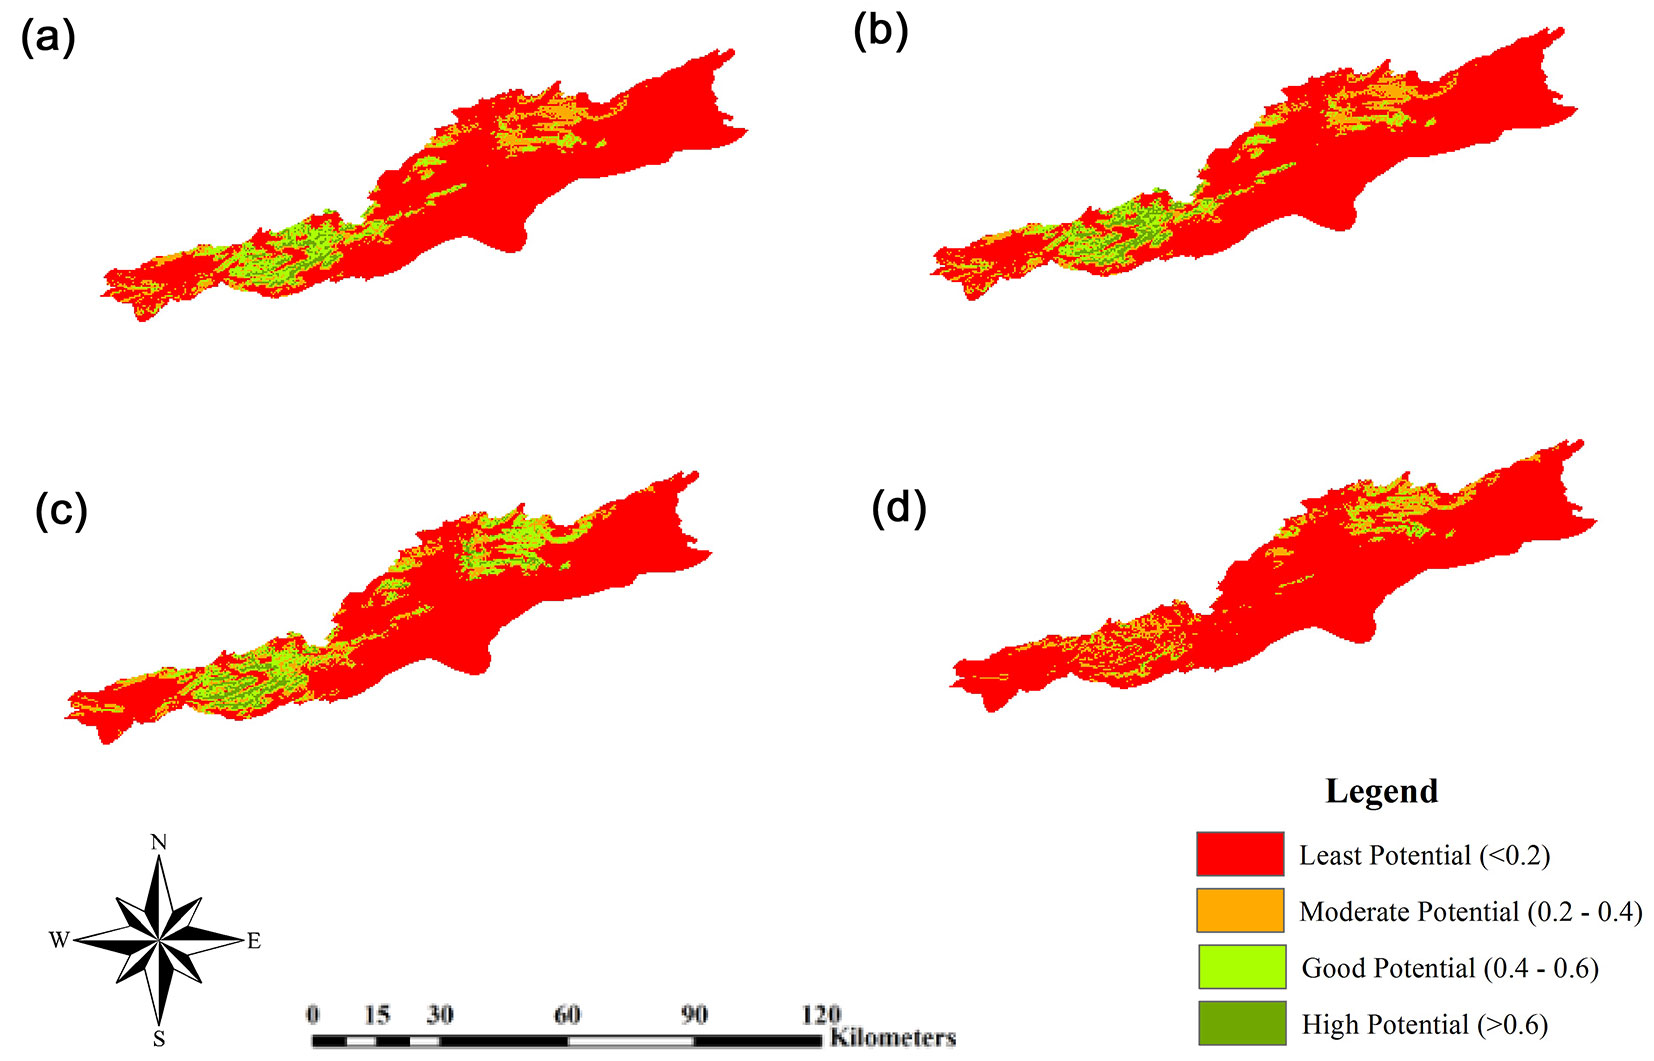
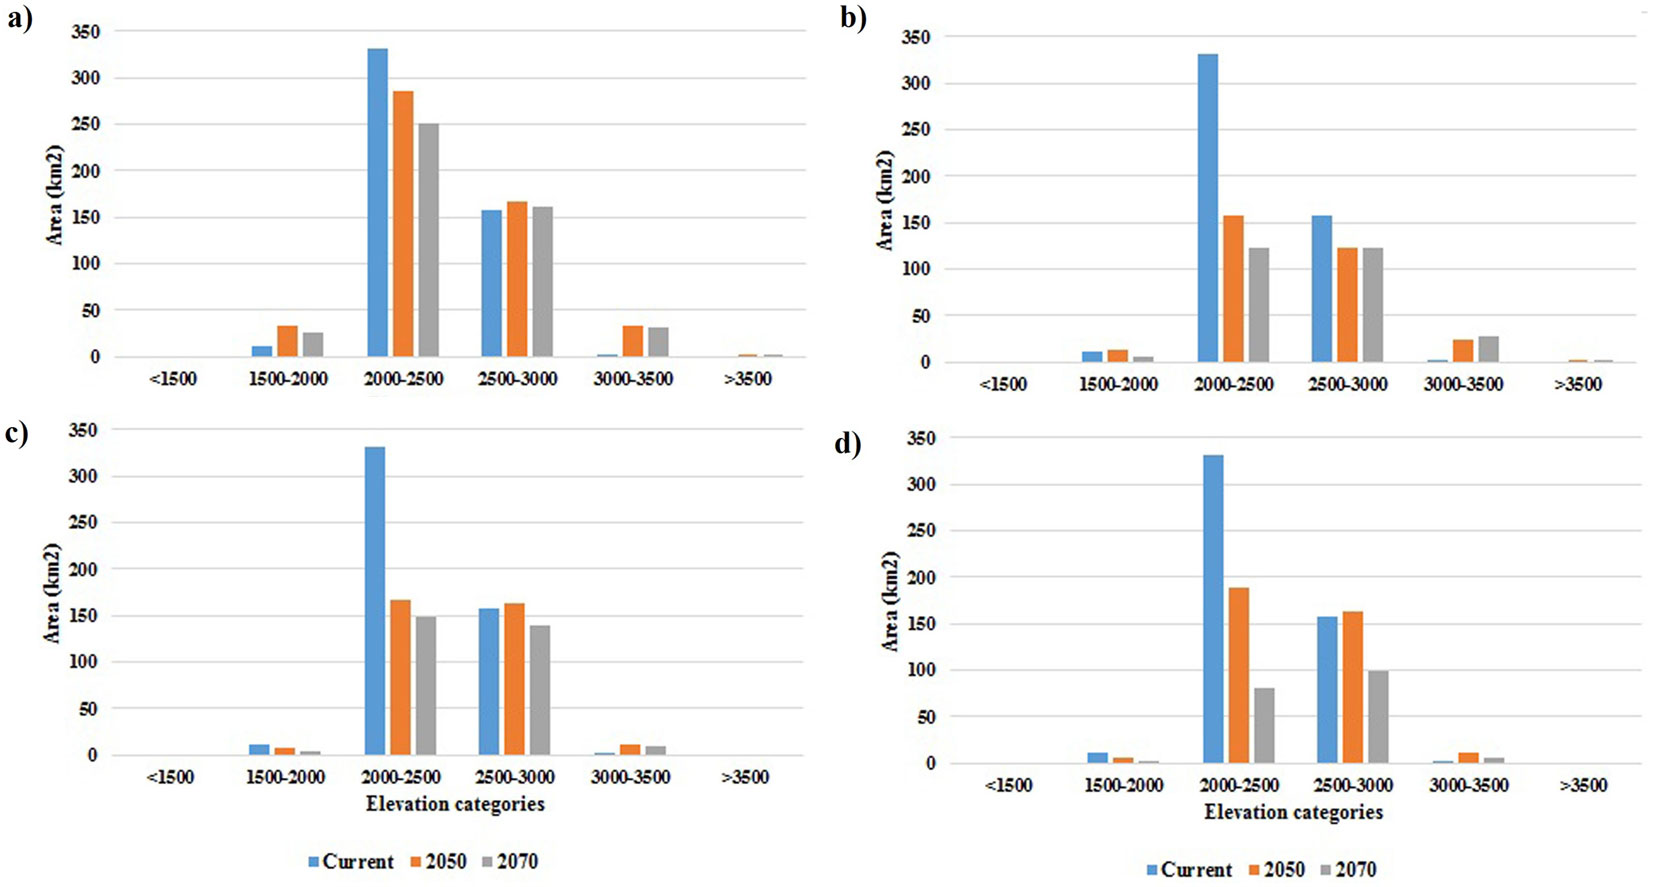
Unlike GFDL-CM3, MRI-CGCM3 model under RCP2.6 did not show an increase in the species’ distribution area (Fig. 4), except for a very slight increase in high-potential class in 2050; in other words, according to this model, both RCP2.6 and RCP4.5 will lead to loss of habitat by 2070. As shown in Fig. 3, this model predicts that by 2070, the area of low-potential class will increase by 1.2% (1768.23 km2) and the areas of good-potential and high-potential classes will decrease by 6.8% (997.92 km2) and 0.5% (82.62 km2), respectively. The results of this model under RCP4.5 predicted that by 2050 there will be little change as compared with the current distribution, except for a slight decrease in the area of high-potential class. Contrastingly, in 2070 the loss of habitat will be significant and amount to 11.5% (1697.76 km2) and 6.8% (950.13 km2) for good-potential and high-potential areas, respectively. In other words, increased concentration of greenhouse gases will severely reduce the species’ presence in the west and center of the study area and will limit its habitats to the northeastern heights. In Fig. 5, the area (in kilometers) of species’ presence in the six elevation classes for current and future conditions under RCP2.6 and RCP4.5 are compared. According to the species’ response curve and Fig. 5, the species is currently present at elevations between 1800-3000 m a.s.l., but the GFDL-CM3 results showed that by 2050 and 2070, the species’ presence in elevations > 3500 m a.s.l. will increase by 2.72 and 3.08 km2, respectively, under scenario RCP2.6 and 0.81 and 2.1 km2 under scenario RCP4.5. Also, according to GFDL-CM3, by 2070 the species’ presence area at elevations between 3000-3500 m a.s.l. will show a 30 km2 increase under RCP2.6 or 23 km2 increase under RCP4.5. Thus, GFDL-CM3 predicted that J. excelsa will migrate to higher elevations to adapt to changing climate. The results of MRI-CGCM3 under RCP2.6, however, predicted that in 2070 there will be no J. excelsa at elevations lower than 1500 and higher than 3500 m a.s.l., and its presence area in the elevation range 3000-3500 m will be 10.04 km2 by 2050, and will slightly decrease (2.51 km2) by 2070. Under RCP4.5, the MRI-CGCM3 model predicted that the presence area of J. excelsa in the elevation range 3000-3500 m a.s.l. will be 9.96 km2 by 2050, and will decrease by 4.94 km2 by 2070. Thus, the results of both climate data series indicated that the species will slowly migrate to higher elevations to cope with the changing climate.
Fig. 4 - Future potential distribution of Juniperus excelsa predicted by the MRI-CGCM3 model. (a): In 2050 under RCP2.6; (b): in 2070 under RCP2.6; (c): in 2050 under RCP4.5; (d): in 2070 under RCP4.5.
Fig. 5 - Comparison of Juniperus excelsa current and predicted distributions by elevation category. (a): GFDL-CM3 data under RCP2.6; (b): GFDL-CM3 data under RCP4.5; (c): MRI-CGCM3 data under RCP2.6; (d): MRI-CGCM3 data under RCP4.5.
Discussion
The results of this study revealed the presence of J. excelsa to be currently limited to the elevation range of 1800-3000 m a.s.l. with a peak presence at elevations of 2100 to 2800 m; the species was observed on slopes of all aspects but more noticeably in those facing south, east, and southeast; and its presence was found to increase in slopes of 12 to 40%, decrease in slopes of 40 to 60%, and again increase in slopes of 60 to 70% (Fig. S2 in Supplementary material), which are consistent with the findings of a study by Ravanbakhsh & Moshki ([38]) on forests of south central Alborz. The study of Sarangzai et al. ([43]) on the ecology and dynamics of J. excelsa in Pakistan have also reported this species to be present at elevations of 2000-3000 m a.s.l. and slopes of 10 to 30%. Our results showed that the most important factors affecting the species’ distribution are elevation, minimum temperature of the coldest month (Bio6, 4-13 °C), and precipitation of coldest quarter (Bio12, 40-60 mm) in that order. The results indicated that snowmelt in the snow-prone slopes and the resulting water is the most important parameter influencing the growth and distribution of J. excelsa in the study region, as the recurrence of three to five-month long dry periods makes the gradual snowmelt a primary source of water. Thus, the species’ presence increases with elevation and the persistence of snow cover, due to lower temperatures especially in the cold seasons. Frey & Probst ([16]) described the climate habitat of J. excelsa as harsh winter with frost condition (-25 °C) without temperature reduction in summer. The annual mean temperature (Bio1) was found to be the next most important factor affecting the species’ distribution. The species was mostly present in areas with annual mean temperature of 7-12 °C, but it was also observed where minimum and maximum temperature are -14.4 and 34.5 °C, respectively. However, studies conducted in other parts of the world indicate different temperatures for the presence of J. excelsa. For instance, Hall ([21]) reported that areas with annual mean temperatures of less than 19 °C are most suitable for this species in Africa, and the tree-ring analysis of J. excelsa by Sass-Klaassen et al. ([44]) distinguished the most suitable habitat in northern Oman with mean, maximum, and minimum temperature of 18, 36.3 and -3.6 °C, respectively.
The results obtained from the GFDL-CM3 model revealed that under scenario RCP2.6, the desirable habitat of J. excelsa in the study area will grow by 2070. Meanwhile, the corresponding climatic parameters show a 3 °C increase in mean temperature by that year, suggesting that elevations higher than the current timber line will gradually become more suitable for J. excelsa. Also, being resilient and drought resistant, J. excelsa can outperform weaker species that will be further damaged by the temperature rise. However, under scenario RCP4.5, the results of both GFDL-CM3 and MRI-CGCM3 models were worrisome, as a significant shrinkage of suitable habitats of J. excelsa, especially those with good and high potential (western and central heights) are forecasted by 2070. Under this scenario, the northeastern area (near Shahrood) is the only zone that will retain favorable growing conditions for the species. Overall, the high-potential habitat of J. excelsa increased by 62.37 km2 under RCP2.6 and decreased by 864.85 km2 under RCP4.5, mostly due to changes in the western and central parts of the study area. Considering the roles of minimum temperature of the coldest month (Bio6) and the precipitation of coldest quarter (Bio12) as the most important variables influencing the species’ distribution under climate change, their mutual effects in determination of climatic niche and ecological response of J. excelsa in both models and under both scenarios were analyzed (Fig. S3 in Supplementary material). The results showed that with GFDL-CM3 under RCP2.6, by 2070 J. excelsa is predicted to slightly enlarge its distribution range in the study area. However, under RCP4.5, the curve is skewed to the right, meaning that by 2070, the annual minimum temperature will rise to -4 °C and there will be a change in the climate niche. The results of MRI-CGCM3 under scenario RCP2.6 showed that by 2050, there will be a slight increase in precipitation of coldest month and then by 2070, the minimum temperature of coldest month increases and climatic niche moves further to the right side. The same trend also occurs under RCP4.5 with the rise of minimum temperature to -2 °C by 2050 and 2070.
It can be concluded that the likely cause of loss of favorable habitat in the study area will be the change in temperature (mean value or monthly minimum). To check the accuracy of results, 20 sites in the north, east, west and center of study area were randomly selected and compared in terms of annual mean temperature (Bio1, an important factor of the species’ distribution in the model) in three periods: present, 2050 and 2070. The results of both GFDL-CM3 and MRI-CGCM3 showed the rise of annual mean temperature in the western and central regions from 8 to about 16 °C while up to 12 °C in the northeastern areas, which is the average ideal value for the presence of J. excelsa in the study area. Thus, the effects of climate change on the central and western parts will lead to a faster loss of favorable habitat of J. excelsa. Tab. 2 illustrates the present and future changes in climate parameters in the GFDL-CM3 and MRI-CGCM3 models.
Tab. 2 - Bioclimatic profile of Juniperus excelsa based on its occurrence data.
| Environmental variables | Current Potential |
GFDL-CM3 | MRI-CGCM3 | ||||||||||||
|---|---|---|---|---|---|---|---|---|---|---|---|---|---|---|---|
| RCP2.6 | RCP4.5 | RCP2.6 | RCP4.5 | ||||||||||||
| Min | Max | Mean | Min | Max | Mean | Min | Max | Mean | Min | Max | Mean | Min | Max | Mean | |
| Annual mean temperature | 5.6 | 13 | 9.7 | 8.8 | 15.9 | 12.4 | 9.7 | 16.8 | 13.3 | 7.4 | 14.5 | 10.9 | 7.7 | 15.3 | 11.8 |
| Mean diurnal range (mean of monthly max and min temp.) | 12.9 | 14.9 | 14.1 | 14 | 16.3 | 15.4 | 14 | 16.4 | 15.3 | 12.7 | 14.4 | 13.7 | 12.9 | 14.4 | 13.8 |
| Isothermality ([Bio2/Bio7] × 100) | 34 | 35 | 34 | 34 | 35 | 35 | 33 | 34 | 33 | 32 | 35 | 34 | 32 | 35 | 34 |
| Temp. seasonality (st.dev. × 100) | 8643 | 9596 | 9266 | 9292 | 10209 | 9898 | 9883 | 10782 | 10489 | 8629 | 9705 | 9329 | 8773 | 9833 | 9469 |
| Max temp. of warmest month | 27.2 | 34.5 | 30.7 | 32.2 | 39.2 | 35.4 | 33.7 | 40.3 | 36.6 | 29 | 35.8 | 32.4 | 28.6 | 36 | 32.1 |
| Min temp. of coldest month | -14.4 | -6.1 | -9.9 | -13 | -4.5 | -8.4 | -13.4 | -4.9 | -8.8 | -12.4 | -3.9 | -7.9 | -12.9 | -4.3 | -8.3 |
| Temp. annual range (Bio5-Bio6) | 36.9 | 42.8 | 40.6 | 40.3 | 46.4 | 43.8 | 41.9 | 47.9 | 45.4 | 36.4 | 42.3 | 40 | 37 | 42.5 | 40.4 |
| Mean temp. of wettest quarter | 5.1 | 12.2 | 9.3 | 8.3 | 15.2 | 12.1 | 2.6 | 16.1 | 12.6 | 6.2 | 13.5 | 10.6 | -0.8 | 13.7 | 8.7 |
| Mean temp. of driest quarter | 12.2 | 23.7 | 20.2 | 16.7 | 27.8 | 24 | 177 | 293 | 248 | 14.3 | 25.5 | 21.5 | - | - | - |
| Mean temp. of warmest quarter | 17.4 | 24.7 | 21.3 | 21.5 | 28.3 | 24.8 | 23.2 | 29.9 | 26.5 | 19.2 | 26.4 | 22.6 | 19.3 | 26.9 | 23.3 |
| Mean temp. of coldest quarter | -6.9 | 1 | -2.6 | -4.5 | 3.3 | -0.5 | -4.5 | 3.2 | -0.5 | -5.5 | 2.2 | -1.5 | -5.1 | 2.7 | -0.81 |
| Annual precipitation | 128 | 188 | 154 | 135 | 193 | 162 | 132 | 183 | 153 | 134 | 205 | 165 | 138 | 200 | 161 |
| Precipitation of wettest period | 22 | 37 | 29 | 27 | 44 | 35 | 22 | 40 | 31 | 26 | 41 | 32 | 24 | 36 | 28 |
| Precipitation of driest period | 0 | 4 | 1 | 0 | 3 | 1 | 0 | 3 | 1 | 0 | 4 | 2 | 0 | 4 | 1 |
| Precipitation seasonality (CV) | 60 | 82 | 72 | 64 | 89 | 78 | 64 | 91 | 80 | 56 | 85 | 73 | 58 | 81 | 69 |
| Precipitation of wettest quarter | 60 | 101 | 80 | 69 | 111 | 89 | 65 | 103 | 83 | 65 | 107 | 84 | 67 | 102 | 78 |
| Precipitation of driest quarter | 3 | 13 | 8 | 3 | 11 | 7 | 2 | 11 | 6 | 3 | 15 | 8 | 3 | 13 | 8 |
| Precipitation of warmest quarter | 6 | 20 | 12 | 7 | 20 | 13 | 5 | 17 | 10 | 6 | 22 | 13 | 5 | 20 | 12 |
| Precipitation of coldest quarter | 43 | 57 | 47 | 42 | 55 | 46 | 45 | 60 | 50 | 45 | 63 | 51 | 51 | 66 | 56 |
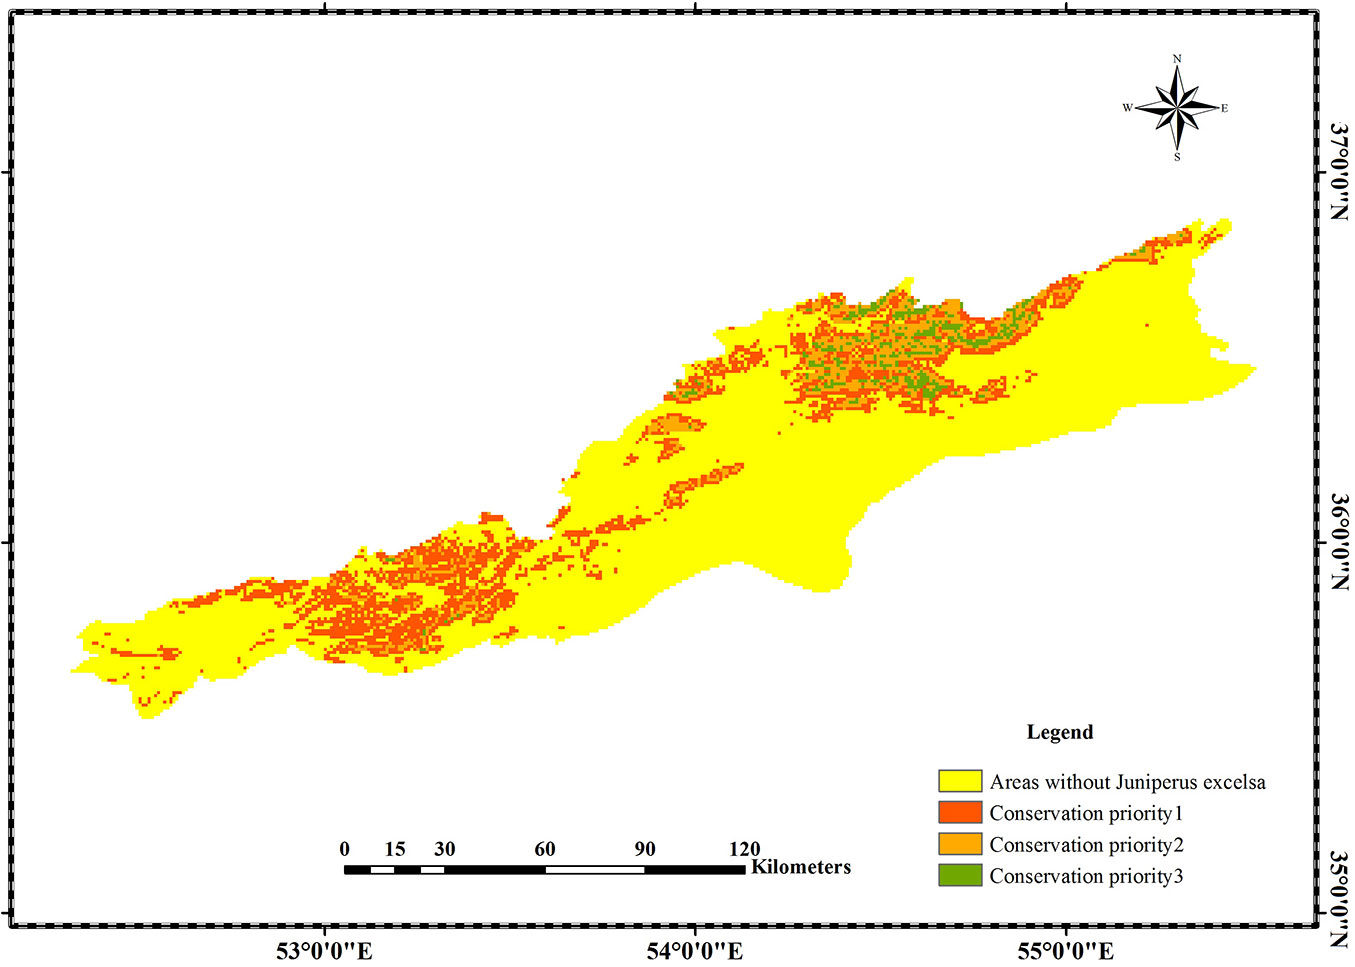
The importance of J. excelsa as one of the characteristic tree species of the mountainous areas of Irano-Turanian region and its relevant role in soil conservation and preventing erosion and desertification necessitate proper planning for species’ preservation on the southern slopes of Alborz Mountains. In view of this goal, a prioritization map was prepared (Fig. 6), where the study area was partitioned into three zones based on the likely climate change impact: (1) top priority zones, where the effects of climate change will work fastest; (2) moderate priority zones, where the effects of climate change will be moderate; (3) low priority zones, where the effects of climate change will likely be negligible.
Our results showed that GFDL-CM3 and MRI-CGCM3 data series both have a good performance in predicting the future habitat of J. excelsa in the study area (Pearson’s correlation = 0.77), but comparing the results with field conditions indicated that GFDL-CM3 is closer to the reality of the study area and its current trends (ignoring the unexpected events). This result is consistent with studies carried out in India ([41]) and in South and East Asia ([22]), which examined the impact of climate change on developing countries with emphasis on the forestry sector, and also with the results of Mátyás ([32]). The present study also demonstrated the good performance of MaxEnt model in evaluating the present and future distribution of J. excelsa, which agrees with Priti et al. ([37]), who examined the effects of climate change on Myristicaceae species in East India, Choudhury et al. ([8]) and Yu et al. ([49]) who studied the preservation of natural reserves for endangered tree species in East China under the effects of climate change.
Conclusions
If the current trend of climate change continues, large parts of habitat of J. excelsa will be lost by 2070. This study focused on climatic parameters only, while ignored other factors such as human activities, management, and the occurrence of extreme events (floods and fires), which could also lead to a further shrinkage of suitable habitats for J. excelsa in northern Iran. In the IUCN Red List ([25]), J. excelsa is currently classified into the category of Least Concern, but the effects of increasing greenhouse gas emission as well as anthropogenic disturbance, its habitats are likely to face more serious threats in the next future. Our results can help in devising preservation strategies tailored to the expected changes in vegetation habitats under changing climatic conditions. To this regard, further studies are desirable, especially on endangered species and using other species distribution models, general circulation models, and scenarios.
References
CrossRef | Gscholar
Gscholar
Online | Gscholar
Gscholar
Gscholar
Gscholar
Gscholar
Gscholar
Authors’ Info
Authors’ Affiliation
Mohammad Rahimi
Hooman Ravanbakhsh
Faculty of desert studies, Semnan University, Semnan (Iran)
Faculty of Natural Resources, Isfahan University of Technology (Iran)
Corresponding author
Paper Info
Citation
Fatemi SS, Rahimi M, Tarkesh M, Ravanbakhsh H (2018). Predicting the impacts of climate change on the distribution of Juniperus excelsa M. Bieb. in the central and eastern Alborz Mountains, Iran. iForest 11: 643-650. - doi: 10.3832/ifor2559-011
Academic Editor
Paolo Cherubini
Paper history
Received: Jul 19, 2017
Accepted: Jul 22, 2018
First online: Oct 04, 2018
Publication Date: Oct 31, 2018
Publication Time: 2.47 months
Copyright Information
© SISEF - The Italian Society of Silviculture and Forest Ecology 2018
Open Access
This article is distributed under the terms of the Creative Commons Attribution-Non Commercial 4.0 International (https://creativecommons.org/licenses/by-nc/4.0/), which permits unrestricted use, distribution, and reproduction in any medium, provided you give appropriate credit to the original author(s) and the source, provide a link to the Creative Commons license, and indicate if changes were made.
Web Metrics
Breakdown by View Type
Article Usage
Total Article Views: 49509
(from publication date up to now)
Breakdown by View Type
HTML Page Views: 40495
Abstract Page Views: 4106
PDF Downloads: 3940
Citation/Reference Downloads: 4
XML Downloads: 964
Web Metrics
Days since publication: 2601
Overall contacts: 49509
Avg. contacts per week: 133.24
Article Citations
Article citations are based on data periodically collected from the Clarivate Web of Science web site
(last update: Mar 2025)
Total number of cites (since 2018): 23
Average cites per year: 2.88
Publication Metrics
by Dimensions ©
Articles citing this article
List of the papers citing this article based on CrossRef Cited-by.
Related Contents
iForest Similar Articles
Research Articles
Local adaptation at a small geographic scale observed in Juniperus excelsa populations in southern Turkey
vol. 14, pp. 531-539 (online: 24 November 2021)
Research Articles
Local ecological niche modelling to provide suitability maps for 27 forest tree species in edge conditions
vol. 13, pp. 230-237 (online: 19 June 2020)
Research Articles
Spatial modeling of the ecological niche of Pinus greggii Engelm. (Pinaceae): a species conservation proposal in Mexico under climatic change scenarios
vol. 13, pp. 426-434 (online: 16 September 2020)
Research Articles
Hemlock woolly adelgid niche models from the invasive eastern North American range with projections to native ranges and future climates
vol. 12, pp. 149-159 (online: 04 March 2019)
Research Articles
Distribution factors of the epiphytic lichen Lobaria pulmonaria (L.) Hoffm. at local and regional spatial scales in the Caucasus: combining species distribution modelling and ecological niche theory
vol. 17, pp. 120-131 (online: 30 April 2024)
Research Articles
Predictive capacity of nine algorithms and an ensemble model to determine the geographic distribution of tree species
vol. 15, pp. 363-371 (online: 20 September 2022)
Research Articles
Fluctuation of the ecological niche of Moringa peregrina (Forssk.) Fiori with topoclimatic heterogeneity in southern Iran
vol. 16, pp. 53-61 (online: 16 February 2023)
Research Articles
Climate change may threaten the southernmost Pinus nigra subsp. salzmannii (Dunal) Franco populations: an ensemble niche-based approach
vol. 11, pp. 396-405 (online: 15 May 2018)
Research Articles
Predicting impacts of climate change on forest tree species of Bangladesh: evidence from threatened Dysoxylum binectariferum (Roxb.) Hook.f. ex Bedd. (Meliaceae)
vol. 10, pp. 154-160 (online: 25 May 2016)
Research Articles
Modelling the carbon budget of intensive forest monitoring sites in Germany using the simulation model BIOME-BGC
vol. 2, pp. 7-10 (online: 21 January 2009)
iForest Database Search
Search By Author
Search By Keyword
Google Scholar Search
Citing Articles
Search By Author
Search By Keywords
PubMed Search
Search By Author
Search By Keyword

