Weak isolation by distance and geographic diversity gradients persist in Scottish relict pine forest
iForest - Biogeosciences and Forestry, Volume 11, Issue 4, Pages 449-458 (2018)
doi: https://doi.org/10.3832/ifor2454-011
Published: Jul 02, 2018 - Copyright © 2018 SISEF
Research Articles
Collection/Special Issue: COST Action FP1202
Strengthening conservation: a key issue for adaptation of marginal/peripheral populations of forest trees to climate change in Europe (MaP-FGR)
Guest Editors: Fulvio Ducci, Kevin Donnelly
Abstract
Gene flow is one of the main factors shaping genetic diversity within and among tree populations, and occurs through pollen and seed dispersal. Recent findings of pollen-release asynchronies in distant populations of Scots pine (Pinus sylvestris L.) within Scotland suggest that gene dispersal among more distant populations might be less effective than previously thought. Limited gene dispersal is one of the major factors causing genetic structure for neutral markers, and pollen-release asynchrony could have driven isolation by distance (IBD) among Scottish populations. Previous studies of neutral markers found little differentiation among Scottish populations of Scots pine, however they did not consider IBD over the full Scottish range. We analysed data from 6 nuclear simple sequence repeats (SSR) and 5 chloroplast SSR loci in a total of 540 individuals of Scots pine from 18 populations across Scotland. Our aim was to assess contemporary levels and distribution of genetic variation and to test if the distribution of genetic diversity was consistent with IBD. We also analysed patterns of gene flow that could have contributed to the observed patterns of variation. Levels of genetic diversity were high, for both nuclear and chloroplast markers within populations, and there was no significant differentiation among populations. A weak signal of IBD was present. We found an increase in nuclear diversity towards the East along with greater gene flow in a West-East direction commensurate with the prevailing winds. Our findings suggest that this wind-driven gene flow is dominant over genetic drift and prevents differentiation among the Scottish populations. It may also counteract any pollen-release asynchronies among populations.
Keywords
Pinus sylvestris, Genetic Diversity, Gene Flow, Isolation by Distance, Prevailing Winds
Introduction
Genetic diversity provides the fundamental basis for the evolution of forest tree species and for their adaptation to change ([22]). The importance of including genetic factors in sustainable forest management has been strongly supported in recent years ([22], [21]) particularly in marginal populations ([20]). Accordingly, several schemes have been proposed for monitoring genetic diversity at the European and international levels ([29]), including the quantification of both adaptive and neutral genetic diversity in forest trees.
Neutral genetic diversity, which has little or no effect on the phenotype, is valuable for studying the effects of historical events such as population size changes, dispersal and vicariance, and of contemporary processes affecting gene flow, such as pollen and seed dispersal ([33]). Characterisation of the level and structure of neutral genetic diversity is considered an appropriate first step to designate conservation units. The amount of neutral genetic diversity and how it is partitioned within and among populations typically results from the balance between gene flow and random genetic drift ([7]). Gene flow can counteract genetic differentiation through genetic homogenization, whereas genetic drift (the random changes of allele frequencies over generations) is expected to lead to differentiation among populations ([55]). Determining levels and structure of neutral genetic diversity of tree populations should be an essential step in the design of sustainable forest management plans, as well as to better understand the processes that are likely responsible for the maintenance of such diversity.
Gene flow occurs through pollen and seed dispersal, and in wind-pollinated trees is usually more extensive by pollen than by seeds, e.g., pollen flow in pines was up to approximately 60 times greater than seed flow ([17]). Although declining gene flow with distance is expected given that most pollen deposition, pollination events and seedling establishment occur near the parent plant ([12]), genes and especially pollen can travel long distances, resulting in large pollen-mediated gene flow. Pollen dispersal is, therefore, expected to shape the level and structure of genetic variation within and among tree populations at local and regional scales ([7]). For example, Scots pine pollen from southern and central Finland contributes to populations located hundreds of km further north ([39], [58]).
Multiple ecological factors can restrict pollen-mediated gene flow among wind-pollinated tree populations, and hence lead to temporal or spatial increases in genetic drift. Physical barriers (e.g., mountains -[41]) and fragmentation ([47]) may restrict pollen flow. However, in some cases, increases of pollen flow counteract diversity loss resulting from fragmentation ([11]). Other significant barriers to pollen flow, that have received less attention, can be due to asynchrony in reproductive phenology, e.g., timing of pollen or flower production ([1], [62]), which may limit the randomness of mating. Indeed, there is evidence that plants mate with phenologically similar individuals more frequently than random ([16]). Consequently, differences in timing of reproductive phenology in nearby tree populations are expected to favour mating between physically closer individuals by mating incompatibility among tree populations, thereby reinforcing isolation by distance (IBD). In addition, wind patterns might also influence the levels and direction of gene flow, such as the significant contribution to directional pollen flow in Scots pine populations from Scandinavia ([39]).
The fragmented natural Scots pine (Pinus sylvestris L.) forests of Scotland represent the westernmost extreme of the species’ native range, separated by at least 500 km from natural stands in mainland Europe. Despite their geographical marginality, previous studies on the Scottish Scots pine populations found high levels of neutral genetic variation but little differentiation among populations ([46], [53], [59] - Tab. 1). The westernmost populations have previously been found to be somewhat distinct from the others ([23], [36], [53] - Tab. 1), on the basis of allele frequency differences.
Tab. 1 - Studies assessing neutral genetic variation of Scots pine in Scotland using variable molecular markers. (RFLP): Restriction Fragment Length Polymorphism; (SSR): Simple Sequence Repeat or microsatellite; (SNP): Single Nucleotide Polymorphism; (No. pop): number of studied populations; (No. ind): number of genotyped individuals.
| Marker | Location | No. pop. | No. ind. | No. markers | Gst*/Fst**/ AMOVA#/ | Diversity | Reference | Main conclusions |
|---|---|---|---|---|---|---|---|---|
| Monoterpene | Scotland | 41 | 6705 | 11 | Similarity matrix: 0-24 over 30 | - | [23] | Variation between sites allowed divide the natural range into several areas of biochemical similarity, the most distinct being a north-western group of sites with Shieldaig as its most distinctive site. A trend of gradually decreased of similarity from the north east from Scotland in a south westerly direction. |
| Monoterpene | Europe | 6 | 953 | 11 | Similarity matrix: 3-24 over 30 | - | [24] | Northern European populations were similar to each other but the three from middle and southern Europe showed large differences from them and from each other. Western region from Scotland showed similarity to middle Europe and south western populations to northern Europe. |
| Scotland (from [23]) | 41 | 953 | 11 | Similarity matrix: 0-24 over 30 | - | |||
| Monoterpene | Scotland | 40 | 5765 | 6 | 0.045* | 0.272-0.378 | [36] | High genetic diversity. Several populations in the Western region from Scotland were distinct from all others and each other. Scottish Scots pine forest originated from more than one refugium after the last glaciation. |
| Isozymes | 14 | 2177 | 9 | 0.028* | 0.291-0.311 | |||
| RFLP (mtDNA) | Scotland | 20 | 466 | Coxl mitochondrial gene | 0.37** | - | [53] | Two mitotypes were present: mitotype a is present at all sites, but that mitotype b is confined to three western populations |
| SSR (cpDNA) | Scotland | 7 | 330 | 17 | 0.032# | 0.950-0.987 | [46] | Higher levels of diversity for the Scottish populations than those for European population. A mutation in one loci occurred in the Western region of Scotland. |
| Europe | 8 | 185 | 17 | Scot vs. Eur 0.0148# | 0.908-0.976 | |||
| SNP (nDNA) | Scotland | 21 | 42 | 16 | -0.017-0.023 | 0.754-0.819 (0.831 at 8 loci) |
[59] | High genetic diversity |
| Europe | 7 | 40 | 10 | 0.071-0.079 | (0.795 at 8 loci) | |||
| SSR (nDNA) | Scotland | 21 | 1680 | 3 | - | - | [51] | High levels of outcrossing in Scottish populations |
| SNP (nDNA) | Scotland | 12 | 120 | - | 0.009** | 0.67 | [60] | High levels of nucleotide diversity within populations |
| SNP (mtDNA) | Scotland | - | 0.81 | |||||
| SSR (nDNA) | Scotland | 2 | 647 | 12 | 0.004** | 0.56-0.58 | [27] | High levels of genetic diversity and presence of moderate fine-scale spatial genetic structure |
A recent study found mismatches in timing of pollen release between a Western and an Eastern population from Scotland. Pollen was released first in the west, between 9.8 to 15.8 days earlier than in the east ([62]). Consistent asynchrony in pollen production among populations will limit gene flow; where the extent of asynchrony reflects geographic distance, a pattern of IBD will be established. Although several studies have addressed genetic variation in Scots pine from Scotland (Tab. 1), these studies have not investigated patterns of IBD in the full Scottish range. Forrest ([23]) found a trend of gradually increasing genetic similarity from the southwest of the Scottish range toward the northeast. Other studies included estimates of FST ([36], [53], [59], [60]), which indicate the extent of genetic differentiation (genetic structure) among populations, regardless of the distance. Measures of IBD indicate the relationships between geographic and genetic distance, and can help us to identify where restricted gene dispersal may relate to geographic factors.
Based on the previous evidence, we hypothesised that, despite extensive pollen dispersal by wind, the presence of an East-West asynchrony in pollen production might result in IBD due to a higher probability that more synchronous populations will mate with each other. Alternatively, the absence of identifiable IBD would suggest that despite the presence of pollen asynchrony, effective gene flow at the regional scale, might have prevented differentiation. To test this hypothesis we characterised genetic diversity along the full East-West gradient of Scots pine within Scotland with two sets of neutral molecular markers, nuclear and chloroplast microsatellites (SSR). The use of both markers can allow greater understanding of the factors driving differentiation than based on either alone ([54]); chloroplast DNA is paternally inherited in conifers via dispersing pollen, and nuclear DNA is bi-parentally inherited via both pollen and seed dispersal. In addition, the coverage of the full native range of Scots pine in Scotland allows much greater resolution of geographical structuring of gene flow, including IBD, since most other SSR-based studies of this species incorporated relatively few Scottish populations ([46], [27]) or did not focus on these aspects of the species’ biology ([51]). Specifically, we sought to answer the following questions: (1) what are the contemporary levels and structure of genetic variation of the Scots pine populations across Scotland? (2) Is there any evidence of IBD? And (3) what are the gene flow patterns among the studied populations?
Material and methods
Study species
Scots pine (Pinus sylvestris L.) in Scotland is a foundation species of the remnant Caledonian pine forests. It is typically a pioneer species that readily regenerates after major natural or human disturbances, if competition and grazing pressure are low. It grows well on most soils, nevertheless, due to low tolerance of shade and competition, it is often restricted to poor soils ([40]). Based on fossil data, this species reached its maximum extent in Scotland around 8.000 years ago, covering approximately 1.5 million ha ([6]). Nowadays, 84 fragments of the ancient native pine forest remain in this area, scattered over a total area of 17.882 ha ([40]).
Study sites and microsatellite analysis
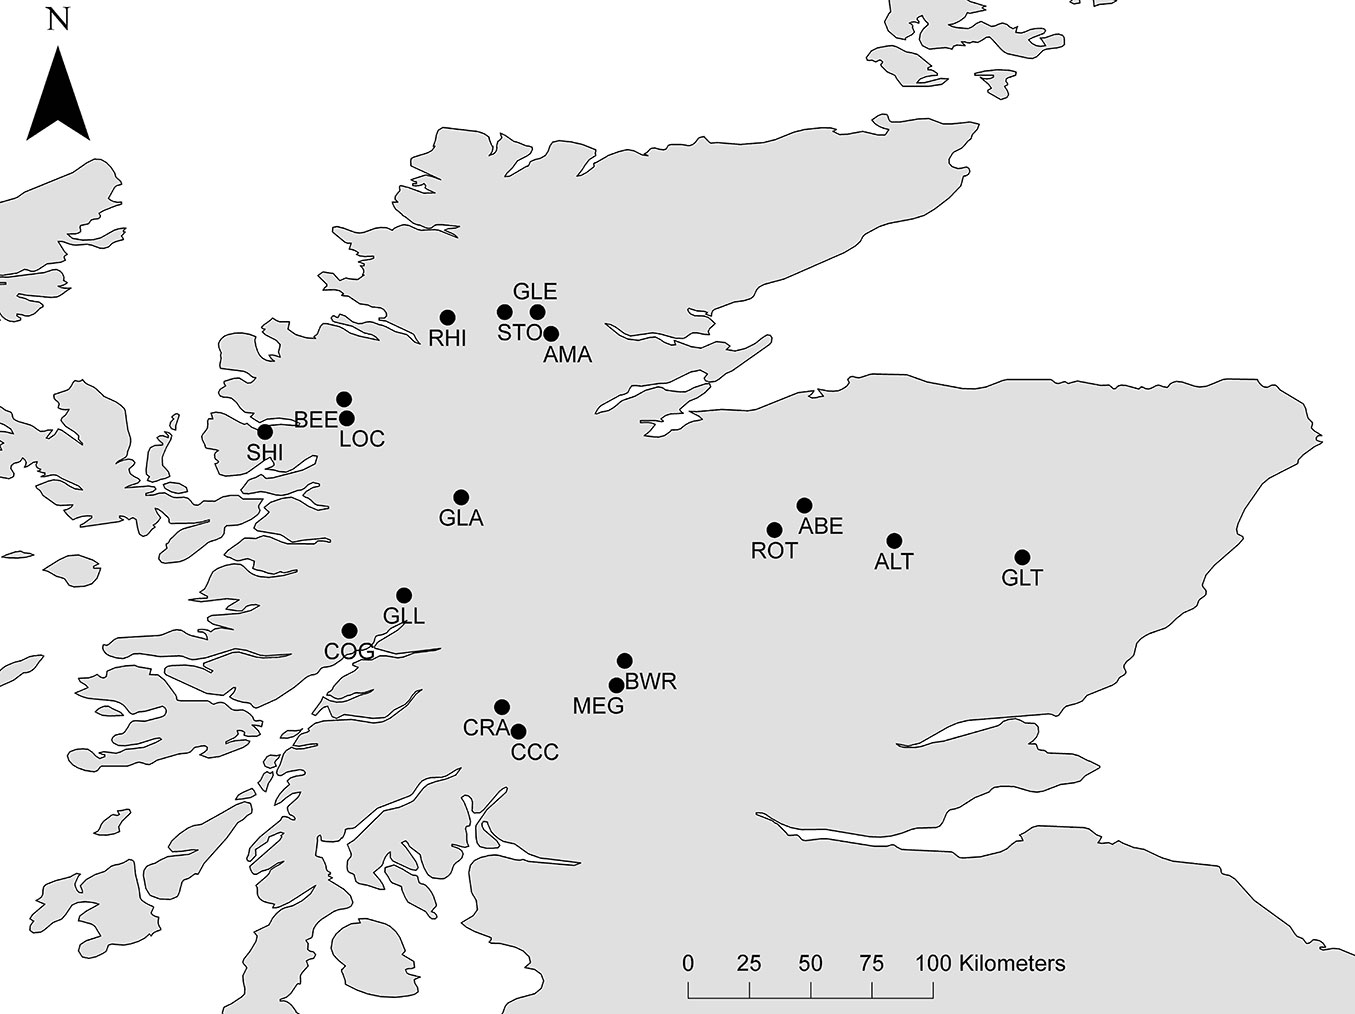
Eighteen populations were selected to cover the full native range of Scots pine within Scotland (Tab. 2, Fig. 1). We sampled a total of 30 randomly selected trees within each population. Sampled trees were old adults, thereby avoiding potential effects of gene flow from more recent Scots pine plantations that might otherwise obscure patterns of genetic diversity and divergence in the native stands.
Tab. 2 - Details of study sites. Population area was obtained from Mason et al. ([40]).
| Population name | Code | Seed zone |
Pine area (ha) |
Lat N (dec. deg.) |
Long E (dec. deg.) |
Altitude (m a.s.l.) |
|---|---|---|---|---|---|---|
| Cona Glen | COG | SW | 189 | 56.78 | 5.33 | 148 |
| Glen Loy | GLL | SW | 74 | 56.91 | 5.13 | 170 |
| Crannach | CRA | SW | 70 | 56.5 | 4.77 | 296 |
| Coille Coire Chuilc | CCC | SC | 67 | 56.41 | 4.71 | 257 |
| Meggernie | MEG | SC | 277 | 56.58 | 4.35 | 306 |
| Black Wood of Rannoch | BWR | SC | 1011 | 56.67 | 4.32 | 275 |
| Abernethy | ABE | EC | 2452 | 57.24 | 3.66 | 341 |
| Rothiemurchus | ROT | EC | 1744 | 57.15 | 3.77 | 318 |
| Allt Cul | ALT | NE | 13 | 57.11 | 3.33 | 476 |
| Glen Tanar | GLT | NE | 1564 | 57.05 | 2.86 | 334 |
| Glen Affric | GLA | NC | 1532 | 57.27 | 4.92 | 256 |
| Amat | AMA | NC | 181 | 57.87 | 4.59 | 137 |
| Loch Clair | LOC | NW | 126 | 57.56 | 5.34 | 132 |
| Shieldaig | SHI | NW | 103 | 57.51 | 5.64 | 81 |
| Beinn Eighe | BEE | NW | 182 | 57.63 | 5.35 | 63 |
| Glen Einig | GLE | N | 27 | 57.95 | 4.76 | 55 |
| Strath Oykell | STO | N | 14 | 57.95 | 4.64 | 103 |
| Rhidorroch | RHI | N | 103 | 57.93 | 4.97 | 182 |
Fig. 1 - Study populations for nSSR and cSSR analyses.
Total genomic DNA was extracted from 50 mg silica gel-dried needles using a QIAGEN DNeasy® plant extraction kit (QIAGEN Ltd. Crawley, UK) following the manufacturer’s protocol. All individuals from the eighteen Scottish populations were genotyped at six nuclear (nSSR) and five chloroplast (cSSR) microsatellite markers. We used six nSSR: PSAJ223770/SPAC11.14, PSAJ223766/SPAC11.8 ([56]), Ptx2146 ([2]), SsrPt_ctg4698, SsrPt_ctg9249 ([8]) and LOP3 ([38]); and five cSSR: PCP26106, PCP30277, PCP36567, PCP45071, PCP87314 ([46]). Reactions were carried out in a final volume of 10 µl with 1 µM fluorescently-labelled forward primer, 1 µM reverse primer, 200 µM each dNTPs, 0.5 units Taq® polymerase (Roche Applied Science), 1X PCR buffer (supplied with Taq) and 25 ng of template DNA. Annealing temperature was 56 °C. Polymerase chain reactions (PCR) were performed in a Gene Amp PCR System 9700® thermo cycler (Applied Biosystems, Bleiswijk, Netherlands), with the following programme: 1 cycle at 95 °C for 4 min followed by 35 cycles at 95 °C for 45 s, 56 °C for 45 s, 72 °C for 45 s, and a final step at 72 °C for 5 min. Fragment analysis was performed by Genome Technology at James Hutton Institute, Dundee, UK, using a 3730 DNA Sequencer® (Applied Biosystems) with reference to a ROX 500 size standard. Fragments were scored using GeneMarker® v. 2.6.0. (SoftGenetics, State College, PA, USA). Null allele frequencies at nuclear loci for each locus and each population were checked by using the software Micro-Checker ([57]). PSAJ223770/SPAC11.14 showed evidence of null alleles, however the frequency was below 0.2, which is the threshold over which null alleles can result in a significant underestimate of expected heterozygosity HE ([9], [4]), therefore it was kept for further analysis.
Data analysis
Genetic diversity
Genetic diversity estimators within populations were estimated using FSTAT ver. 2.9.3.2 ([28]) and Arlequin ver. 3.5 ([19]). For nSSR, we estimated mean number of alleles per locus (nA), rarefied allelic richness (nAR), number of private alleles (nAp), observed heterozygosity (nHO), expected heterozygosity (nHE) and inbreeding coefficient (nFIS). Rarefaction of allelic richness controls for differences in sample size allowing comparison among sites and studies. For cSSR, we estimated mean number of alleles (cA). For the remaining cSSR estimators, alleles were combined to compose a unique chloroplast haplotype for each individual. Individuals with missing data were discarded from the inference of multilocus haplotypes. We estimated number of haplotypes (cHN), number of private haplotypes (cHP) and gene diversity (cHE), the latter based on haplotype frequencies.
Population differentiation and Bayesian clustering
To estimate population differentiation, we calculated nFST among populations using nSSR in Arlequin ver. 3.5 ([19]), and the differentiation index Jost’s D implemented in the R package DEMEtics ([26]). In both cases, significance values were determined for a 5% nominal level after Bonferonni correction. Multilocus haplotypic and genetic estimators for both nSSR and cSSR (nHE, nAR, cHE and cHN) were mapped using ArcMap® ver. 10 (ESRI, Redlands, CA, USA), using inverse distance weight methods available on the spatial analyst interpolation tool. To map nuclear genetic differentiation, for each site we calculated the percentage of total sites that it was significantly differentiated from (e.g., percentage of differentiated sites, nDS, %), based on nFST values. To quantify the distribution of variation of nuclear genetic diversity and chloroplast haplotypes, we tested both marker sets in a hierarchical analysis of molecular variance (AMOVA) from the level of individual, population and cluster of populations (see directional relative migration rates section), performed in Arlequin ver. 3.5 ([19]).
We performed individual-based Bayesian assignment methods using data from nuclear loci in STRUCTURE ver. 2.3.4 ([45]). We used a model assuming correlated allele frequencies and admixed ancestry. We included the site location a priori (LOCPRIOR option) to improve the detection of weak population structure. K was set from 1 to 20, with 10 runs performed for each value of K. Runs consisted of 500,000 Markov Chain Monte Carlo (MCMC) iterations with a burn-in period of 100,000. We used STRUCTURE HARVESTER ([14]), an application that uses the Evanno method for assessing and visualizing likelihood values across multiple values of K and detecting the number of genetic groups that best fit the data.
Isolation by distance and directional relative migration rates
For testing isolation by distance we used nuclear markers in SPAGeDi ver. 1.4 ([31]) with significance determined by permuting site locations among populations 10,000 times. Following Rousset ([50]), we used the FST /(1- FST) ratio as a measure of genetic distance as it is expected to vary linearly with the natural log of the geographical distance.
To reduce the number of sites to an analytically tractable set for estimating migration patterns, we grouped sites with their nearest neighbours to give seven site clusters, corresponding to the biochemical zones described by Forrest ([23]) and used as a seed zones (Tab. 2). Directional relative migration rates between site clusters were estimated using nuclear markers and the function DIVMIGRATE from the R-package DIVERSITY ([34]) using Jost’s D as a measure of genetic differentiation. To test whether relative migration is significantly higher in one direction than the other (e.g., asymmetric), 95% confidence intervals were calculated from 1,000 bootstrap iterations.
Results
Genetic diversity
Among the six nuclear loci analysed, the number of alleles per locus (nA) ranged from 2 to 14, with a multilocus average of 11.5 ± 7.34 for all populations combined. In total we obtained 9 private alleles. For rarefied allelic richness (nAR), multilocus estimates ranged from values of 5.42 to 7.55, based on a minimum number of 28 diploid individuals, with a multilocus average of 5.84 for all populations combined (Tab. 3 and Fig. 2b). The multilocus expected (nHE) and observed heterozygosity (nHO) was 0.62 ± 0.03 and 0.54 ± 0.04 respectively for all populations combined (Tab. 3, and Fig. 2a for nHE). A general trend of lower nuclear diversity (nHE) in the western sites and relatively higher diversity in the eastern sites was observed (Fig. 2a). This trend was positively correlated with longitude (F=6.703, R2=0.25, p<0.05), but not for nAR. A general significant homozygote excess was found (overall FIS=0.121, p < 0.05 - Tab. 3).
Tab. 3 - Genetic diversity estimators for nuclear (nSSR) and chloroplast (cSSR) markers. (nN): no. of samples genotyped with nSSR; (nA): no. of alleles; (nAR): rarefied allelic richness for 28 diploid individuals; (nAp): no. of private alleles; (HO): observed heterozygosity; (HE): expected heterozygosity; (FIS): inbreeding coefficient; (cN): no. of samples genotyped with cSSR; (cA): no. of alleles; (cHN): no. of haplotypes; (cHP): no. of private haplotypes; (cHE): gene diversity corrected for sample size ([42]). P-values for FIS are obtained after 1.000 permutations of gene copies within individuals of each stand. Standard errors are reported in brackets. (*): *P < 0.05; (**): P < 0.01; (***): P < 0.001.
| Population | nSSR | cSSR | ||||||||||
|---|---|---|---|---|---|---|---|---|---|---|---|---|
| nN | nA | nA R | nAp | nH O | nH E | nF IS | cN | cA | cH N | cH P | cH E | |
| COG | 30 | 6.1670 (3.3120) |
6.0992 (2.9791) |
1 | 0.4944 (0.2352) |
0.5779 (0.2402) |
0.1460*** | 28 | 3.2 (1.095) |
13 | 4 | 0.9339 (0.0227) |
| GLL | 30 | 5.8330 (2.9270) |
5.7860 (2.6523) |
0 | 0.4944 (0.1500) |
0.5801 (0.2743) |
0.1500*** | 25 | 2.8 (0.837) |
14 | 1 | 0.9400 (0.0280) |
| CRA | 30 | 6.3330 (3.1410) |
6.2860 (2.8557) |
1 | 0.5151 (0.1960) |
0.6389 (0.1990) |
0.1960*** | 25 | 3.0 (1.225) |
14 | 1 | 0.8967 (0.0431) |
| CCC | 30 | 6.6670 (4.2270) |
6.5777 (3.7589) |
0 | 0.5722 (0.0460) |
0.5995 (0.2201) |
0.0460 | 23 | 2.8 (1.304) |
14 | 1 | 0.9565 (0.0220) |
| MEG | 30 | 5.5000 (2.8110) |
5.4753 (2.5497) |
0 | 0.5556 (0.1570) |
0.6573 (0.1552) |
0.1570*** | 28 | 3.4 (1.673) |
15 | 3 | 0.9048 (0.0420) |
| BWR | 30 | 6.3330 (2.9440) |
6.2638 (2.6361) |
0 | 0.5860 (0.0560) |
0.6200 (0.1885) |
0.0560 | 23 | 3.2 (1.304) |
14 | 3 | 0.9368 (0.0331) |
| ABE | 30 | 7.1670 (3.7640) |
7.0532 (3.3582) |
1 | 0.6111 (0.0590) |
0.6490 (0.2224) |
0.0590 | 27 | 2.8 (1.304) |
13 | 0 | 0.8291 (0.0684) |
| ROT | 30 | 5.8330 (2.3170) |
5.7767 (2.0727) |
1 | 0.5935 (0.0500) |
0.6240 (0.2063) |
0.0500 | 27 | 3.4 (1.140) |
17 | 3 | 0.9487 (0.0257) |
| ALT | 30 | 6.3330 (3.0770) |
6.2532 (2.7636) |
1 | 0.5937 (0.0120) |
0.6006 (0.2542) |
0.0120 | 25 | 2.8 (0.837) |
14 | 0 | 0.9433 (0.0240) |
| GLT | 30 | 7.1670 (2.9270) |
7.0615 (2.5983) |
0 | 0.5556 (0.1100) |
0.6228 (0.2215) |
0.1100* | 25 | 3.4 (1.140) |
13 | 1 | 0.9167 (0.0349) |
| GLA | 30 | 7.3330 (4.2270) |
7.1470 (3.7213) |
0 | 0.4925 (0.1170) |
0.5565 (0.2660) |
0.1170** | 22 | 3.4 (0.241) |
15 | 2 | 0.9524 (0.0291) |
| AMA | 30 | 6.5000 (3.6740) |
6.4505 (3.3049) |
0 | 0.5444 (0.1160) |
0.6149 (0.2604) |
0.1160** | 21 | 3.2 (0.837) |
15 | 1 | 0.9667 (0.0236) |
| LOC | 30 | 6.6670 (3.4450) |
6.5968 (3.0930) |
0 | 0.5803 (0.0690) |
0.6226 (0.2130) |
0.0690 | 27 | 3.0 (1.000) |
13 | 0 | 0.9373 (0.0220) |
| SHI | 30 | 5.5000 (3.2710) |
5.4198 (2.9151) |
0 | 0.4944 (0.0330) |
0.5110 (0.2737) |
0.0330 | 29 | 3.0 (0.707) |
13 | 2 | 0.9458 (0.0173) |
| BEE | 30 | 6.6670 (3.7240) |
6.6082 (3.3824) |
1 | 0.5500 (0.1040) |
0.6128 (0.2978) |
0.1040* | 29 | 3.2 (1.304) |
14 | 0 | 0.9335 (0.0228) |
| GLE | 30 | 6.5000 (2.8810) |
6.3923 (2.5723) |
2 | 0.4571 (0.2140) |
0.5794 (0.2517) |
0.2140*** | 28 | 2.8 (0.837) |
16 | 2 | 0.9497 (0.0214) |
| STO | 30 | 7.3330 (3.5020) |
7.1848 (3.1003) |
0 | 0.5222 (0.1450) |
0.6095 (0.2079) |
0.1450*** | 27 | 2.8 (1.304) |
14 | 1 | 0.9145 (0.0334) |
| RHI | 30 | 7.6670 (3.5020) |
7.5522 (3.1469) |
1 | 0.5714 (0.1130) |
0.6430 (0.2847) |
0.1130* | 30 | 3.2 (1.304) |
19 | 2 | 0.9586 (0.0209) |
| All populations | 540 |
11.5000
(7.3420) |
5.8400
(3.1362) |
9 |
0.5434
(0.2068) |
0.6179
(0.2327) |
0.121*** | 469 |
4.6
(1.140) |
64 | 27 | - |
|
Overall
mean |
30 |
6.5278
(3.3152) |
6.4435
(2.9700) |
0.5 |
0.5456
(0.1101) |
0.6067
(0.2334) |
0.1052 | 26.05 |
3.1
(1.077) |
14.44 | 1.5 |
0.9315
(0.0298) |
Fig. 2 - Genetic diversity parameters for nSSR (above) and cSSR (below). (a) Genetic diversity for nSSR (nHE); (b) rarefied allele richness for nSSR (nAR); (c) gene diversity corrected for sample size for cSSR (cHE); (d) no. of haplotypes for cSSR (cHN).
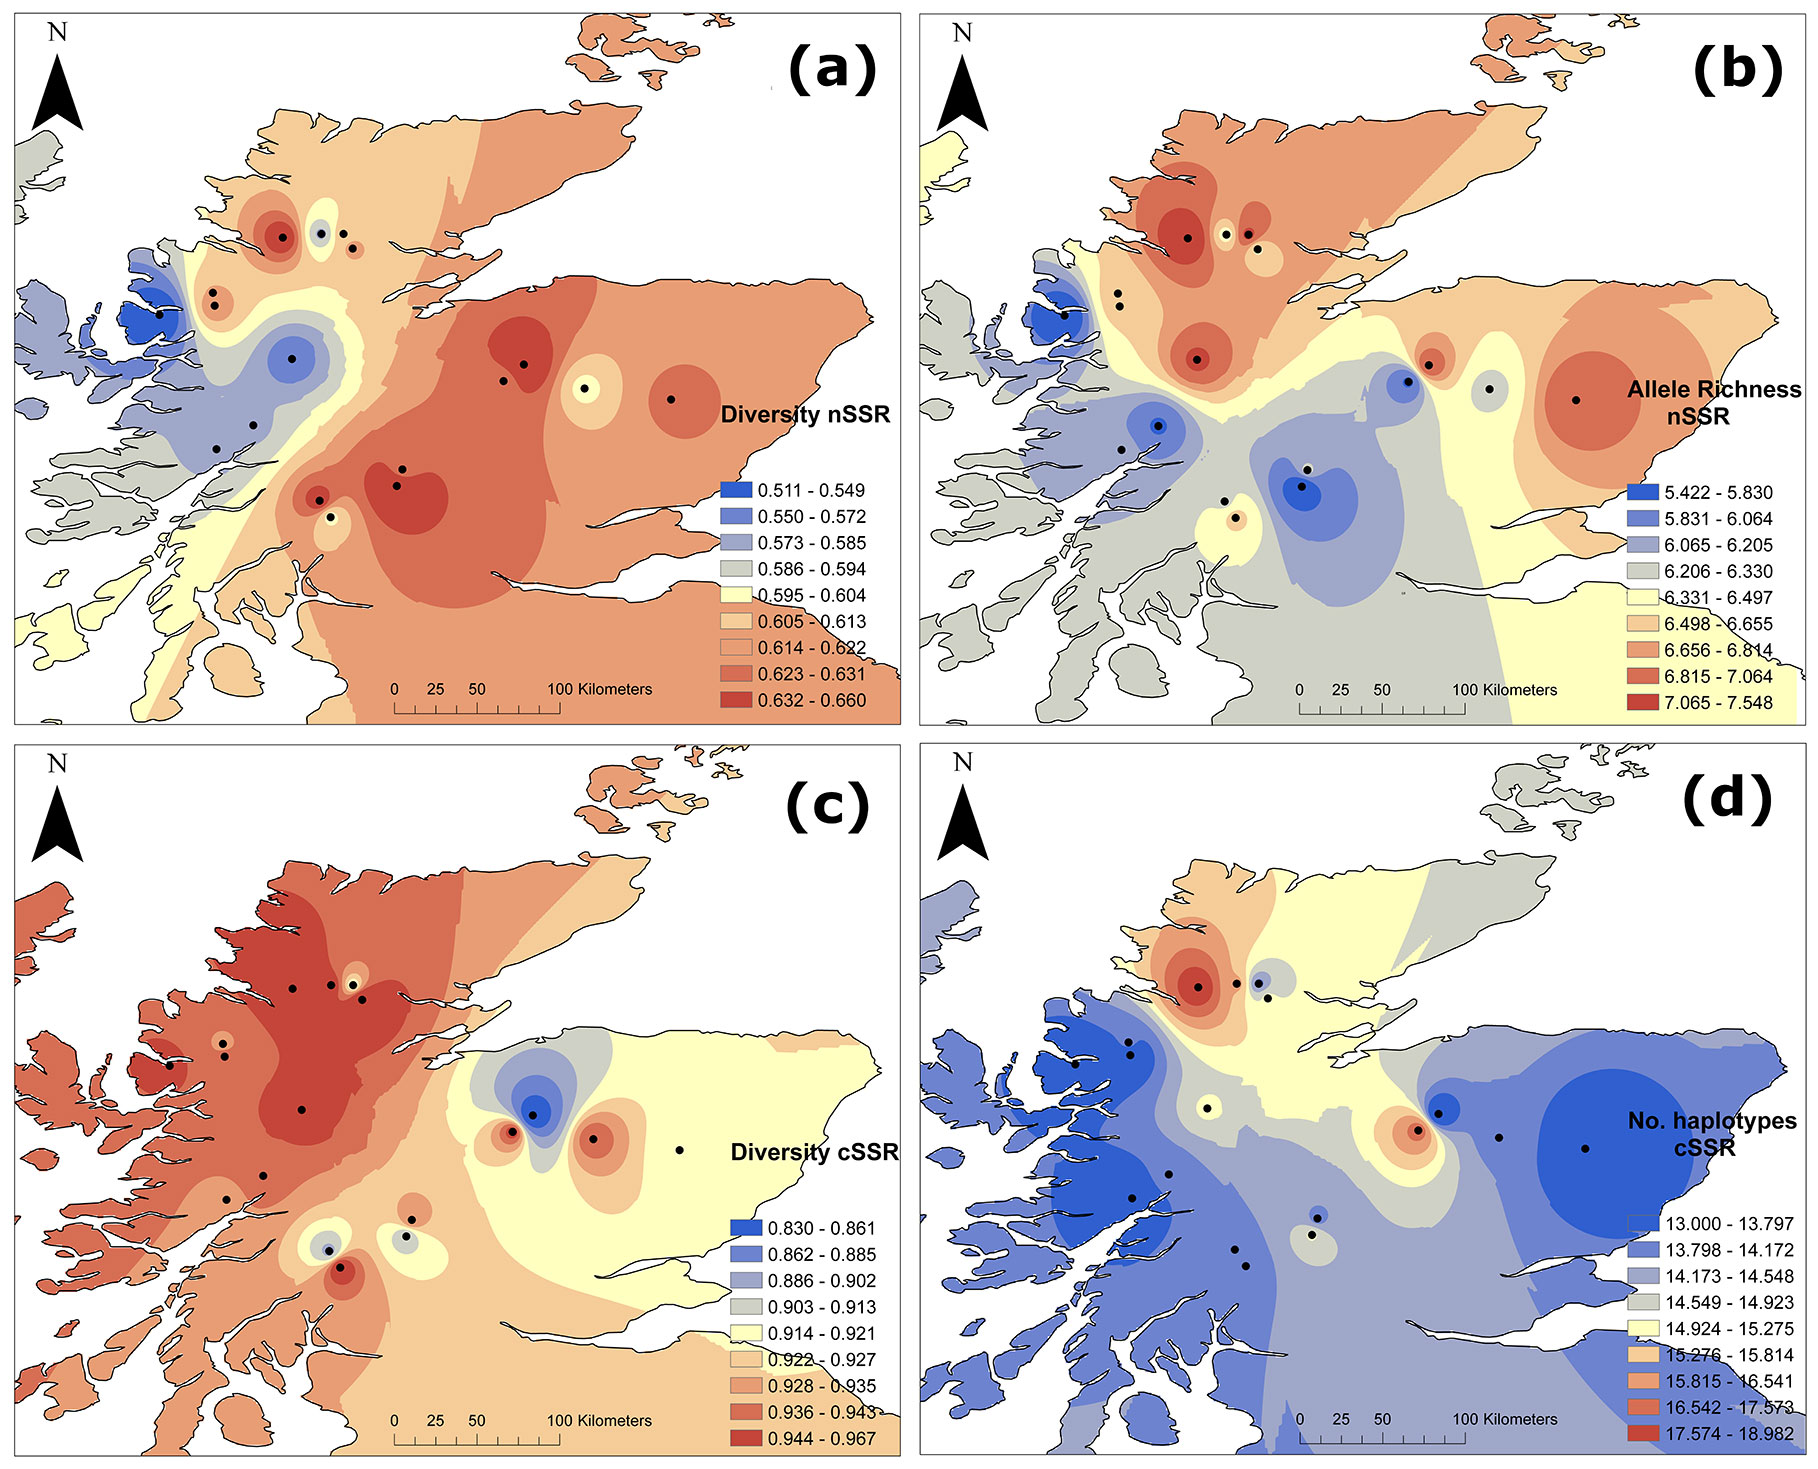
Among the five chloroplast loci analysed, the number of alleles per locus (cA) ranged from 2 to 6, with a multilocus average of 3.08 for all populations combined. Gene diversity (cHE) ranged between 0.83 and 0.96 (Tab. 3 and Fig. 2c). The number of haplotypes (cHN) within populations ranged from 13 to 19 (Tab. 3 and Fig. 2d), with a total of 64 haplotypes recorded, of which 42% (27 haplotypes) were private, i.e., unique to a particular population (Tab. 3). Although most western sites showed high levels of chloroplast gene diversity (cHE), some of the eastern sites showed also high levels of diversity and the spatial trend was not as clear as for nSSR (Fig. 2c). No significant correlation with longitude was found for chloroplast diversity.
Population differentiation and Bayesian clustering
When testing differences among populations, multilocus nFST values ranged from -0.005 (ROT and GLT) to 0.065 (SHI and MEG), being significant (p<0.05) in most cases (Tab. S1 in Supplementary material). Thus, for instance, of the most differentiated populations, SHI was significantly different from all populations and BWR from all but GLA (Tab. S1 and Fig. S1). RHI, BEE, CCC, MEG and ALT significantly differed from all but two or three populations (Tab. S1 and Fig. S1). Jost’s D values were in agreement but greater than FST values and ranged between -0.012 (ROT and GLT) to 0.127 (SHI and MEG - Tab. S1 in Supplementary material). Interestingly, the populations with the greatest asynchrony in pollen release ([62]), BEE and ALT, had some of the largest FST values (FST=0.05, p<0.05). The results of AMOVA showed that although most of the variation was found within populations, among-population variability is greater within groups than between them for both sets of molecular markers (Tab. 4).
Tab. 4 - Hierarchical analysis of molecular variance (AMOVA) for nuclear (nSSR) and chloroplast (cSSR) markers at the individual, population and cluster of populations. The degrees of freedom (df), percentage of variation explained by each level (Variation, %), and the relevant P-values are indicated.
| Source of variation | nSSR | cSSR | ||||
|---|---|---|---|---|---|---|
| df | Variation (%) | p-value | df | Variation (%) | p-value | |
| Among cluster of populations | 6 | 0.17 | 0.25 | 6 | 0.25 | 0.11 |
| Among populations | 11 | 1.79 | <0.001 | 11 | 1.89 | <0.001 |
| Within populations | 1062 | 98.04 | <0.001 | 453 | 97.86 | <0.001 |
Structure identified K=2 as the more likely number of clusters (red and blue clusters hereafter), however, these clusters were not related to the East-West location of the individuals (Fig. S2 in Supplementary material). Most sites contained highly admixed individuals; however, the site SHI had more than 75% of individuals in the less common blue cluster. In addition, four sites had between 60 and 75% of individuals in the blue cluster STO, COG, BWR, ROT, ALT, followed by LOC, GLA and GLT with more than 50%. All the other sites had a majority of the red cluster.
Isolation by distance and asymmetric migration
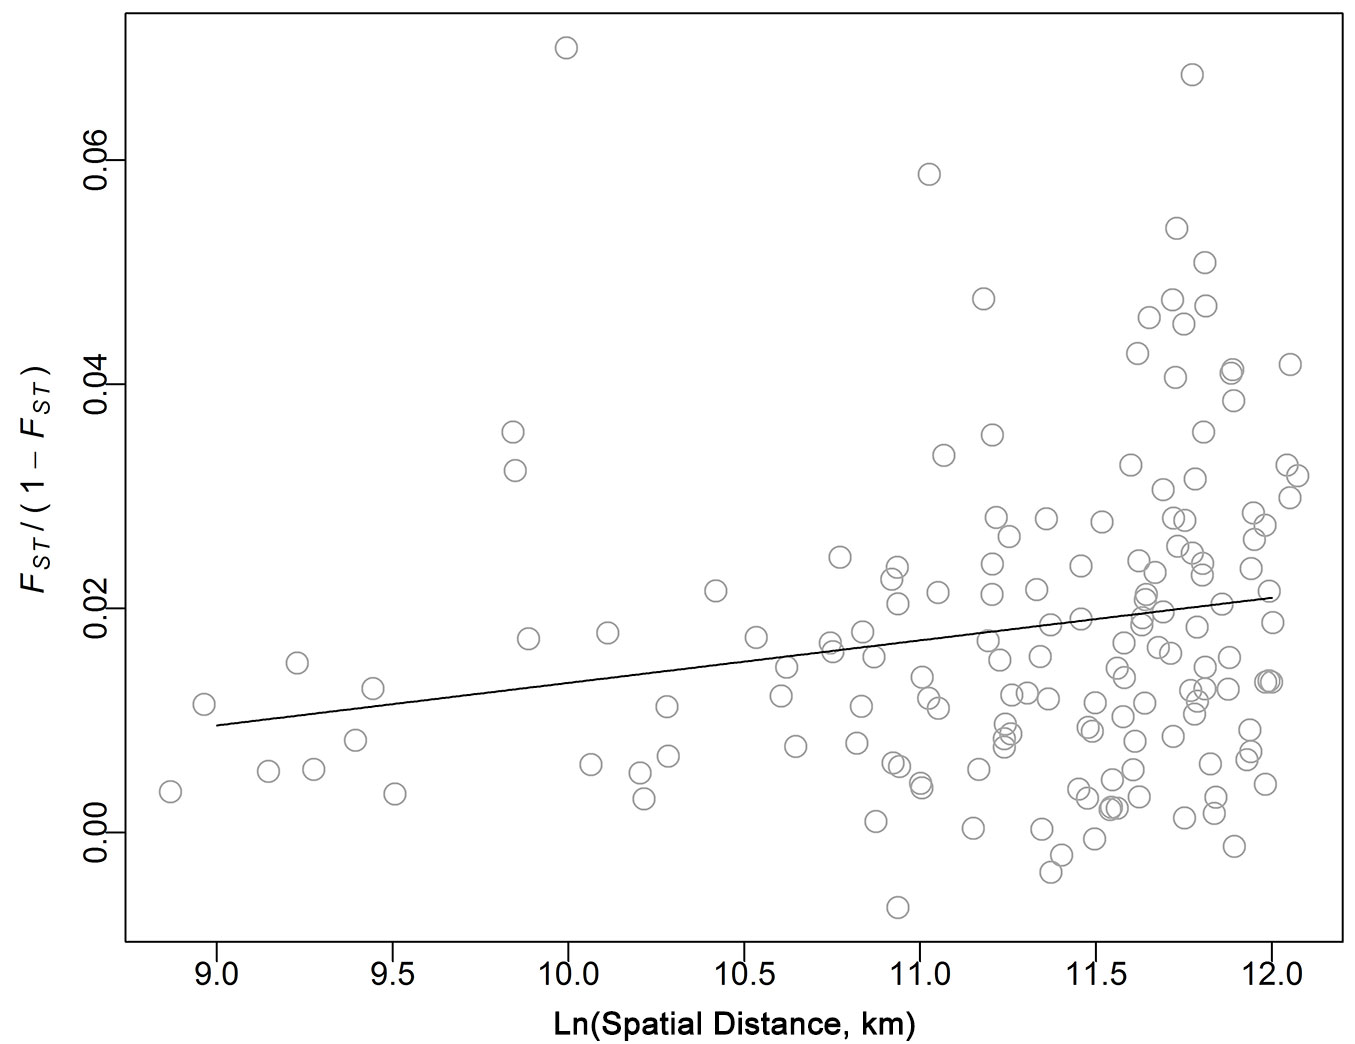
Although weak, IBD was significant in the Scottish populations (slope = 0.0038, R2 = 0.035, P < 0.05 - Fig. 3), indicating that when geographic distance increases, populations became more differentiated. Expressing geographic and/or genetic distance on a logarithmic scale did not improve the model fit (data not shown).
Fig. 3 - Isolation by distance (IBD). Black line represent the slope of the correlation of the natural log of the linear spatial distance [Ln(Spatial Distance (km)] against FST/(1-FST) after 10.000 permutations of sites among locations.
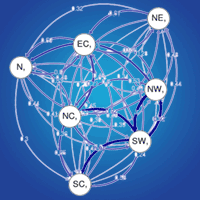
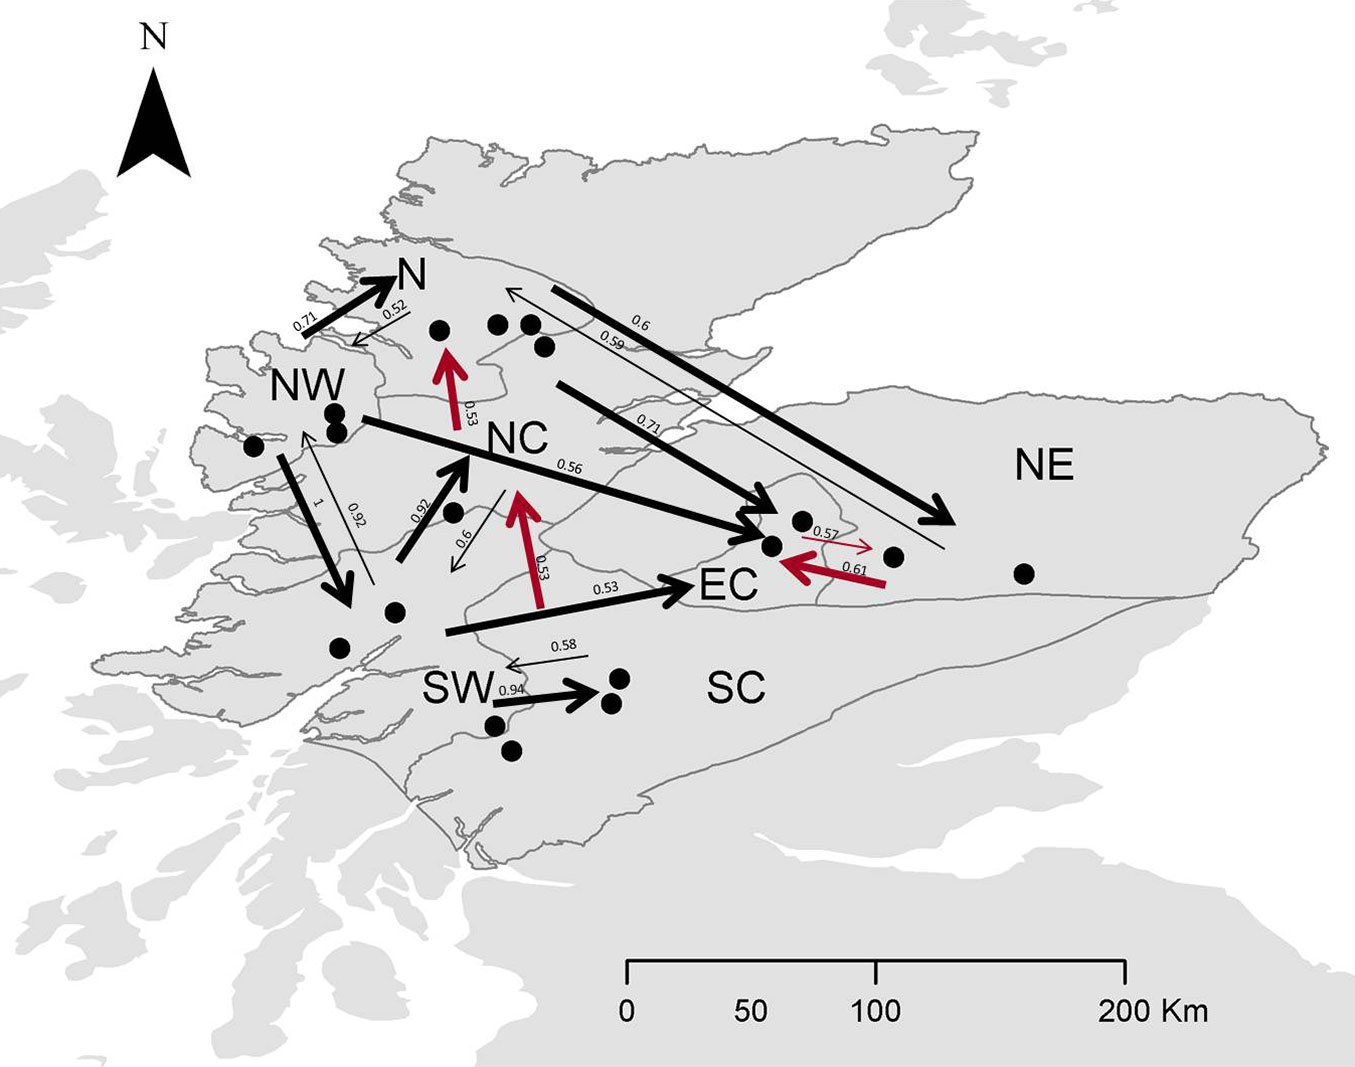
The relative migration network (Fig. S3a in Supplementary material) shows all relative migration rates between site clusters of Scottish populations of Scots pine. Those rates indicate that gene flow was, in most cases, greater in the West-East direction than in the East-West direction, although it was not significantly asymmetric. In Fig. 4 and Fig S3b (Supplementary material), directional relative migration rates below 0.50 were filtered out to emphasize the major gene flow networks.
Fig. 4 - Relative migration networks for nSSR with populations sorted in seed groups (see Tab. 2 for population details) using a threshold of 0.5. Arrows in black denote greater gene flow pattern in the W-E direction, whereas arrows in red denote greater gene flow in the E-W or S-N direction. Thicker arrows mean stronger gene flow in such direction.
Discussion
Our study presents a detailed genetic survey of a subset of the remaining natural populations of Scots pine from Scotland using both bi-parentally inherited nuclear SSR and paternally inherited chloroplast SSR. Three main results were obtained: (i) high levels of genetic variation and low population differentiation; (ii) a weak pattern of isolation by distance; and (iii) an increase of nuclear diversity towards the East. While we detected some discrepancies (e.g., SHI), our findings suggest that the effects of gene flow dominate those of genetic drift and prevent differentiation in the Scottish populations. Our results suggest greater gene flow in the West-East direction, likely influenced by prevailing wind patterns.
High levels of genetic variation and low population differentiation
In agreement with other molecular markers ([23], [36], [53], [46], [59]), our results indicated relatively high levels of genetic variation across the Scottish native populations of Scots pine for both nuclear and chloroplast microsatellite markers. This is counter to expectations given their marginal distribution in global terms and the severe reduction in the extent of forest, and its fragmentation in recent centuries. Values of multilocus nuclear SSR diversity (nHE = 0.51-0.66) were comparable to those found in other Scottish and Eurasian populations (nHE = 0.50-0.69 - [41], [5], [27]), although lower than in some mainland European populations (nHE = 0.74-0.85 - [52], [43], [25]). In addition, the often high levels of chloroplast SSR diversity (cHE = 0.83-0.97) were similar to those reported for other Scottish, Iberian and Italian populations (cHE = 0.92-0.99 - [46], [48], [52]) although somewhat higher than those reported from Finland (cHE = 0.56 - [25]). Some authors have hypothesised multiple origins for the Scottish Scots pine population, e.g., through contribution of cryptic glacial refugia ([23], [36], [53], [46]). If true, this might help to explain the high levels of diversity we observed, reflecting a process of admixture following secondary contact.
We detected low levels of population differentiation, which represented less than 2% of the genetic variation among populations for both nuclear and chloroplast markers (Tab. 4). Outcrossing, long-lived trees with wind-mediated gene dispersal mechanisms usually harbour more diversity within populations than among them ([30]). High gene flow among populations counteracts differentiation due to drift and maintains levels of diversity ([55]). Levels of differentiation among populations were very similar for both marker types (1.89% vs. 1.79% for chloroplast and nuclear markers respectively). Although chloroplast loci are expected to show greater differentiation than nuclear loci due to uniparental inheritance, smaller effective population size and higher susceptibility to genetic drift ([37]). However, the extensive pollen flow characteristic of conifers is likely to smooth such differences.
Despite evidence of extensive gene flow and consequently weak overall genetic structure, some significant differentiation among populations was apparent. In particular, the most western population SHI was most differentiated from other populations (greatest FST). The distinctiveness of this population has been reported by other authors ([23], [36], [53]), although the basis for the difference remains uncertain. Some authors have observed unique, low frequency organelle haplotypes in western populations ([36]), suggesting contributions from a western refugium and possibly accounting for its distinctiveness. However, other local factors could explain the difference and resolution of the question awaits markers with sufficient power to conclusively characterise the postglacial colonisation patterns within Scotland.
Weak isolation by distance
Our results showed a weak but significant pattern of IBD across Scotland. IBD occurs as a consequence of limited gene dispersal such that populations close to each other tend to be more genetically similar than populations farther apart ([63]). Several factors are likely to limit seed and pollen flow among the Scottish populations of Scots pine. Firstly, the recently characterised asynchrony in pollen phenology between eastern and western populations within Scotland ([62]) might limit gene transfer among populations even if pollen dispersal is physically possible across the distances concerned. Secondly, the drastic reduction in the effective population sizes and increased population isolation resulting from widespread deforestation in Scotland ([40]) may simply have reduced pollen availability to individual populations. Thirdly, the prevailing wind direction at the time of pollen release in Scotland is from the southwest ([13]). The resulting directional bias in pollen flow may enforce pollen limitation in populations to the west. Given the weak magnitude of IBD and since the described factors might probably contribute simultaneously to the observed pattern, we cannot unambiguously ascribe IBD patterns to a particular mechanism. On the other hand, if the weak magnitude of the IBD signal is driven by relatively recent pollen-release mismatches, then IBD might be expected to be exacerbated in future generations. Gene flow is nevertheless clearly effective in minimising isolation, and IBD is limited.
Some of the Scottish populations showed significant levels of inbreeding (FIS = 0.11-0.21), indicating an excess of homozygotes. Other studies obtaining similar inbreeding values for Scots pine populations (0.07-0.22 - [52], [25]) attributed the homozygote excess to the presence of null alleles ([52]). In our study, only one locus showed evidence of null alleles with a low frequency, therefore this seems unlikely to explain our FIS estimates. Homozygote excess can be also the result of assortative mating, selection against heterozygotes, the Wahlund effect (subpopulation structure - [61], [25]), or drastic reduction in effective population sizes ([3]). However, as nearby populations obtained very different levels of inbreeding (e.g., 0.196 and 0.046 for CRA and CCC, respectively), assortative mating might not be the reason as it is unlikely to occur in adjacent populations because most trees flower at the same time. Furthermore, it seems unlikely to be selection against heterozygotes or a Wahlund effect given that nothing in our data or recent population history point to the existence of unrecognised population substructure. Therefore, the most likely explanation would be a drastic reduction in effective population sizes, as has been previously noted ([40], [27]).
Geographic diversity gradients and predominant patterns of gene flow
Our results indicated increased nuclear genetic diversity towards the East. This West-East (W-E) trend does not fit theoretical expectations based on inferred patterns of post-glacial colonisation, which for Scots pine, and most other native species in Britain, has occurred from south to north ([6]). Such a pattern of colonization is expected to leave greater levels of genetic diversity in the south than in the more recently colonised north ([32]), and has been found in Fagus sylvatica in Britain ([54]), and in other tree species in Ireland ([35]) and mainland Europe ([44]). Equally, the W-E diversity trend does not follow the “central-marginal” hypothesis, which predicts reduced neutral genetic diversity and higher population differentiation towards distribution limits ([15]). Where the S-N model predicts greater diversity in southern areas, the central-marginal model predicts greater diversity in the centre of the distribution, as populations located further from the centre (even in the south) are less connected. Levels of diversity from our populations, which represent the north-western distribution limit of Scots pine, were similar to those in mainland populations ([41], [46], [48]), and no signatures of migration were observed (i.e., a S-N or SE-NW trend). Therefore, it may be that the observed W-E diversity trend reflects more recent gene flow process. On the W-E axis, a predominant driver of gene flow in a species with wind-mediated gene dispersal (seed and pollen) is likely to be wind direction. In Scotland the predominant wind direction is west-south-westerly ([13]), and this would seem to be a likely explanation for the observed pattern.
While levels of diversity will be substantially dependent on past population sizes, asymmetric gene dispersal due to prevailing wind direction can also play an important role in shaping the current distribution of genetic diversity ([18]a). Gene flow patterns were not statistically asymmetric given that gene flow in Scots pine is extensive and can occur over substantial distances ([39], [49]). As there is no reason to suggest the existence of geographical or topographical barriers to gene dispersal, gene flow is likely to link nearby populations in any direction. However a strongly dominant wind direction ([13]) would likely favour consistent gene flow from western to eastern populations but not the converse, resulting over time in a gradient of diversity with lower levels in the populations to which gene flow is more restricted. This effect would be reinforced by the fact that western populations are at the very edge of the distribution, with only ocean beyond them, preventing gene input from upwind. The lack of West-East pattern in allele richness might be explained by the diverging trend in some populations, such us CRA, BWR, MEG and ROT, which showed low allele richness but high nuclear diversity. The explanation for this diverging trend might be due to selection or local bottlenecks (i.e., due to a substantial reduction in population size), which are characterized by large losses in allelic richness but only slight decrease of diversity if population size rebounds rapidly ([10]). Since no West-East pattern was observed in chloroplast haplotype diversity, seed dispersal may be more important than pollen in driving any such directionality in gene flow, an implication that tallies with the likely mobility of the two propagule types.
Conclusions
Native pine forest in Scotland suffered a very substantial historic reduction in abundance. Despite this reduction and the resulting geographical isolation of populations, high levels of genetic variation and low levels of population differentiation still persist, suggesting that effective population size, together with extensive gene flow, has been high enough to limit the effects of genetic drift. This finding highlights the importance of maintaining large effective population sizes, especially in geographically marginal populations, to increase the probability of forest persistence.
Despite potential barriers to gene flow such as population fragmentation or phenological asynchrony, gene flow among populations can still be sufficient to counteract their genetic isolation. However a weak signal of isolation by distance was detectable among the Scottish populations, suggesting that some spatial limitation of gene dispersal occurs, although gene flow is extensive. The detected gene flow patterns and geographic distribution of genetic variation were consistent with gene dispersal limitation due to prevailing wind patterns. From a practical point of view, taking into account such landscape impacts on genetic diversity is important when designing afforestation strategies or determining priorities in conservation and management plans.
Although western populations had relatively lower nuclear diversity, and there was greater differentiation and directional bias of gene flow towards the East, there was no evidence to suggest that any of the populations analysed here are genetically at risk. However, over recent decades, there has been extensive establishment of Scots pine plantations throughout the country and it would be interesting to understand the impact such plantations might have on the diversity and structure of subsequent generations of native Scots pine.
Acknowledgements
We thank the Scottish Forestry Trust, University of Stirling and Centre for Ecology and Hydrology for co-funding this research. We are grateful to COST action FP1102 MaP-FGR (⇒ http://map-fgr.entecra.it/) for supporting researcher mobility during this project.
References
CrossRef | Gscholar
Gscholar
CrossRef | Gscholar
Gscholar
CrossRef | Gscholar
CrossRef | Gscholar
Gscholar
Gscholar
Authors’ Info
Authors’ Affiliation
Alistair S Jump
Biological and Environmental Sciences, Faculty of Natural Sciences, University of Stirling, Stirling FK9 4LA (UK)
Stephen Cavers
NERC Centre for Ecology and Hydrology Edinburgh, Bush Estate, Penicuik, Midlothian EH26 0QB (UK)
Allan Booth
Joanne Russell
The James Hutton Institute, Craigiebuckler, Aberdeen AB15 8QH (UK)
CREAF (Centre de Recerca Ecológica i Aplicacions Forestals), Campus UAB, Edifici C, E-08193, Belaterra, Barcelona (Spain)
Corresponding author
Paper Info
Citation
González-Díaz P, Cavers S, Iason GR, Booth A, Russell J, Jump AS (2018). Weak isolation by distance and geographic diversity gradients persist in Scottish relict pine forest. iForest 11: 449-458. - doi: 10.3832/ifor2454-011
Academic Editor
Fulvio Ducci
Paper history
Received: Apr 06, 2017
Accepted: Apr 19, 2018
First online: Jul 02, 2018
Publication Date: Aug 31, 2018
Publication Time: 2.47 months
Copyright Information
© SISEF - The Italian Society of Silviculture and Forest Ecology 2018
Open Access
This article is distributed under the terms of the Creative Commons Attribution-Non Commercial 4.0 International (https://creativecommons.org/licenses/by-nc/4.0/), which permits unrestricted use, distribution, and reproduction in any medium, provided you give appropriate credit to the original author(s) and the source, provide a link to the Creative Commons license, and indicate if changes were made.

Web Metrics
Breakdown by View Type
Article Usage
Total Article Views: 38945
(from publication date up to now)
Breakdown by View Type
HTML Page Views: 33136
Abstract Page Views: 2588
PDF Downloads: 2595
Citation/Reference Downloads: 7
XML Downloads: 619
Web Metrics
Days since publication: 2124
Overall contacts: 38945
Avg. contacts per week: 128.35
Article Citations
Article citations are based on data periodically collected from the Clarivate Web of Science web site
(last update: Feb 2023)
Total number of cites (since 2018): 1
Average cites per year: 0.17
Publication Metrics
by Dimensions ©
Articles citing this article
List of the papers citing this article based on CrossRef Cited-by.
Related Contents
iForest Similar Articles
Commentaries & Perspectives
The genetic consequences of habitat fragmentation: the case of forests
vol. 2, pp. 75-76 (online: 10 June 2009)
Technical Reports
Conservation and use of elm genetic resources in France: results and perspectives
vol. 13, pp. 41-47 (online: 03 February 2020)
Technical Advances
Gene flow in poplar - experiments, analysis and modeling to prevent transgene outcrossing
vol. 5, pp. 147-152 (online: 13 June 2012)
Research Articles
Patterns of genetic diversity in European beech (Fagus sylvatica L.) at the eastern margins of its distribution range
vol. 10, pp. 916-922 (online: 10 December 2017)
Review Papers
Genetic diversity and forest reproductive material - from seed source selection to planting
vol. 9, pp. 801-812 (online: 13 June 2016)
Research Articles
Networking sampling of Araucaria araucana (Mol.) K. Koch in Chile and the bordering zone of Argentina: implications for the genetic resources and the sustainable management
vol. 2, pp. 207-212 (online: 22 December 2009)
Research Articles
Genetic diversity of core vs. peripheral Norway spruce native populations at a local scale in Slovenia
vol. 11, pp. 104-110 (online: 31 January 2018)
Research Articles
Comparison of genetic parameters between optimal and marginal populations of oriental sweet gum on adaptive traits
vol. 11, pp. 510-516 (online: 18 July 2018)
Review Papers
Indicators of drought effects in Pinus sylvestris: genetic analyses to corroborate the results of empirical methods
vol. 3, pp. 89-91 (online: 15 July 2010)
Technical Reports
Population genetic structure of Platanus orientalis L. in Bulgaria
vol. 4, pp. 186-189 (online: 11 August 2011)
iForest Database Search
Search By Author
Search By Keyword
Google Scholar Search
Citing Articles
Search By Author
Search By Keywords
PubMed Search
Search By Author
Search By Keyword


