Canopy temperature variability in a tropical rainforest, subtropical evergreen forest, and savanna forest in Southwest China
iForest - Biogeosciences and Forestry, Volume 10, Issue 3, Pages 611-617 (2017)
doi: https://doi.org/10.3832/ifor2223-010
Published: May 17, 2017 - Copyright © 2017 SISEF
Research Articles
Abstract
Canopy temperature (Tc) measurements with infrared thermometry have been widely used to assess plant water status. Here, we evaluated Tc and its controlling factors in a primary tropical rainforest (TRF), subtropical evergreen broad-leaved forest (STF) and valley savanna forest (SAF) in southwestern China. We found differences between Tc and air temperature (Ta) of as much as 2.2 °C between the dry and wet seasons in the TRF. However, the canopy-to-air temperature difference (Tc-Ta) was only 0.3 °C between the dry and wet seasons in the STF. Solar radiation (SR) was the dominant factor in Tc-Ta variations during the dry and wet seasons at the three sites. The increased heating in the canopy leaves was likely the result of low stomatal conductance leading to low transpiration cooling. Changes in Tc-Ta in the TRF were highly sensitive to the degree of stomatal closure. The change in Tc-Ta was controlled by the climate, but inherent plant traits, such as stomatal conductance, also played an important controlling role.
Keywords
Canopy Temperature, Drought Stress, Microclimate, Transpiration, Leaf Energy Balance
Introduction
Plant canopy temperature (Tc) is a major driving factor in surface energy fluxes and provides insight into overall plant water status ([2]). Tc measurements with infrared thermometry have been widely used to manage deficit irrigation of field crops. For example, Tc depression has been shown to be significantly related to stomatal conductance across varieties of rice ([16]). Also, 12 infrared temperature sensors were installed in a mature peach orchard, which received different irrigation treatments ([19]). However, few studies have used infrared methods to measure Tc in natural forests. One exception is Leuzinger & Körner ([11]), who illustrated the importance of tree species composition for the local climate through assessments of canopy leaf temperature distribution over space and time for a mixed deciduous forest in NW Switzerland. Canopy architecture has a consistent influence on canopy foliage temperature in diverse, mixed deciduous forests: “dense canopy” species are warmer than “open canopy” species ([14]). Research has also shown that canopy foliage maintains a temperature close to Ta under normal conditions, but significantly warms up with ongoing drought ([14]). Another study demonstrated that Tc has great responsiveness to variations in water status of persimmon trees ([1]): the Tc response to water stress was different for each experimental season. In a year with normal water availability (2009), Tc did not allow detection of the existing differences in plant water status, but during a drought year (2011), water stressed trees had significantly higher Tc than control trees with differences of up to 1.7 °C ([1]).
IPCC-AR4 climate projections anticipated that climate change will increase temperatures, create greater variability in rainfall (both seasonal and annual), and generate more frequent and intense drought events worldwide ([6]). The higher air temperatures in combination with higher atmospheric vapor pressure deficits (δe) will lead to higher transpiration demand. However, under drought stress conditions, water uptake rates cannot match the transpiration demands and leaf stomata close to maintain plant water balance, which in turn leads to higher leaf temperatures ([3], [9]). Overall, different plant species in different vegetation communities are highly variable in functional traits, canopy architecture, rooting depth, and micrometeorological environment. The different responses of plant species to the expected climate changes might also be highly variable. There are still many uncertainties in relation to changes in Tc due to drought stress.
Primary tropical rainforests (TRFs), subtropical evergreen broad-leaved forests (STFs), and savanna forests (SAFs) are among the most important biomes in Southwest China because of their high primary productivity and unique characteristics ([17]). This area is exposed to Asian monsoon regimes from the southwest (Indian Ocean) and from the southeast (Pacific Ocean). Due to the predominant effect of the two monsoons, the climate in the study region is strongly seasonal with a wet season from May to October, and a dry season from November to April ([21]).
From late 2009 through 2010, southwestern China experienced the most severe drought since 1959, providing a unique opportunity to directly evaluate how Tc changed with drought stress in the different forest ecosystems. We know that components of the canopy energy balance, such as solar radiation (SR), wind speed (Ws), Ta, and air relative humidity (RH), affect Tc ([8]). The relative impact of each factor on Tc is likely to be different in different seasons and communities. However, little is known about Tc and its controlling factors in the TRF, STF, and SAF. Detailed studies of Tc are needed in these primary forests to improve our understanding of their potential sensitivity to drought stress.
The objectives of this study were to: (1) quantify the magnitude and seasonal dynamics of Tc and the relative contribution of different factors to Tc in the three forest ecosystems, and (2) evaluate the differences in Tc during normal and drought years.
Methods
Site information
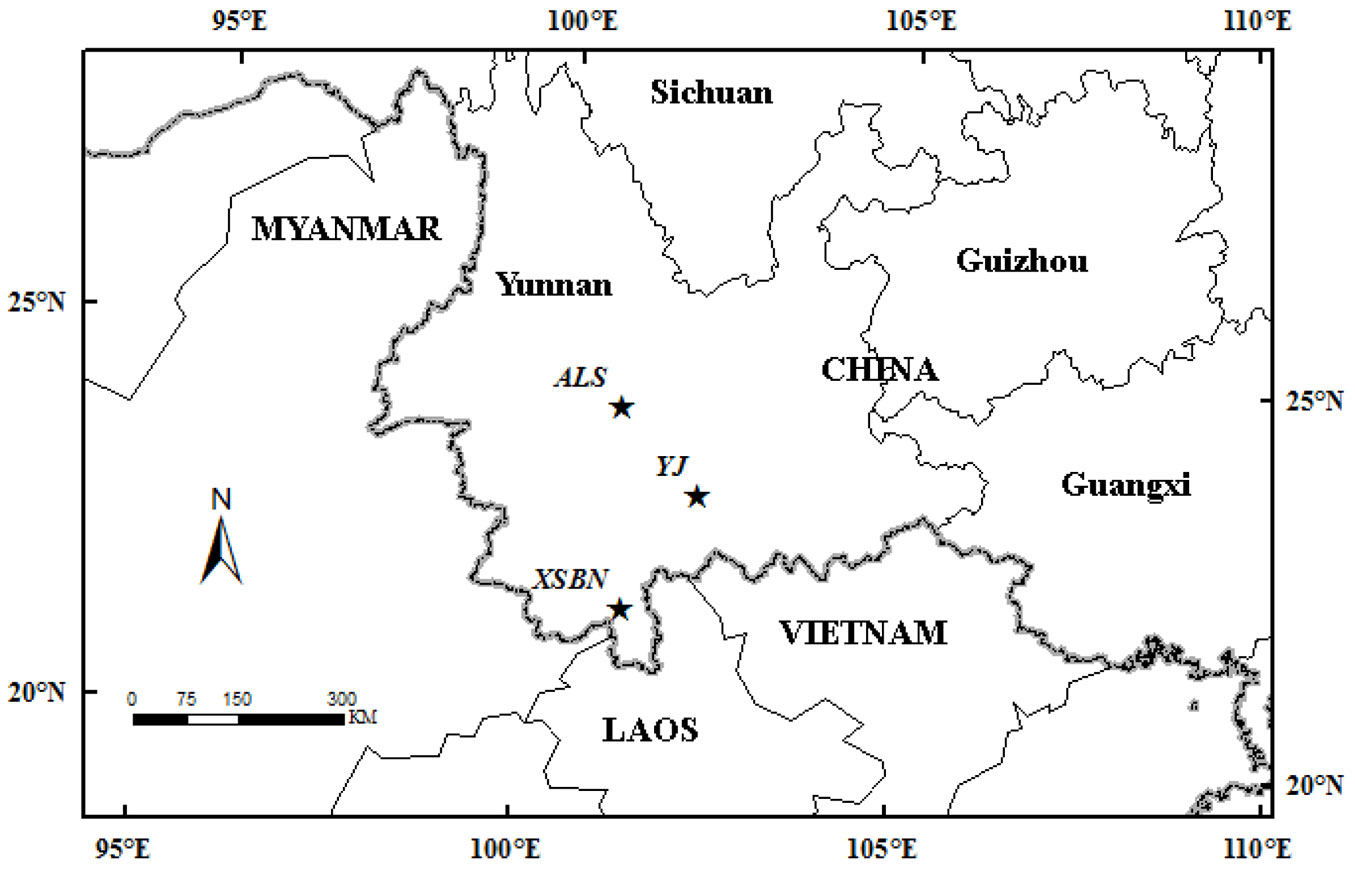
Three typical primary forests (TRF, STF, and SAF) were selected in Yunnan province (Fig. 1) to evaluate Tc variability.
Fig. 1 - The locations of the three study sites (five stars). XSBN is a tropical rainforest (TRF); ALS is a subtropical forest (STF) and YJ is a savanna forest (SAF).
Tropical Rain forest (TRF)
The TRF study site is located in the Menglun Nature Reserve in Xishuangbanna. The site is located at the northern edge of tropical southwestern Asia, and is a transition area between the tropics and the subtropics. The climate is strongly seasonal with two air masses alternating during the year. Between May and October, the Asian monsoon from the Indian Ocean delivers most of the annual rainfall, whereas the dry and cold air of the southern edges of the subtropical jet streams dominates the climate between November and April. The dry season occurs between November and April, and includes a foggy-cool sub-season from November to February and a dry-hot sub-season from March to April. Dominant tree species are Pometia tomentosa, Gironniera subaequalis, and Terminalia myriocarpa. The soil is lateritic derived from siliceous rocks, such as granite and gneiss, with a pH from 4.5 to 5.5.
Subtropical evergreen forest (STF)
The STF site is in the Ailaoshan National Nature Reserve in the Xujiaba region. It lies within a protected section of a 5100 ha evergreen forest with a stand age of more than 300 years ([17]). The forest is primarily dominated by Lithocarpus hancei (Benth.) Rehder, Machilus bombycina, Castanopsis rufescens (Hook.f.et Th.) Huang et Y.T. Chang, and Lithocarpus xylocarpus. The soils are loamy Alfisols, and the 3-7 cm organic carbon horizon had a pH of 4.5.
Savanna forest (SAF)
The SAF site was located in the Yuan River region. The dry climate is due to the strong evapotranspiration in combination with a pronounced 6-month dry season (November-April). Vegetation is dominated by deciduous shrub species. The soil is a ferralic cambisol, containing moderate organic matter, higher N, P, K, Ca, and Mg concentrations, lower cation exchange capacity and moderate pH value, compared to soils of other tropical savannas
The key information of the three sites is shown in Tab. 1 and Fig. S1 (Supplementary material).
Tab. 1 - Site information. (MAT): Mean annual temperature (°C).
| Site | TRF | STF | SAF |
|---|---|---|---|
| Location | 21°55′ 39″ N 101°15′ 55″ E |
24°32′ 17″ N 101°01′ 10″ E |
23°28′ 40″ N 102°10′ 56″ E |
| Elevation | 780 | 2502 | 481 |
| MAT (°C) | 22 | 11 | 24 |
| Rainfall (mm year-1) | 1487 | 1931 | 802 |
| Predominant species | Pometia tomentosa, Gironniera subaequalis |
Machilus bombycina, Lithocarpus chintungensis |
Machilus bombycina |
| Canopy height (m) | 33 | 26 | 5 |
| Soil type | loamy Lateritic Oxisol | loamy Alfisol | ferralic Cambisol |
| Observation period | 2009-2014 | 2009-2014 | 2014 |
Tc and meteorological factors
An infrared temperature sensor (Apogee Instruments Inc., Logan, UT, USA) was installed at each site to measure Tc. The sensors were installed on observational towers (Fig. 2) mounted on 4-cm diameter galvanized metal pipes 3 m above each forest canopy surface. The sensor was aimed at the canopy, with view half angles of approximately 22° from nadir. The absolute accuracy of the sensor is ± 0.2 °C. The radiation detected by an infrared radiometer included two components: (i) radiation directly emitted by the target surface; and (ii) radiation reflected from the background. The second component is often neglected. The magnitude of the two components in the radiation detected by the radiometer was estimated using the emissivity and reflectivity of the target surface ([2]).
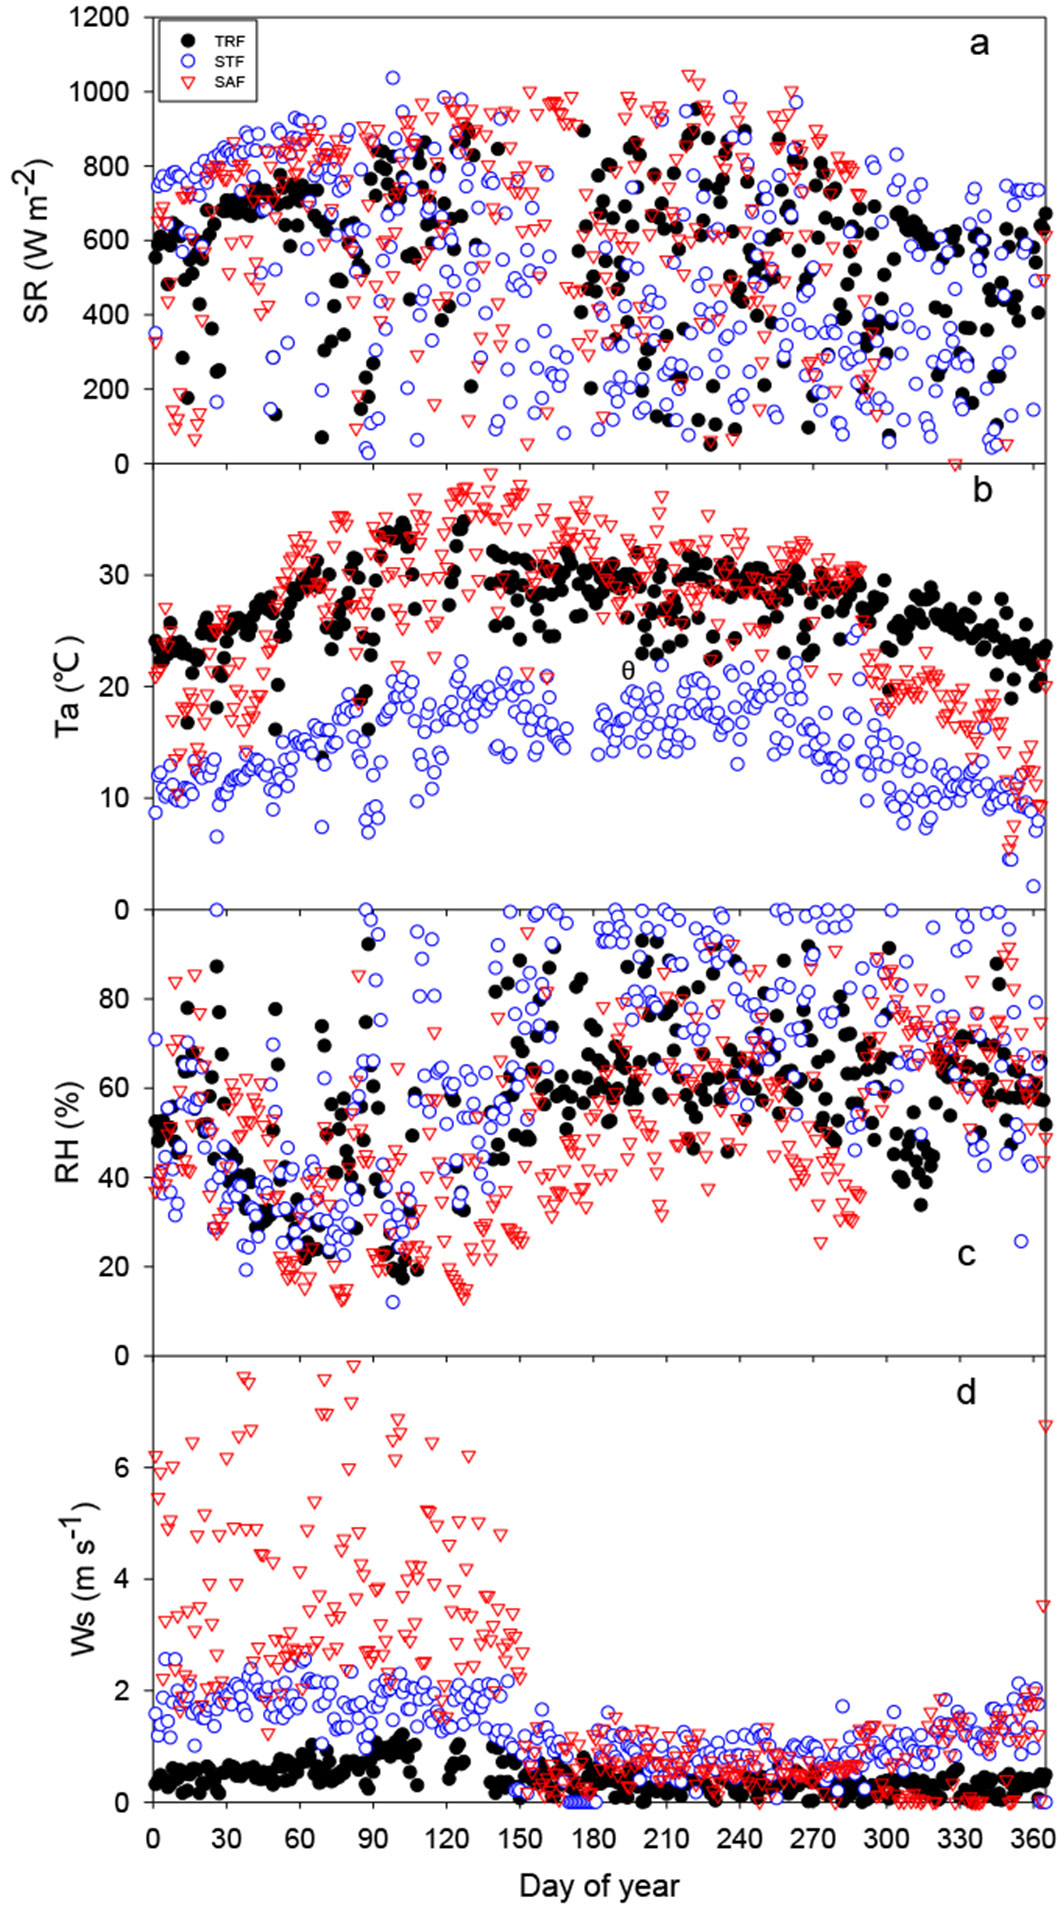
Fig. 2 - Time series of daily micrometeorological variables for the TRF, STF and SAF sites: (a): shortwave incoming radiation (SR), (b): air temperature (Ta), (c): relative humidity (RH), and wind speed (Ws). (TRF): tropical rainforest site; (STF): subtropical evergreen forest site; (SAF): savanna forest site.
Instruments for measuring Ta and RH (HMP45C®, Vaisala, Helsinki, Finland) and wind speed (A100R®, Vector Instruments, Denhighshire, UK) were installed at the same height at each site. Radiation sensors for downward and upward, short and long-wave radiation (CNR-1/CM11®, Kipp & Zonen, Delft, the Netherlands) were installed on a horizontal pole 3 m away from the tower at each site. Profiles of soil moisture were measured at different depths (105T/ 107L®, Campbell Scientific Inc., Logan, UT, USA) at each site. All of the meteorological data were collected by a CR1000® device (Campbell Scientific Inc.) every 30 min at each site.
Sap flow measurement
Measurements of sap flow were made using thermal dissipation probes (Model TDP-30®, Dynamax Inc., Houston, TX, USA). Each probe (30 mm in length and 1.3 mm in diameter) was inserted 30 mm into the sapwood of a sample tree bole at the TRF and STF sites, respectively. All probes were shielded with aluminum foil to minimize temperature fluctuations and avoid direct solar heating in the sapwood, following the procedures described by Wilson et al. ([20]). Sap flow data were collected every minute and were stored on the data logger (Dynamax Inc.). Mean sap flow density (g H2O m-2 s-1) for the sample tree was calculated using the methods of Granier ([5]).
Canopy leaf stomatal conductance measurements
In the wet season, we measured leaf stomatal conductance (gc) using a portable photosynthetic system (LI-6400®, LI-COR, Lincoln, NE, USA) at the TRF and STF sites, respectively. For each species, 3-12 sun-exposed, fully-developed mature leaves from different individuals were selected for stomatal conductance measurements. Measurements were carried out on sunny days between 09:30 and 11:30 a.m.
Leaf energy balance function
We used the leaf energy balance function ([8], [12], [13]) to investigate the possible effects that climate change may have on the canopy-to-air temperature difference (Tc-Ta - eqn. 1):
where ρa is the air density (kg m-3), Cp is the specific heat of air at constant pressure (J kg-1 K-1), raH is the boundary layer resistance to heat (s m-1), γ is the psychrometer constant (Pa K-1), Rn is net radiation (W m-2), δe is the vapour pressure deficit (kPa), ΔraH is the slope of the linearized relationship between Tc-Ta and the vapour pressure deficit of air, and rV is the total resistance to latent heat transport (s m-1).
Results
Meteorological conditions
Fig. 2 shows average values of SR, Ta, RH, and Ws from 11:00-15:00 h for each day of measurements in the three forests. The values of SR for the whole year were scattered and there were no significant differences between the three forests (Fig. 2a). In general, Ta was highest in the SAF throughout the year and was lowest in the STF (Fig. 2b). In particular, Ta in late dry season in the SAF was almost 20 °C higher than in the STF. RH showed contrary patterns (Fig. 2c), and low Ws conditions persisted throughout the whole wet season in the three forests (Fig. 2d).
Seasonal patterns of canopy temperature (Tc)
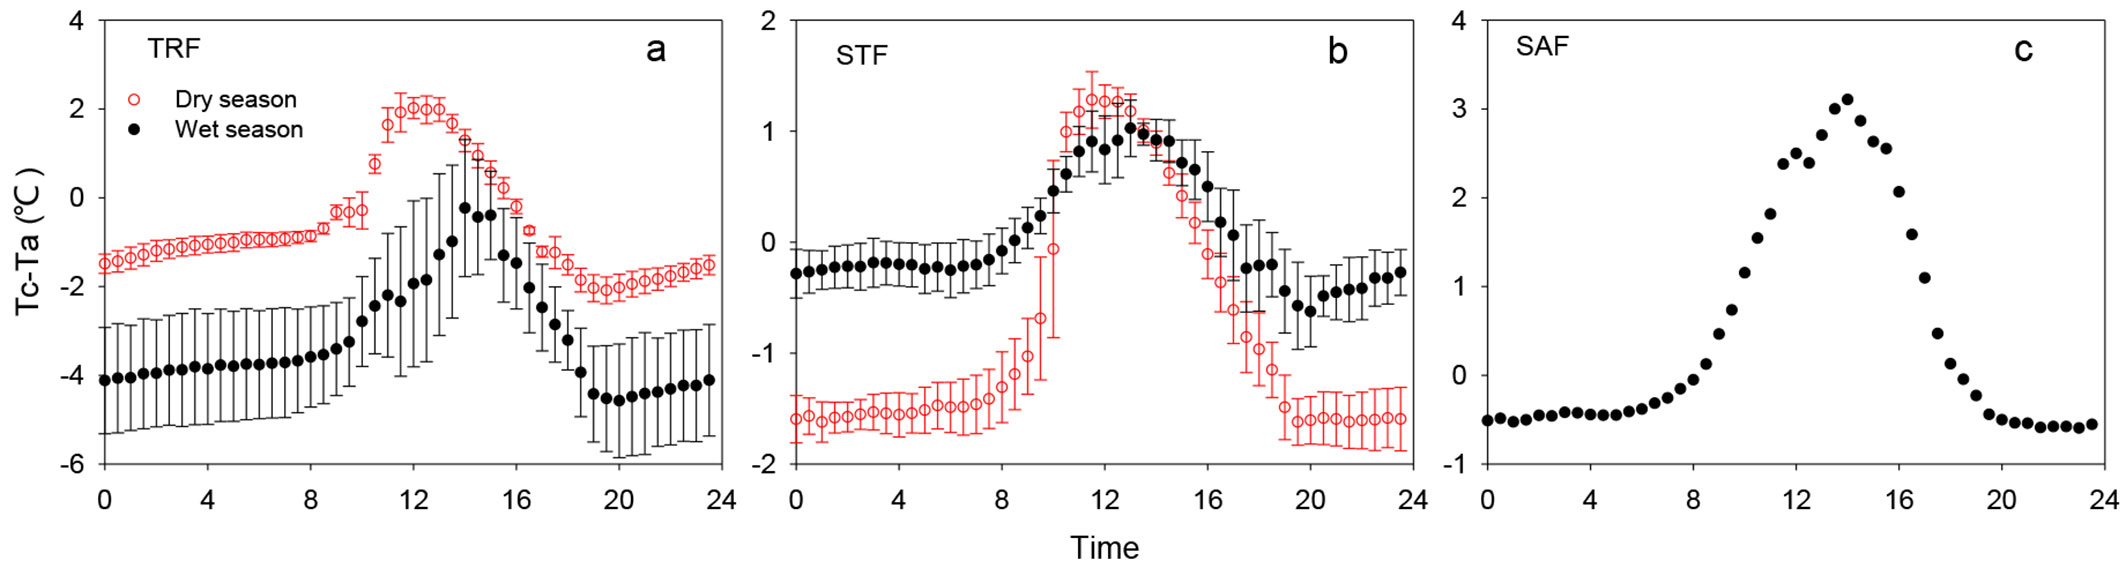
In the TRF, the daily peak of the Tc-Ta appeared to occur at approximately 12:00 h in the dry season, while in the wet season, the maximum Tc-Ta value occurred at 14:00 h (Fig. 3a). The maximum Tc-Ta values in the dry and wet season in the TRF were 2.0 and -0.2 °C, respectively. In the STF, the daily peak values of Tc-Ta in the dry and wet season also appeared to occur around 11:30 h (Fig. 3b), while the maximum Tc-Ta value in the wet season occurred at 13:00 h. The difference of the maximum Tc-Ta value between the dry and wet season in the STF was small and the maximum values of the dry and wet season were 1.3 °C and 1.0 °C, respectively. In the SAF, the maximum Tc-Ta value was about 3.1 °C at 14:00 h in the wet season (growing season - Fig. 3c).
Fig. 3 - Mean diurnal time series of air to canopy temperature difference during dry and wet season at the TRF, STF and SAF sites. (TRF): tropical rainforest site; (STF): subtropical evergreen forest site; (SAF): savanna forest site.
To explore more deeply the influence of microclimate factors on Tc-Ta under the varying climatic conditions, we evaluated the correlations of environmental conditions with Tc-Ta on a statistical basis during the dry and wet seasons. Season-specific multivariable correlations between Tc-Ta and microclimate conditions are shown in Tab. 2. The analysis revealed the relative contribution of each parameter to Tc-Ta. SR is one of the primary factors correlated with Tc-Ta during the dry and wet seasons in the three sites. During the dry season, there was no single important variable in the TRF, but SR was still the most influential (β%=39%). The relative contribution of Ta and RH were almost equivalent at the TRF site. The two climate variables, SR and Ta, accounted for 80% of the variations in Tc-Ta in the STF during the dry season. During the wet season, Ws was the second most significant variable (β% = 21%) at the TRF site. Ws also influenced Tc-Ta significantly at the STF site during the wet season, while Ta and RH were not significant. RH accounted for 30% of the variations in Tc-Ta at the TRF site but was non-significant at the SAF site.
Tab. 2 - Coefficients (B) and relative contributions (β%) to Tc-Ta of the analyzed environmental factors. (TRF): tropical rainforest site; (STF): subtropical evergreen forest site; (SAF): savanna forest site. (**): p<0.01; (*): p<0.05 (t-test).
| Factors | Dry season | Wet season | ||||||||||
|---|---|---|---|---|---|---|---|---|---|---|---|---|
| TRF | STF | SAF | TRF | STF | SAF | |||||||
| B | β% |
B | β% |
B | β% |
B | β% |
B | β% |
B | β% |
|
| SR | 0.003 | 39 | 0.003 | 49** | - | - | 0.009 | 43** | 0.003 | 55** | 0.004 | 54** |
| Ta | -0.073 | 23 | -0.119 | 31* | - | - | -0.351 | 19* | -0.053 | 10 | 0.074 | 14 |
| RH | -0.021 | 25 | -0.004 | 6 | - | - | -0.069 | 17 | -0.021 | 19 | -0.035 | 30 |
| Ws | 0.896 | 13 | -0.51 | 14* | - | - | -4.911 | 21** | -0.743 | 16* | -0.079 | 2 |
Interannual dynamics of Tc
Rainfall has decreased since the wet season of 2009, and the reduced rainfall continued until the end of the dry season in 2010 for the entire region ([18]). Therefore, we selected the middle of the wet season (September) in a drought year (2009) and a normal year (2011) to evaluate how Tc changes with drought stress at the TRF and STF sites.
The daily peak values of Tc-Ta among the normal and drought years at both sites appeared to occur at approximately 13:00-14:00 h, which was consistent with the period of maximum daily solar radiation but before the period in which Ta reached the daily maximum (Fig. 4a). There was virtually no difference in Tc-Ta values during the night when there was no solar heating. Tc-Ta values in the drought year (2009) were higher than in the normal year (2011) for both sites. The maximum Tc-Ta values for the drought year and normal year were 0.78 °C and -0.36 °C in the TRF; and 1.18 °C and -0.01 °C in the STF, respectively. Thus, the difference of Tc-Ta between the drought and normal years in both sites was about 1.1 °C.
Fig. 4 - Mean diurnal time series of SR, Ta, RH, and Ws on September 2009 and 2010 at TRF and STF sites. (TRF): tropical rainforest site; (STF): subtropical evergreen forest site.
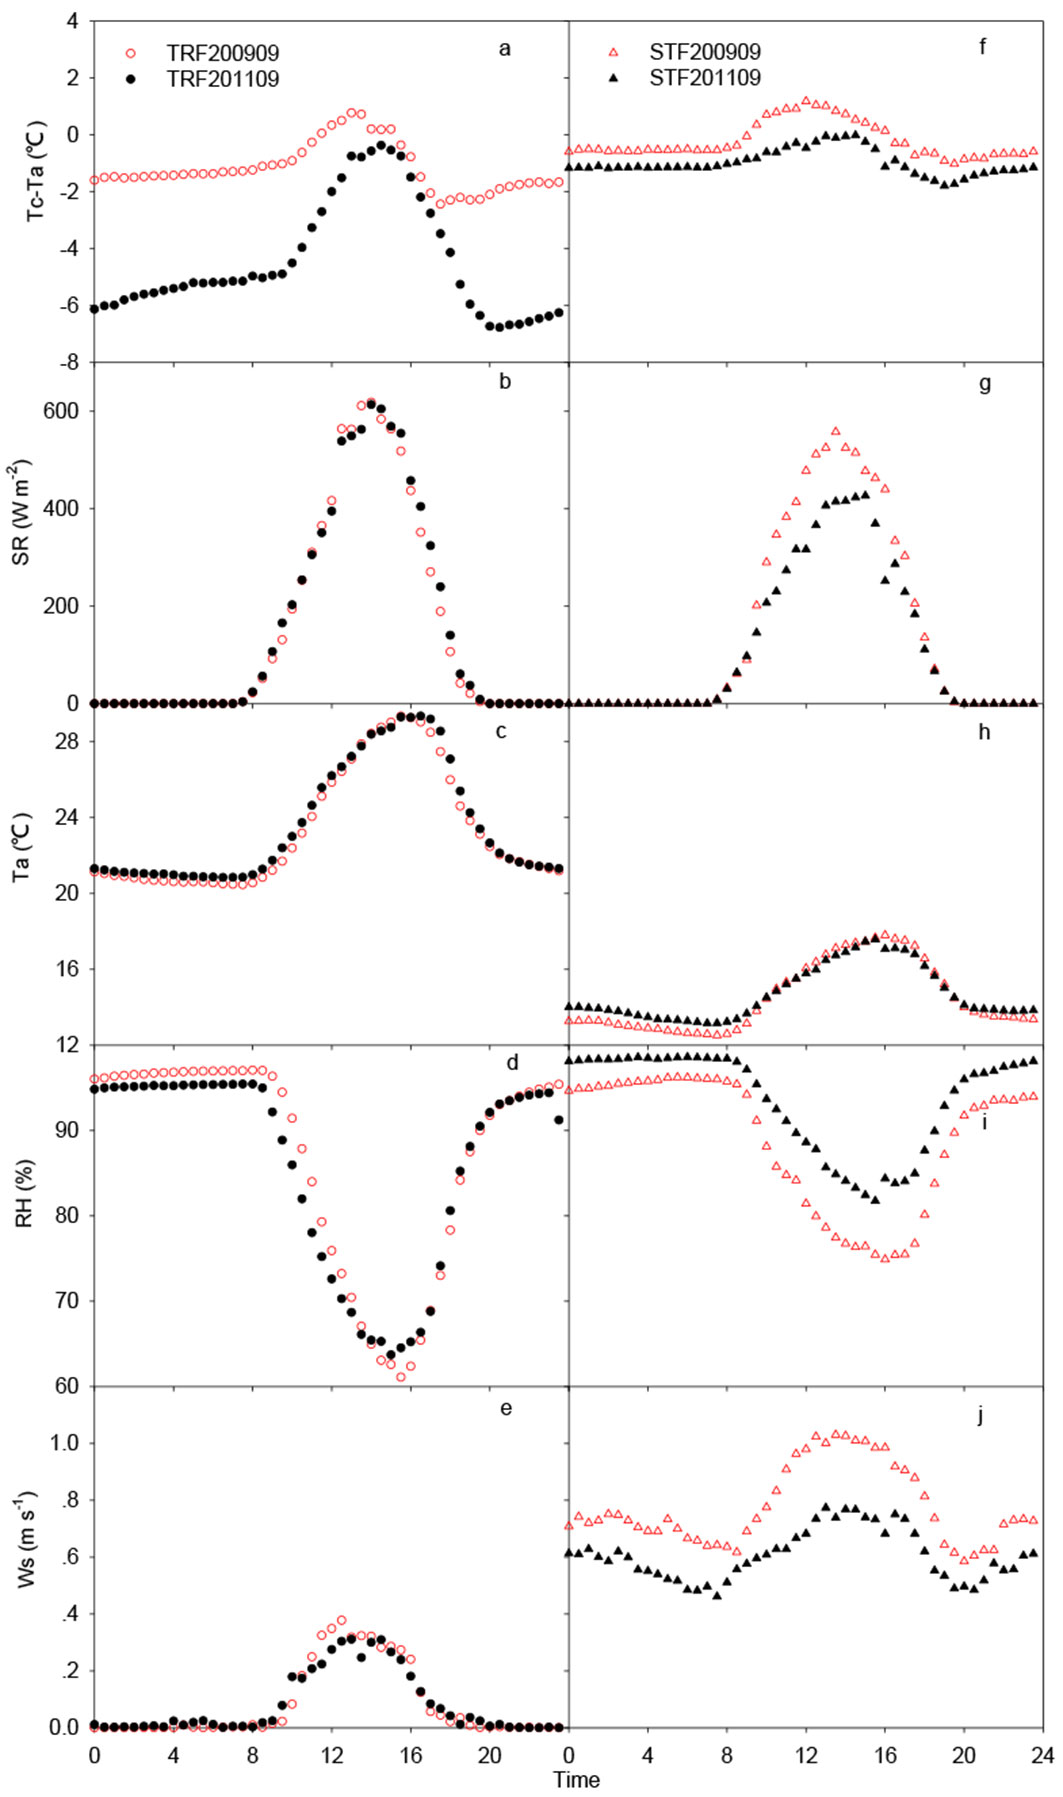
Similarly, we also analyzed the relative contribution of each parameter to daylight (10:00-17:00 h) Tc-Ta during the drought and normal years at both sites. In the TRF, SR and Ws affected Tc-Ta both in drought and normal years. The relative contribution of SR in the normal year (2011) was higher than that in the drought year (2009, β% = 19% - Tab. 3). The relative contribution (β% = 32%) of Ws in the normal year (2011) was also higher than that in the drought year (2009, β% = 10%) in the TRF. In contrast, the RH contribution in the drought year (β% = 30%) was twice as much as that in the normal year (β% = 15% - Tab. 3).
Tab. 3 - The coefficients (B) and relative contributions (β%) of environmental factors are presented for each variable. (TRF): tropical rainforest site; (STF): subtropical evergreen forest site; (SAF): savanna forest site. (**): p<0.01; (*): p<0.05 (t-test).
| Factors | TRF | STF | ||||||
|---|---|---|---|---|---|---|---|---|
| 2009 | 2011 | 2009 | 2011 | |||||
| B | β% | B | β% | B | β% | B | β% | |
| SR | 0.004 | 19** | 0.004 | 32** | 0.004 | 32** | 0.005 | 23** |
| Ta | -0.652 | 41 | 0.202 | 24 | -0.611 | 47 | -0.984 | 42 |
| RH | -0.113 | 30 | -0.035 | 15 | -0.043 | 13 | -0.202 | 33 |
| Ws | 2.744 | 10* | 5.745 | 29* | 1.477 | 8 | -0.790 | 2 |
In the STF, SR also affected Tc-Ta in both years significantly. The relative contribution (β% = 32%) of SR in the drought year (2009) was higher than that in normal year (2011, β% = 23% - Tab. 3).
Tc-Ta variations in a changing climate
Based on the results described above, we collected data for the standard meteorological conditions at the three sites. For gc of the sample tree species at the SAF site, we used the gc values from the literature ([22]) for the same site.
Increasing drought frequency has the potential to affect the carbon and water cycle in forest ecosystems. Warmer global temperatures are expected to cause an intensification of the hydrologic cycle, with increased evaporative demand for ecosystems. As mentioned above, plants under drought stress decrease stomatal conductance, thereby reducing transpiration and increasing Tc. Therefore, we assumed a decrease to 25%, 50%, and 75% of maximum gc values at the three sites in our examination of the differences in Tc between the three forest ecosystems in a changing climate.
Tc-Ta was very sensitive to all simulated meteorological conditions (Fig. 5). Tc-Ta increased linearly with increasing SR and RH. Tc-Ta also decreased non-linearly with increasing Ta and Ws (Fig. 5). Our simulation results were consistent with the research by Maes et al. ([12], [13]). Tc-Ta increased sharply with SR at all gc levels and sites. At the same level of gc, Tc-Ta had a steeper increase with increasing SR in the STF than the other two sites (Fig. 5a-c), on average, approximately 2 °C higher than the other two sites. However, the difference of Tc-Ta at three gc levels with increasing SR in the STF was smallest, indicating that the change in Tc-Ta was relatively insensitive to the degree of stomatal closure. In contrast, the difference in Tc-Ta at the three gc levels in the TRF became larger with increasing SR. In the TRF, the standard Ta was higher than at STF, while RH in the TRF was lower than in the STF, suggesting that standard δe in the TRF was higher than in the STF. Therefore, evaporative demand was significantly higher in the TRF than in the STF. Additionally, TRF had the highest gc of the three sites, indicating that gc could still maintain relatively high absolute values even with partial stomatal closure in the TRF. Consequently, canopy transpiration in the TRF corresponding to higher gc was relatively higher than in the STF ([24], [23]), leading to high canopy transpirative cooling (lower Tc-Ta) at the same level of SR (Fig. 5a).
Fig. 5 - Influence of climate conditions on (Tc-Ta), including: shortwave incoming radiation (SR), air temperature (Ta), vapor pressure deficit (VPD), and wind speed (Ws), for three levels of gc at the rubber plantation (a, c, e, g) and the tropical rainforest sites (b, d, f, h).
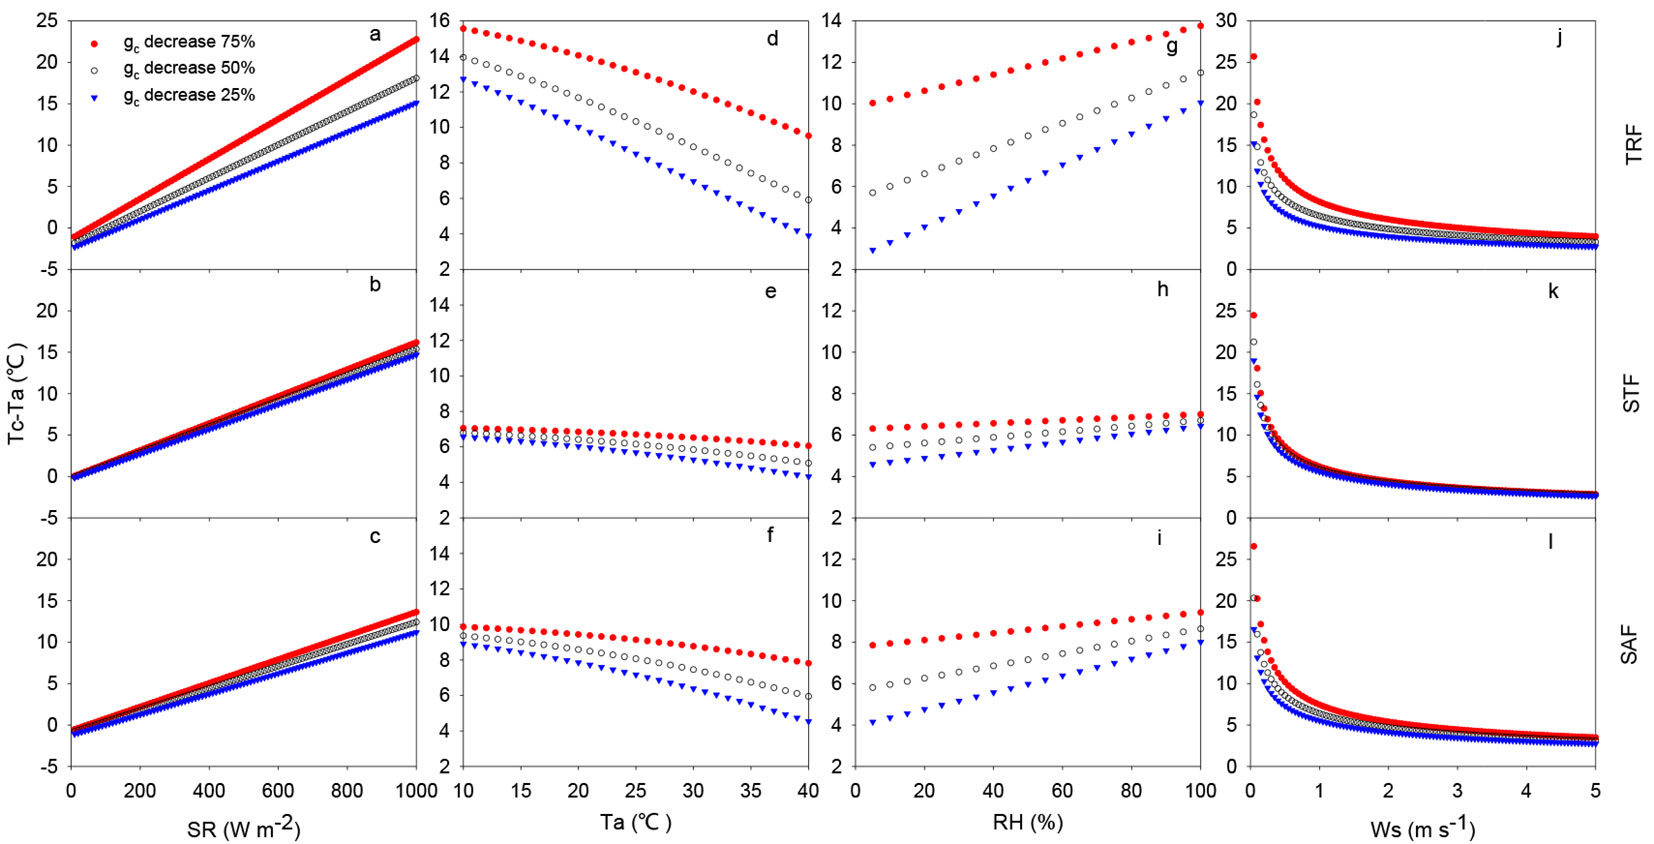
Tc-Ta showed significant opposite patterns with increasing Ta and RH (Fig. 5d-i), indicating that Tc-Ta decreased with increasing δe. Similarly, the difference of Tc-Ta at three gc levels with increasing Ta or δe in the STF site was small while the differences were large in the TRF and SAF. In the STF, Tc-Ta decreased slightly with increasing Ta or VPD, indicating that Tc-Ta did not particularly depend on Ta or δe at low gc levels (Fig. 5e). In contrast, Tc-Ta was highly sensitive to the increasing Ta or VPD in the TRF, due to relatively more open stomata and higher canopy transpiration.
Overall, Tc in the three forests responded very differently to the climate change. The change in Tc-Ta was controlled by the climate, but plant inherent traits, such as stomatal conductance, also played an important controlling role.
Discussion
Seasonal variations in Tc-Ta
Tc-Ta in the different seasons exhibited distinct diurnal cycles at the three sites. Our study showed Tc-Ta differences of as much as 2.2 °C between the dry season and the wet season in the TRF. However, Tc-Ta differences were only 0.3 °C between the dry and the wet season in the STF. A combined analysis of the four controlling variables (SR, Ta, RH, and Ws) across the three sites indicated a clear distinction between the dry and wet season with respect to the control Tc-Ta. SR was the dominant factor in Tc-Ta variations during the dry and wet seasons at the three sites (Tab. 2). This clearly indicated that the input of radiation energy mostly drives Tc-Ta, a result that was also found by Maes et al. ([12]). All the effects of the micrometeorological factors were variable among the seasons and sites, which means that focusing on seasons was critical to better understand Tc patterns ([19]). This highlights the importance of large seasonal variability in the Asian monsoon region, which leads to a shift in the dominant factors between seasons.
Plants under soil water deficit decrease stomatal conductance, thereby reducing transpiration and increasing leaf temperature. At TRF and STF sites, measurements conducted with sap flow methods showed that canopy transpiration for dominant tree species in the dry season were lower than in the wet season at both sites (Fig. S2 in Supplementary material). The reduction in transpiration in the dominant canopy trees during the dry season (with high evaporative demand) could partly explain the increase in Ta differences of the canopy (Fig. 3).
Interannual variations in Tc-Ta
Tc-Ta variations do correspond with variations in SR, Ta, RH, and Ws in the different seasons. Hence, it is important to keep in mind that variations in Tc-Ta in the dry and wet season at the same site do not necessarily result solely from soil water availability. Tc-Ta variations can also be an indication of the relative changes in plant transpiration under similar micrometeorological conditions at the same site. To ensure that the changes in Tc-Ta were connected to changes in transpiration, we selected the same period (September) in 2009 and 2011.
In the TRF, there was no significant difference between all of the micrometeorological conditions in September during the drought (2009) and the normal year (2010) mean values in the TRF (paired t-test: p = 0.07 - Fig. 4b-d), indicating that micrometeorological conditions were similar during the study period in 2009 and 2011. Tc-Ta at noon in 2009 was higher by about 1 °C than that in 2011. The increased heating in the canopy leaves in 2009 was likely the result of low stomatal conductance, leading to low transpiration cooling. During sunny days, canopy transpiration was the main contribution to evapotranspiration (latent heat flux), because soil and canopy evaporation were exceptionally low in days without rainfall. The mean latent heat flux values in September in 2009 and 2011 in the TRF were 179 W m-2 and 212 W m-2, respectively. Therefore, the latent heat flux data by eddy covariance method proved that the higher Tc-Ta in 2009 was due to a reduction in canopy transpiration, as the latent heat flux was lower than in 2011. During the drought period, trees saved soil water by increasing the surface resistance and reducing the transpiration rate, and for this reason, the canopy maximum temperature exceeded the optimum temperature. We observed a Tc-Ta of 0.78 °C for the drought year in the TRF, which was consistent with the reported 0.6-0.8 °C for a temperate forest with “dense canopies” at the beginning of a drought period ([14]).
Wang & Gartung ([19]) found that the midday Tc-Ta in a water-stressed, deficit irrigation treatment of peach trees were in the range 5-7 °C. The maximum Tc difference between deficit-irrigated and control trees observed in persimmon trees was 4 °C ([1]), while the maximum Tc difference between drought year and normal year was about 1 °C in the TRF. The possible reasons for the lower Tc-Ta found in the tropical rain forest include: (i) tree species in the tropical rain forest are highly diversified in canopy architecture. The temperature of the branches and self-shaded leaves were not measured, resulting in an underestimation of the actual Tc. This might be a general problem in natural forests ([14]). (ii) Most studies dealing with drought effects on Tc on crops have worked with precise irrigation treatments for determining the Tc to the difference in drought stress level, such as irrigated 50% evapotranspiration and irrigated 25-33% ([3], [19], [1]). Therefore, the Tc of crops might be more sensitive to severe drought stress in the irrigation treatments.
To evaluate the effect of drought stress on soil water, we analyzed the water content in the soil profile at both sites (Fig. S3 in Supplementary material). We found that although the total rainfall in 2009 was 30% lower compared with the average value for the past 50 years in this region ([15]), deep soil moisture did not decrease significantly (Fig. S3b in Supplementary material). The dominant canopy tree species have deep roots and can use deep soil water ([10]). The deeper roots of the larger canopy dominant trees could be the reason for the lower impact of soil drought on Tc in larger trees, even in the drought environment. If there was not a sufficient amount of water in the entire soil profile for canopy cooling, Tc-Ta could be increased continually ([4]).
In the STF, the maximum difference in Tc between the drought year and normal year was also about 1 °C. However, the micrometeorological conditions, such as SR, RH, and Ws, were different between the drought and normal year (Fig. 4g-j). Consequently, the Tc difference should correspond with variations in the micrometeorological conditions.
Overall, infrared Tc is a result of the energy balance, micrometeorological conditions, and plant-controlled transpiration. Measurement methods provide a tool for assessment and planning for water stress in the different seasons.
Implications and uncertainties regarding Tc measurements in forests
Infrared Tc measurements provided a useful evaluation of plant response to environmental stress in different forest ecosystems. Infrared Tc measurements are automatic and effective, providing an alternative option to conventional methods such as stomatal conductance or stem water potential measurements in monitoring plant water status ([7], [9], [19], [1]).
However, monitoring Tc with an infrared temperature sensor in a fixed position only partially covers the canopy, and the data are too limited to account for variations in the entire canopy and differences between species, particularly for high diversity tropical and subtropical forests. For example, canopy architecture has a consistent influence on canopy foliage temperature, in that “dense canopy” species are warmer than “open canopy” species ([14]). In addition, the temperature of shaded leaves is lower than the sunlit leaves of the same trees ([1]). The use of Tc measurements to detect plant water stress appears to be more precise in tree species with larger leaf sizes than species with smaller leaves ([1]). Leaf adaptations of some species to drought, namely smaller leaf dimensions and more vertically oriented leaves, also result in lower Tc-Ta ([12]). Despite the fact that infrared Tc measurements can be used as a water stress indicator, there has yet to be a critical assessment of the relationship between Tc and plant species composition, canopy structure, and leaf functional traits.
Conclusions
The four meteorological controlling variables (SR, Ta, RH, and Ws) across the three sites indicated a clear distinction between the dry and wet season with respect to the control of Tc-Ta. SR was the dominant factor in Tc-Ta variations during the dry and wet seasons in all three sites. Tc-Ta at noon in the drought year (2009) was about 1 °C higher than Tc-Ta in a normal year (2011) in the TRF. The increased heating of canopy leaves in the drought year (2009) was likely the result of low stomatal conductance leading to low transpiration cooling. Changes in Tc-Ta in the TRF were highly sensitive to the degree of stomatal closure, while changes in Tc-Ta in the STF were relatively insensitive to the degree of stomatal closure. Changes in Tc-Ta were controlled by climate conditions, but plant inherent traits, such as stomatal conductance, also played important driving roles.
Acknowledgements
We thank Lei Yu, Meng-Nan Liu and Qi Luo for their assistance in the field. This work was supported by the Xishuangbanna Ecological Station for Tropical rain forest, the Ailaoshan Station for Subtropical Forest Ecosystem Research and the Yuanjiang Savanna Ecological station. This study was funded by the National Natural Science Foundation of China (41671209, U1602234, 41405143), the Yunnan Natural Science Foundation of Yunnan Province, China (2013FB077) and the National Key Research and Development Program of China (2016YFC0502105).
References
Gscholar
CrossRef | Gscholar
CrossRef | Gscholar
Authors’ Info
Authors’ Affiliation
Yi-Ping Zhang
Li-Qing Sha
Xiao-Bao Deng
Yun Deng
Chuan-Sheng Wu
Zhi-Yun Lu
Ai-Guo Chen
Shu-Bin Zhang
Pei-Guang Li
Wen-Jun Zhou
Yun-Tong Liu
Key Laboratory of Tropical Forest Ecology, Xishuangbanna Tropical Botanical Garden, Chinese Academy of Sciences, Menglun 666303 (China)
Yi-Ping Zhang
Li-Qing Sha
Chuan-Sheng Wu
Wen-Jun Zhou
Yun-Tong Liu
Global Change Ecology Group, Xishuangbanna Tropical Botanical Garden, Chinese Academy of Sciences, Menglun 666303 (China)
Yun Deng
Xishuangbanna Station for Tropical Rain Forest Ecosystem Studies, Menglun 666303 (China)
Chuan-Sheng Wu
Zhi-Yun Lu
Ailaoshan Station for Subtropical Forest Ecosystem Studies, Jingdong 676209 (China)
Shu-Bin Zhang
Pei-Guang Li
Yuanjiang Savanna Ecosystem Research Station, Xishuangbanna Tropical Botanical Garden, Chinese Academy of Sciences, Yuanjiang (China)
University of Chinese Academy of Sciences, Beijing 100049 (China)
Corresponding author
Paper Info
Citation
Song Q-H, Zhang Y-P, Sha L-Q, Deng X-B, Deng Y, Wu C-S, Lu Z-Y, Chen A-G, Zhang S-B, Li P-G, Zhou W-J, Liu Y-T (2017). Canopy temperature variability in a tropical rainforest, subtropical evergreen forest, and savanna forest in Southwest China. iForest 10: 611-617. - doi: 10.3832/ifor2223-010
Academic Editor
Silvano Fares
Paper history
Received: Sep 21, 2016
Accepted: Mar 26, 2017
First online: May 17, 2017
Publication Date: Jun 30, 2017
Publication Time: 1.73 months
Copyright Information
© SISEF - The Italian Society of Silviculture and Forest Ecology 2017
Open Access
This article is distributed under the terms of the Creative Commons Attribution-Non Commercial 4.0 International (https://creativecommons.org/licenses/by-nc/4.0/), which permits unrestricted use, distribution, and reproduction in any medium, provided you give appropriate credit to the original author(s) and the source, provide a link to the Creative Commons license, and indicate if changes were made.

Web Metrics
Breakdown by View Type
Article Usage
Total Article Views: 41625
(from publication date up to now)
Breakdown by View Type
HTML Page Views: 35580
Abstract Page Views: 1829
PDF Downloads: 3186
Citation/Reference Downloads: 59
XML Downloads: 971
Web Metrics
Days since publication: 2530
Overall contacts: 41625
Avg. contacts per week: 115.17
Article Citations
Article citations are based on data periodically collected from the Clarivate Web of Science web site
(last update: Feb 2023)
Total number of cites (since 2017): 3
Average cites per year: 0.43
Publication Metrics
by Dimensions ©
Articles citing this article
List of the papers citing this article based on CrossRef Cited-by.
Related Contents
iForest Similar Articles
Research Articles
Leaf transpiration of drought tolerant plant can be captured by hyperspectral reflectance using PLSR analysis
vol. 9, pp. 30-37 (online: 05 October 2015)
Research Articles
Oak sprouts grow better than seedlings under drought stress
vol. 9, pp. 529-535 (online: 17 March 2016)
Research Articles
Quantifying the vertical microclimate profile within a tropical seasonal rainforest, based on both ground- and canopy-referenced approaches
vol. 15, pp. 24-32 (online: 27 January 2022)
Research Articles
Developing stand transpiration model relating canopy conductance to stand sapwood area in a Korean pine plantation
vol. 14, pp. 186-194 (online: 14 April 2021)
Research Articles
Effects of mild drought on the morphology of sun and shade needles in 20-year-old Norway spruce trees
vol. 12, pp. 27-34 (online: 10 January 2019)
Research Articles
Comparison of drought stress indices in beech forests: a modelling study
vol. 9, pp. 635-642 (online: 06 May 2016)
Research Articles
Sap flow, leaf-level gas exchange and spectral responses to drought in Pinus sylvestris, Pinus pinea and Pinus halepensis
vol. 10, pp. 204-214 (online: 01 November 2016)
Research Articles
Effect of drought stress on some growth, morphological, physiological, and biochemical parameters of two different populations of Quercus brantii
vol. 11, pp. 212-220 (online: 01 March 2018)
Research Articles
Relationships between leaf physiognomy and sensitivity of photosynthetic processes to freezing for subtropical evergreen woody plants
vol. 12, pp. 551-557 (online: 17 December 2019)
Research Articles
Response of juvenile progeny of seven forest tree species and their populations to simulated climate change-related stressors, heat, elevated humidity and drought
vol. 11, pp. 374-388 (online: 15 May 2018)
iForest Database Search
Search By Author
Search By Keyword
Google Scholar Search
Citing Articles
Search By Author
Search By Keywords
PubMed Search
Search By Author
Search By Keyword


