
Comparison of range-wide chloroplast microsatellite and needle trait variation patterns in Pinus mugo Turra (dwarf mountain pine)
iForest - Biogeosciences and Forestry, Volume 10, Issue 1, Pages 250-258 (2017)
doi: https://doi.org/10.3832/ifor1860-009
Published: Feb 11, 2017 - Copyright © 2017 SISEF
Research Articles
Abstract
In this study, range-wide genetic variation was analysed in 553 Pinus mugo Turra (dwarf mountain pine) individuals from 21 locations using 11 chloroplast microsatellites. Our main goal was to assess the spatial distribution of neutral genetic variation. We also used data from a previous study on the morphological variation of needles from 18 stands of P. mugo. In total, 22 needle characteristics were reanalysed and compared to microsatellite data to describe the distribution of morphological variation in the context of neutral genetic variation. We hypothesised that the chloroplast microsatellite and needle trait variation patterns would not entirely overlap. The results indicate the recent divergence of P. mugo populations derived from a formerly larger distribution. We identified 4 genetic and 3 morphological clusters whose spatial distribution overlapped only to some extent. The distribution of genetic variation showed a south-north pattern with signs of admixture in the Alps and Carpathians. Two south-westernmost stands from Italy were evidently isolated from the others. In contrast, morphological variation tended to display a west-east pattern. A separate group based on needle traits was formed mostly by eastern stands and was not observed by microsatellite analysis. In addition, a few needle characteristics significantly correlated with longitude and climate variables. These findings suggest that eastern populations of P. mugo may be of different origin and/or that some needle characteristics may be adaptively important in these locations. The potential roles of past demographic events, phenotypic plasticity and local adaptation in shaping the patterns of genetic and morphological variation in P. mugo are discussed.
Keywords
Adaptation, cpSSRs, Genetic Diversity, Morphological Variation, Neutral Genetic Markers, Phenotypic Plasticity
Introduction
Late Quaternary history, including the postglacial recolonisation of tree species, has been traced back using palynological and macrofossil records, and molecular markers (e.g., [27], [1], [40]). In general, the distribution of the present genetic variation observed in forest tree species is the outcome of postglacial recolonisation that began approximately 18.000 years ago from refugia located in Southern Europe ([25]). The traditional view is that during the last glaciation trees were restricted to southern refugia. However, growing evidence supporting the simultaneous presence of tree species in Central and Eastern Europe has called this view into question ([52]). Such populations may have experienced repeated retreats and expansions during warm and cold periods of the Pleistocene, being alternately isolated or connected by gene flow. In addition, cold-adapted alpine species could have migrated to higher elevations during warmer interglacials, as they do now due to climate warming. Consequently, these species could have differentiated due to isolation and genetic drift ([42]). The influence of isolation and past range shifts on the present differentiation of such populations remains largely unknown, as patterns of genetic and morphological variation across distribution ranges of tree species are usually not well characterised.
Pinus mugo Turra (dwarf mountain pine) is one of the keystone forest tree species of mountain areas in Europe. This species forms shrubs up to a few metres in height. It is common in the Carpathians and Eastern Alps, where it prevents avalanches and soil erosion, and is a member of the P. mugo complex - phenotypically a very diverged group of closely related pine species. P. mugo is also closely related to Pinus sylvestris L., which has the widest Eurasian distribution range of all pine species and is the only relative capable of hybridising with pines from the P. mugo complex within their present range ([50]).
Palynological records are insufficient to infer historical demographic processes of P. mugo and other species from the P. mugo complex because the pollen of its members is very similar to the pollen of P. sylvestris and Pinus nigra Arn. ([53]). Macrofossil data also cannot distinguish the species properly ([19]). Mitochondrial genetic markers initially developed for P. sylvestris ([45], [40]) show a too low resolution for fine-scale phylogeographic studies in P. mugo ([49]). Moreover, studies concerning the neutral genetic differentiation of the species are limited only to some areas of its present range ([32], [44], [24], [43], [14]). In contrast, the morphological differentiation of P. mugo has been widely studied. Eastern populations of P. mugo have been shown to differ from other populations with regard to needle trait variation ([10], [9], [8]).
In this study, we used a set of chloroplast microsatellite loci and needle characteristics to assess the patterns of the genetic and morphological diversity of P. mugo populations covering the native range of the species. Chloroplast DNA (cpDNA) in conifers does not recombine, and the genome is transferred uniparentally by pollen. Because cpDNA microsatellites are thought to show neutral variation, we used these markers to see which locations may be of different origin and have distinct demographic history. Overall, low differentiation at neutral markers is expected for high-outcrossing and wind-pollinated species, in which gene flow has a highly homogenising effect on genetic diversity across a large geographic range. Morphological differentiation may result from population divergence due to isolation and genetic drift or from natural selection for adaptively important traits. Additionally, environmental differences can affect plastic traits, contributing to morphological differentiation. In this paper, we aimed (1) to describe the distribution of neutral genetic variation at cpSSRs and (2) to describe the distribution of morphological variation in the context of neutral genetic variation. In addition, by comparing the present distribution of genetic and morphological variation and correlating morphological traits with climate conditions, we tested whether the factors that shape the distribution of morphological variation were (1) demographic factors, (2) environmental factors or (3) a combination of demographic and environmental factors.
Materials and methods
Plant material
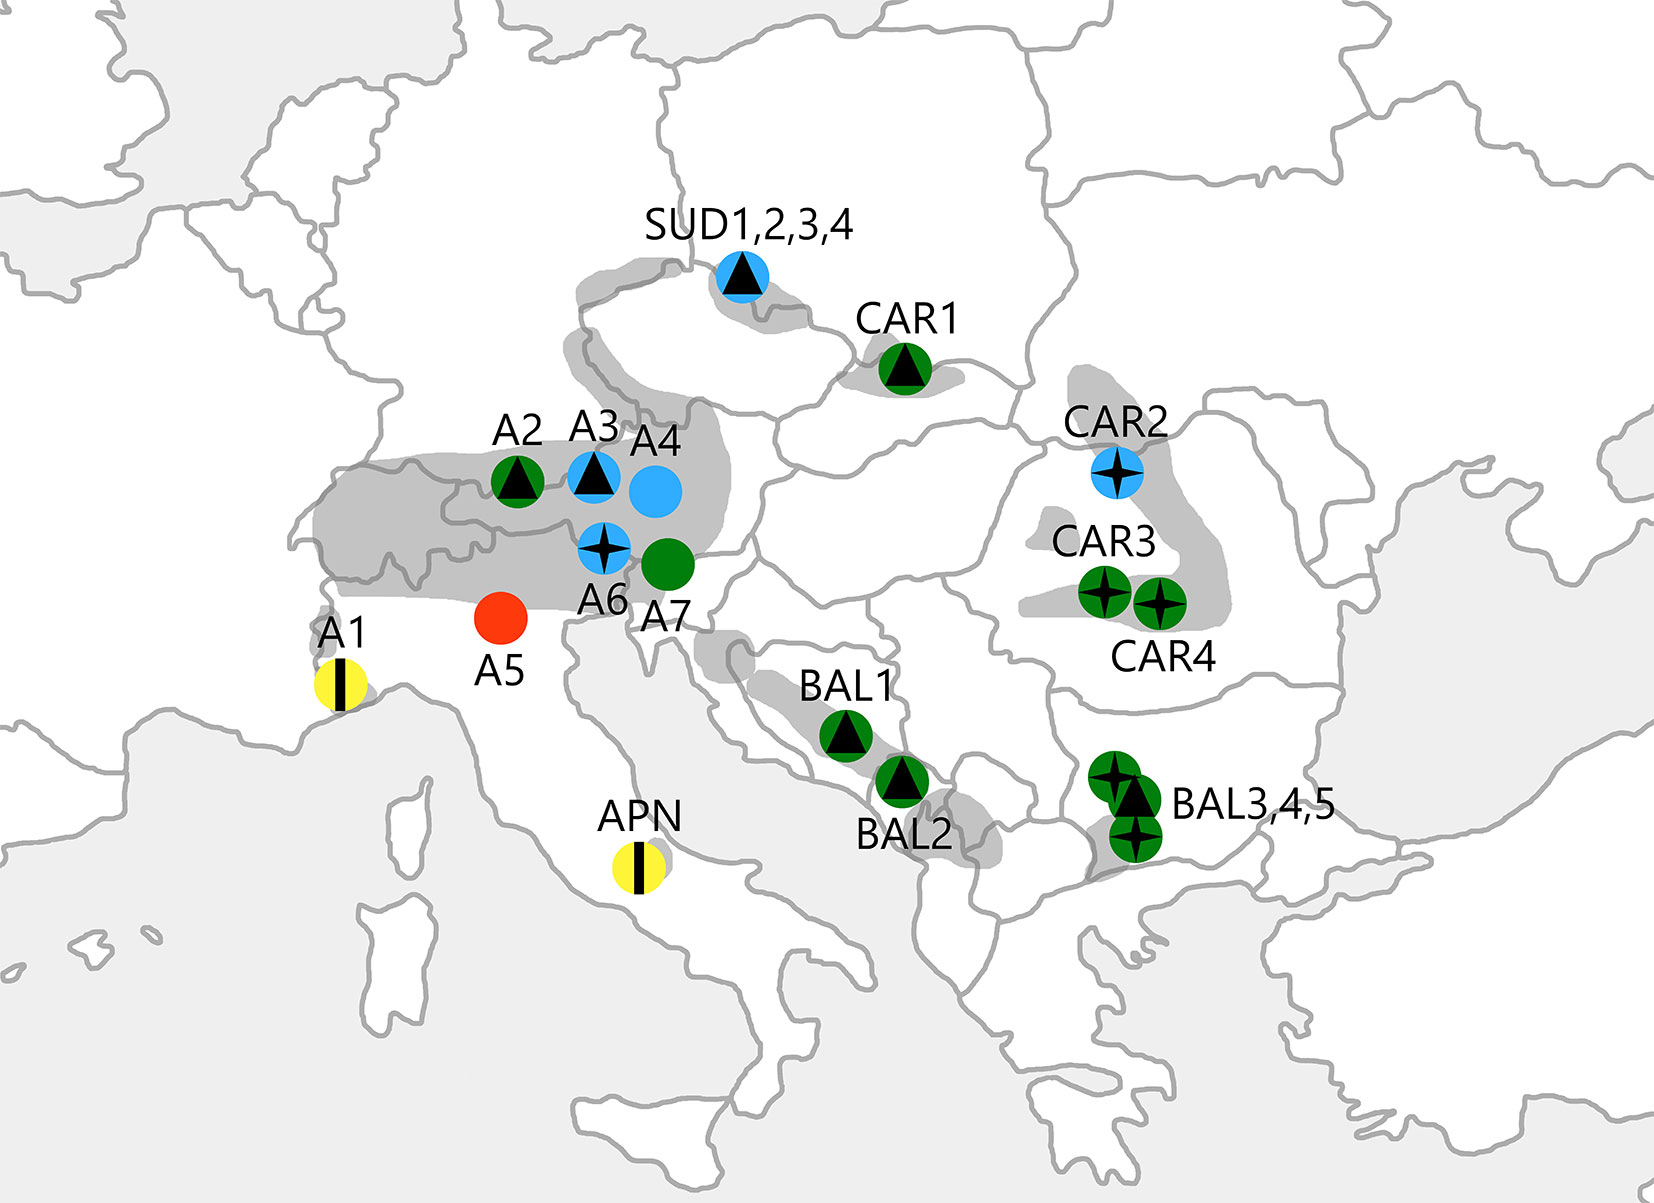
The genetic variation at chloroplast microsatellites was screened in 21 native populations of P. mugo (553 trees). These populations cover the natural distribution range of P. mugo and its putative refugia from the Carpathians, Alps and Balkans (Fig. 1, Tab. S1 in Supplementary material). For 18 stands (615 trees), the morphological data were extracted and reanalysed from Boratynska et al. ([8]). Morphological data were unavailable for 3 locations in the Alps (A4, Austria; A5, Italy; and A7, Slovenia). Both the genetic and morphological variation were studied using the same individuals, but needle traits were measured in a higher number of trees. The number of analysed specimens in particular populations for both genetic and morphological surveys is given in Tab. S1.
Fig. 1 - Geographic location of the populations of P. mugo analysed in this study. Colours represent 4 genetic clusters defined as a result of the spatial genetic mixture analysis conducted using BAPS software (G1: red; G2: yellow; G3: blue; G4: green). Symbols show 3 morphological clusters supported by statistical analyses of needle traits (M1: vertical line; M2: four-pointed star; M3: triangle). The range of the species is shaded in grey.
Two-year-old dwarf shoots (brachyblasts) were collected from each individual in September 1999-2005 depending on the population (Tab. S1). The shoots were collected from adult trees in the field from the sunny side of a crown. The sampled individuals were separated by at least 40 m to avoid sampling from the same genet. For genetic analyses, the needles were dried at 37 °C, and 50-100 mg of tissue was used for DNA extraction. For the morphological survey, ten needles were used for each individual (6150 needles in total). The needle length was measured in the field using fresh material. All of the other needle characteristics were assessed after the samples were preserved in 70% ethanol. A detailed description of the sampling and measurement procedures can be found in Boratynska & Bobowicz ([5]) and Boratynska & Boratynski ([6]).
Microsatellite analyses
Dry needle samples were ground in an MM 400 Mixer Mill (Retsch, Germany), and genomic DNA was extracted following the protocol described by Dumolin et al. ([13]) with a final incubation with RNase A at 60 °C for 30 min. The DNA concentration was measured using a BioPhotometer (Eppendorf AG, Germany). We studied 11 paternally inherited cpSSR loci out of 14 initially tested: Pt15169, Pt26081, Pt30204, Pt71936 ([48]); PCP1289, PCP26106, PCP30277, PCP36567, PCP41131, PCP45071 and PCP87314 ([39]). PCR amplification was performed in a total volume of 10 μl in two multiplex reactions (Tab. S2 in Supplementary material) using the Qiagen Multiplex PCR® kit (Qiagen, Germany) and Applied Biosystems Veriti® and 2720® thermal cyclers (Life Technologies, USA). Each reaction contained approximately 30-45 ng of template DNA, 1x Qiagen Multiplex PCR Master Mix, 0.5x Q-Solution and 0.05-0.1 μM (each) forward and reverse primers. The forward primer in each pair was labelled with a specific fluorescent dye. The standard amplification procedure started with an initial denaturation at 95 °C for 15 min, followed by 31 cycles with 30 sec denaturation at 94 °C, 45 sec annealing, and 1:30 min extension at 72 °C, with a final extension at 72 °C for 10 min. The PCR products were run on an Applied Biosystems 3130 Genetic Analyzer® (Life Technologies, USA) with the GeneScan 500 LIZ® Size Standard (Life Technologies, USA), and the raw data were scored with GeneMapper® software ver. 4.0 (Life Technologies, USA). The raw data were converted into discrete allele sizes using the least-square minimisation algorithm implemented in AlleloBin software ([26]).
To assess the overall patterns of genetic variation, we calculated the total number of alleles (AN), effective number of alleles (AE), frequency of the most frequent allele (FMFA), diversity (Ah) and unbiased diversity (Auh) at each microsatellite locus using the software GenAlEx ver. 6.5 ([37]). Because the chloroplast genome does not recombine or have a heterozygous nature, all of the alleles found in a single individual were combined to form haplotypes. We then analysed the genetic diversity of each population with the following parameters using the software Haplotype Analysis ver. 1.05 ([15]): the total number of haplotypes (HN), frequency of the most frequent haplotype (FMFH), number of private haplotypes (HP), effective number of haplotypes (HE), haplotypic richness (HR), Nei’s index of genetic diversity estimated without bias (He - [35]) and mean genetic distance among individuals (D2sh - [20]).
We assessed the interpopulation differentiation by the hierarchical analysis of molecular variance (AMOVA) using both FST and RST computed for all pairs of populations in GenAlEx ver. 6.5 (1000 permutations). The FST SSR distance type is based solely on the number of different alleles, whereas RST is based on allele size, which means that it takes into account not only the identity of the alleles but also the magnitude of the difference among their sizes ([22]). The analyses were performed among all populations and within and among groups of populations grouped according to their location into different mountain regions as well as among genetic clusters as defined by BAPS software (see below). The matrices of pairwise differentiation among BAPS clusters were also calculated using SPAGeDi software ver. 1.5 ([23]), as we suspected that some of them may have been only slightly differentiated.
The possible existence of a phylogeographic structure of the P. mugo populations was tested by comparing RST and permuted RST (pRST) with 10.000 permutations using SPAGeDi ver. 1.5. If RST is significantly higher than pRST, then allele size contributes to genetic differentiation and can indicate phylogeographic structure ([22]). Furthermore, we conducted the Mantel test implemented in GenAlEx ver. 6.5 to determine whether population differentiation was caused by isolation by distance (IBD - 1000 permutations). For this purpose, we tested the pairwise population geographic distance against the pairwise population linearised FST [FST/(1- FST)] and RST [RST/(1- RST)] values computed in SPAGeDi ver. 1.5.
The populations were grouped via Principal Coordinates Analysis (PCoA) of the pairwise population FST and RST distance matrix in GenAlEx ver. 6.5. Additionally, we used a Bayesian clustering approach conducted using BAPS ver. 6.0 ([11]). We performed both a non-spatial and a spatial genetic mixture analysis to identify separate genetic clusters across populations and to locate their spatial boundaries. To this end, we initially tested all possible numbers of groups (K = 1-21) with 10 independent runs and repeated the analysis with 50 replicates for K = 3-6.
Morphological analysis
The morphological variation of P. mugo was studied using 22 needle characteristics. The data included measurements of the needles themselves, epidermal cells, resin canals and stomata. We also used information about the types of sclerenchyma cells between vascular bundles and around resin canals. A full list of the analysed characteristics is presented in Tab. S5 (Supplementary material).
Data from needle measurements were assessed for symmetry, unimodality and homoscedasticity and standardised prior to subsequent analyses as described by Boratynska et al. ([8]). We used STATISTICA® software ver. 9.0 (StatSoft, Tulsa, OK, USA) to calculate the arithmetic means, standard deviations and coefficients of variation for each needle characteristic. Geographic, Euclidean and Mahalanobis distances among the studied populations were computed for use in the Mantel test in GenAlEx ver. 6.5 (1000 permutations).
To arrange the populations into groups, we constructed a dendrogram of the closest Euclidean and Mahalanobis distances separating the P. mugo stands according to Ward’s method, supplemented by K-means clustering. These methods assign populations to clusters that optimally show differentiation between populations. Additionally, relationships among particular locations were illustrated on the biplots of a discrimination analysis. Finally, the needle characteristics showing the greatest discriminatory power were identified.
Relationship between genetic and morphological variation
To test whether there were any relationships between the genetic and morphological data, we carried out the Pearson’s correlation analysis implemented in the software PAST ver. 3.10 ([21]). To this end, we tested haplotypic diversity measures vs. mean values calculated for needle traits. We also searched for any associations between the genetic or morphological data and the geographic location of the analysed P. mugo populations (latitude, longitude and altitude). Because morphological differences may stem from adaptation to climate conditions that differ for particular populations, the mean values calculated for needle traits were also correlated with the climate conditions listed in Tab. S6 (Supplementary material). The False Discovery Rate (FDR) was calculated to control for false positives.
Results
Size variants and haplotype diversity
The final dataset consisted of 11 marker loci out of 14 initially tested. Locus Pt45002 was excluded from further analyses, as it was poorly amplified; Pt36480 gave a complex pattern that could not have been properly analysed; and PCP102652 was monomorphic (allele 114 bp). The number of size variants scored for each locus (AN) ranged from 3 for PCP1289 and PCP36567 to 14 for PCP41131 (mean AN = 6.63). The effective number of alleles (AE) ranged from 1.19 for PCP1289 to 3.37 for Pt30204 (mean AE = 2.49). Furthermore, the region PCP1289 was also the least diverse, with only 3 alleles and a 91% frequency of the most frequent variant (Tab. S3 in Supplementary material). Overall, we scored 73 alleles, among which 14 were private for particular populations. Private alleles were found most commonly in PCP41131 (7 alleles), the only cpSSR locus that also displayed a complex mutation model, having size differences of not only 1 but also 2 or 3 bp.
The combination of alleles yielded 311 haplotypes for 553 analysed individuals from 21 populations. Among them, 201 (65%) were population-private and 272 (87%) were private for the defined mountain regions. The average number of haplotypes (HN) found in each population was 19.23. Each of the two most abundant haplotypes was found in 12 individuals. These two most common variants were identified in the northern part of the P. mugo range, namely in the Sudetes (Poland - SUD1-4), in two Alpine stands (Maritime Alps, Italy - A1 and Berchtesgaden Alps, Austria - A3) and in one population from the Eastern Carpathians (Rodna Mountains, Romania - CAR2). The number of private haplotypes was high in the Carpathians and Apennines and in the Balkan region but generally low in the Alps and the lowest in the Sudetes (Tab. 1). Indeed, populations from the Sudetes had the highest number of shared haplotypes among all of the studied populations and mountain regions (Tab. S4 in Supplementary material).
Tab. 1 - Haplotypic diversity within P.mugo populations. (N): number of individuals; (HN): number of haplotypes; (FMFH): frequency of the most frequent haplotype in a particular population; (HP): number of private haplotypes; (HE): effective number of haplotypes; (HR): haplotypic richness; (He): Nei’s index of diversity estimated without bias ([35]); (D2sh): mean genetic distance among individuals ([20]).
| Population | N | HN | FMFH | HP | HE | HR | He | D2sh |
|---|---|---|---|---|---|---|---|---|
| SUD1 | 30 | 20 | 0.17 | 7 | 14.06 | 16.05 | 0.96 | 11.70 |
| SUD2 | 30 | 22 | 0.13 | 7 | 16.66 | 17.49 | 0.97 | 8.27 |
| SUD3 | 29 | 23 | 0.10 | 11 | 19.55 | 18.79 | 0.98 | 9.94 |
| SUD4 | 30 | 19 | 0.13 | 7 | 14.51 | 15.45 | 0.96 | 12.96 |
| A1 | 25 | 17 | 0.24 | 11 | 10.24 | 15.48 | 0.94 | 8.33 |
| A2 | 30 | 26 | 0.07 | 16 | 23.68 | 20.46 | 0.99 | 8.10 |
| A3 | 25 | 17 | 0.12 | 11 | 13.29 | 15.52 | 0.96 | 8.09 |
| A4 | 25 | 14 | 0.24 | 8 | 8.80 | 12.64 | 0.92 | 8.75 |
| A5 | 25 | 11 | 0.24 | 8 | 7.35 | 9.76 | 0.90 | 4.86 |
| A6 | 25 | 20 | 0.12 | 10 | 16.02 | 18.32 | 0.97 | 10.72 |
| A7 | 26 | 20 | 0.23 | 12 | 11.65 | 17.61 | 0.95 | 9.47 |
| CAR1 | 24 | 18 | 0.13 | 14 | 15.15 | 17.00 | 0.97 | 10.84 |
| CAR2 | 25 | 17 | 0.16 | 13 | 13.29 | 15.56 | 0.96 | 8.57 |
| CAR3 | 25 | 18 | 0.12 | 13 | 15.24 | 16.52 | 0.97 | 12.09 |
| CAR4 | 25 | 23 | 0.08 | 17 | 21.55 | 21.16 | 0.99 | 8.88 |
| APN | 25 | 16 | 0.25 | 14 | 12.25 | 14.60 | 0.95 | 6.52 |
| BAL1 | 25 | 21 | 0.16 | 12 | 16.02 | 19.24 | 0.97 | 9.94 |
| BAL2 | 29 | 20 | 0.17 | 11 | 13.34 | 16.21 | 0.95 | 5.78 |
| BAL3 | 24 | 22 | 0.08 | 16 | 20.57 | 21.00 | 0.99 | 8.56 |
| BAL4 | 25 | 19 | 0.16 | 13 | 14.53 | 17.40 | 0.97 | 8.97 |
| BAL5 | 25 | 21 | 0.12 | 15 | 17.85 | 19.28 | 0.98 | 11.48 |
| Mean | 26.28 | 19.23 | 0.15 | 11.71 | 15.03 | 16.93 | 0.96 | 9.18 |
| SE | 0.49 | 0.73 | 0.01 | 0.67 | 0.89 | 0.60 | 0.00 | 0.44 |
There was substantial haplotypic diversity within each population (average He = 0.96), with a mean genetic distance among individuals (D2sh) of 9.18. The mean effective number of haplotypes (HE) reached 15.03, and the average haplotypic richness (HR) was 16.93. The peripheral population from Monte Baldo in the Italian Alps (A5 - Fig. 1, Tab. S1) had the lowest values for all of the measured genetic parameters: HN = 11 (8 private), He = 0.90, D2sh = 4.86, HE = 7.35 and HR = 9.76. In contrast, 3 populations displayed the highest haplotype diversity values, namely the populations from the Ammergau Alps in Germany (A2), the Southern Carpathians in Romania (CAR4) and the Vitosha Mountains in Bulgaria (BAL3 - Tab. 1 and Fig. S1 in Supplementary material).
Interpopulation differentiation and phylogeographic structure based on cpSSR data
Weak but significant differentiation among populations was revealed by the AMOVA. The results were very similar for FST and RST, with 6.4% and 6.7% pairwise population differentiation, respectively. The remaining 93.6% and 93.3% of the total molecular variance was due to differentiation within populations. When we grouped the P. mugo locations into mountain regions, the variance amounted to 3% among regions and to 4% among populations within the regions for both FST and RST. Thus, disjunctive mountain distribution explains the observed genetic structure only to small extent. A slightly higher value of molecular variance was found between genetic clusters defined using BAPS software for both FST and RST (5% among clusters and 3-4% among populations within the clusters - Tab. 2).
Tab. 2 - Analysis of molecular variance (AMOVA) based on FST and RST among the P. mugo populations (p < 0.001).
| Grouping Method |
Source of Variation | df | Variance component | Variance (%) | Φ statistics | |||
|---|---|---|---|---|---|---|---|---|
| FST | RST | FST | RST | FST | RST | |||
| Mountain Regions |
Among populations | 20 | 0.214 | 0.678 | 6 | 7 | 0.064 | 0.067 |
| Within populations | 532 | 3.108 | 9.404 | 94 | 93 | - | - | |
| Among regions | 8 | 0.090 | 0.268 | 3 | 3 | 0.027 | 0.026 | |
| Among populations within regions | 12 | 0.136 | 0.444 | 4 | 4 | 0.042 | 0.045 | |
| Within populations | 532 | 3.108 | 9.404 | 93 | 93 | - | - | |
| BAPS | Among clusters | 3 | 0.163 | 0.492 | 5 | 5 | 0.048 | 0.048 |
| Among populations within clusters | 17 | 0.109 | 0.360 | 3 | 4 | 0.034 | 0.037 | |
| Within populations | 532 | 3.107 | 9.404 | 92 | 91 | - | - | |
Comparisons between the values of RST and pRST did not support the existence of phylogeographic structure among the P. mugo stands, as the difference was not significant (RST = 0.0672 > pRST = 0.0657; p = 0.438). On the other hand, the Mantel test showed a relevant correlation between pairwise geographic distances separating the P. mugo populations and linearised FST (r = 0.325; p < 0.001), indicating the possibility of IBD. However, the correlation was weak and not significant for linearised RST (r = 0.133; p = 0.080).
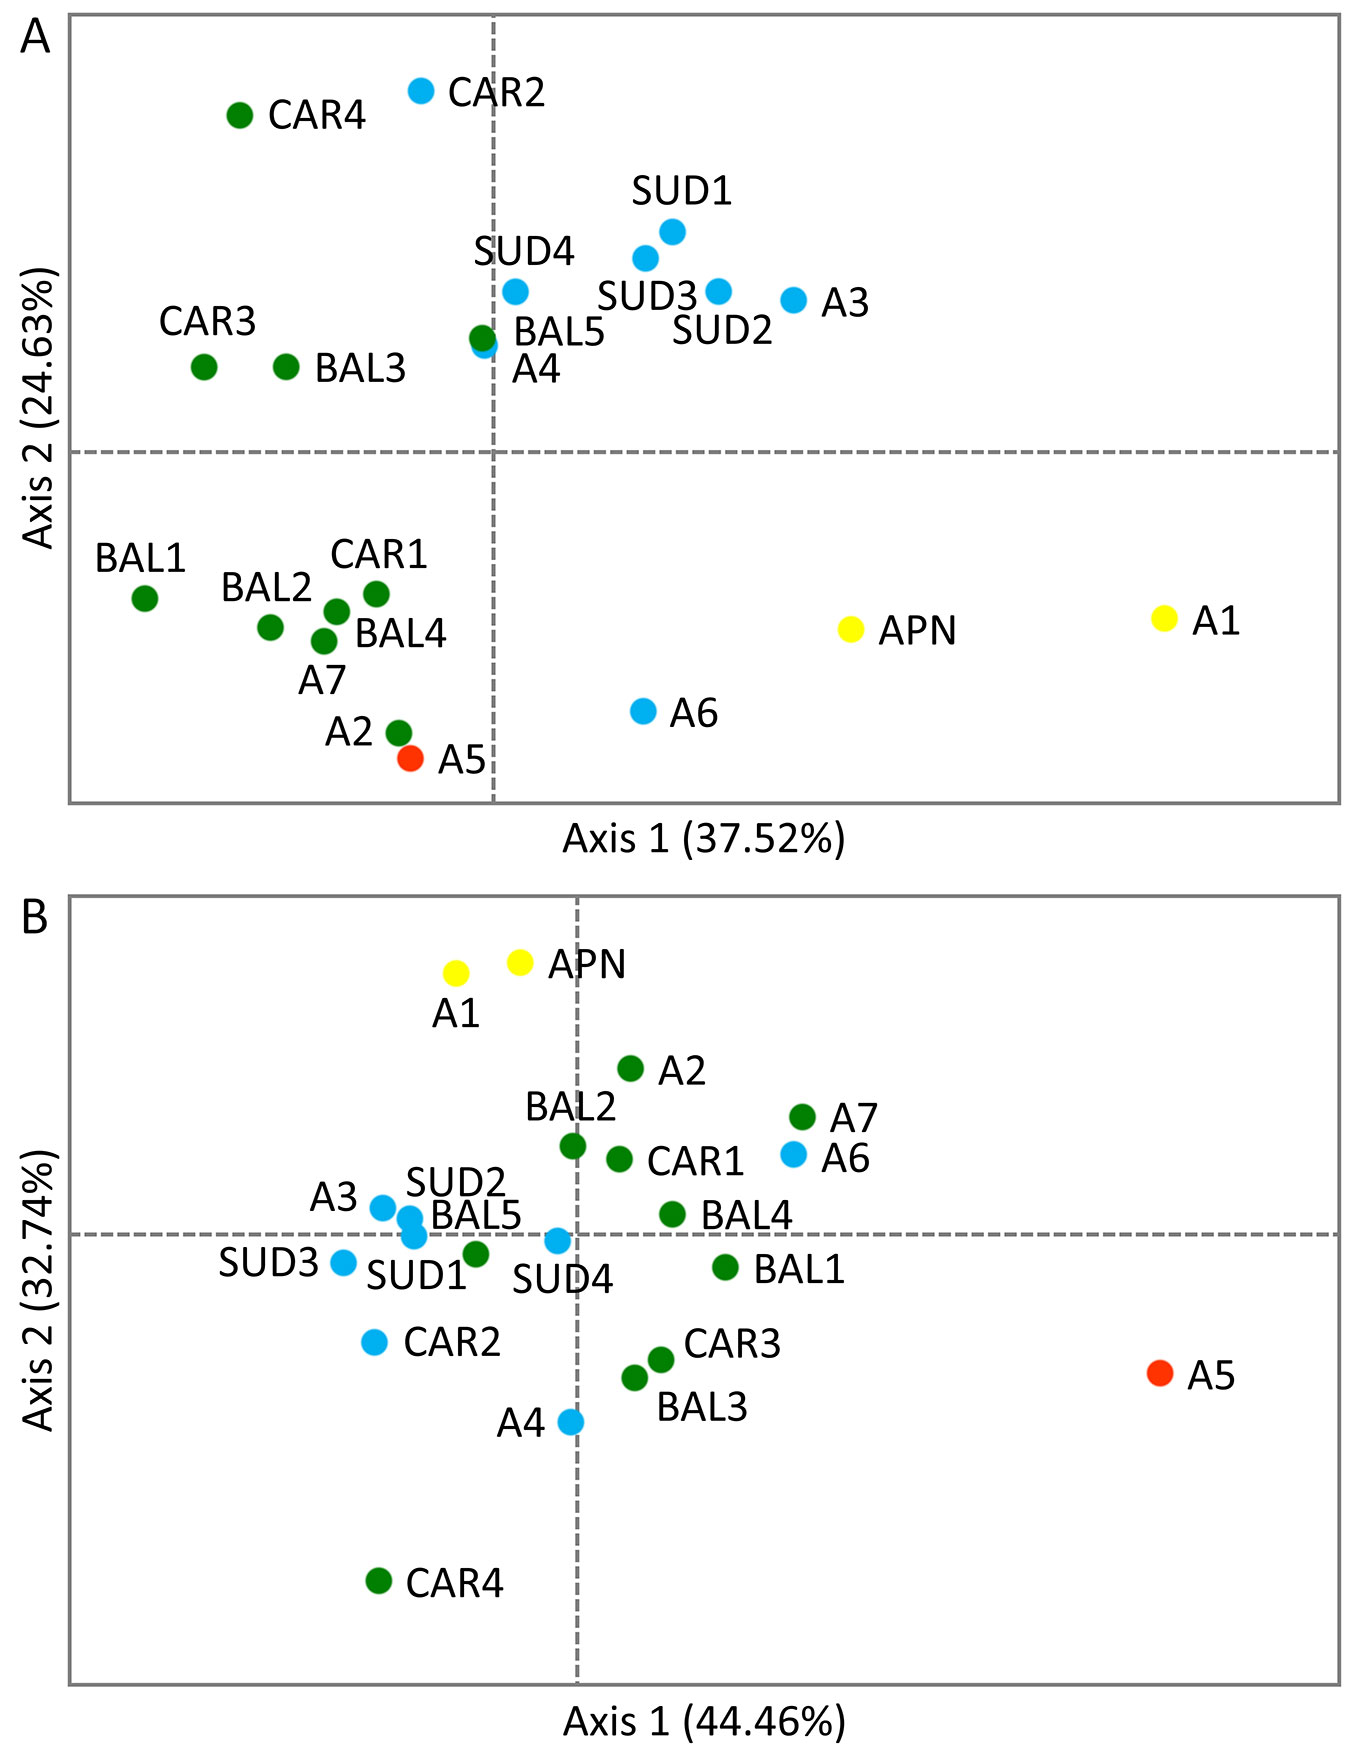
Regarding the PCoA results, the first two axes explained jointly 62.15% and 77.20% of the total variation for pairwise population FST and RST, respectively. In the case of RST, the population from Monte Baldo in the Italian Alps (A5), which was the least diverse of all populations, as mentioned earlier (Tab. 1), was clearly separated from the rest of the P. mugo stands. Weaker differentiation was detected for the peripheral population from the Maritime Alps in Italy (A1) and the isolated stand from the Apennines (APN), which clustered together on one side of the second axis. One population from the Southern Carpathians in Romania (CAR4) was also separated from the rest, especially from the stand located in Monte Baldo in the Italian Alps (A5) and A1 with APN. The PCoA performed using pairwise population FST yielded a slightly different result - the A5 stand clustered together with the population from the Ammergau Alps in Germany (A2) and close to one population from the Kamnik-Savinja Alps in Slovenia, one population from the Tatra Mountains in Poland and two stands from the Balkans (A7, CAR1, BAL2 and BAL4, respectively). With some exceptions, the overall pattern of differentiation was closer to the geographic location of the populations, with the A1 and APN stands separated from the rest along the first axis (Fig. 2).
Fig. 2 - Principal Coordinates Analysis (PCoA) of the P. mugo populations showing the first two axes: (A) based on pairwise population FST; (B) based on pairwise population RST. Colours correspond to genetic clusters defined using BAPS software shown in Fig. 1.
The spatial and non-spatial genetic mixture analysis gave highly similar results. The best partition yielded 4 groups that mostly corresponded to their geographic location. The only difference between the spatial and non-spatial algorithm was the membership of the BAL5 population, which was assigned to the G4 and G3 cluster, respectively. In accordance with the PCoA results performed on the RST distance, the population from Monte Baldo in the Italian Alps (A5 - cluster G1) was separated from the other stands. Populations from the Maritime Alps in Italy (A1) and the Apennines (APN) formed the second cluster (G2). All of the stands from the Sudetes (SUD1-4), one Carpathian (CAR2) and three Alpine populations (A3, A4 and A6) grouped together (G3). Populations from the Balkan region formed the fourth largest cluster (G4), along with most stands located in the Carpathians (CAR1, CAR3 and CAR4) and two populations from the Alps (A2 and A7 - Fig. 1). The highest between-group differentiation (with RST values greatly exceeding FST ones) was generally observed for pairs with G1. The differentiation among G2, G3 and G4 was markedly lower, and the RST values were similar to the FST results (Tab. 3).
Tab. 3 - Pairwise FST (lower diagonal) and RST (upper diagonal) values between population groups identified by BAPS software (p < 0.001).
| Groups | G1 | G2 | G3 | G4 |
|---|---|---|---|---|
| G1 | - | 0.411 | 0.213 | 0.144 |
| G2 | 0.162 | - | 0.054 | 0.075 |
| G3 | 0.098 | 0.060 | - | 0.026 |
| G4 | 0.083 | 0.116 | 0.036 | - |
Variation in needle characteristics
Morphological variation in the studied P. mugo populations depended on the trait. The most stable traits were the ratio between the thickness and width of the needle, and the number of stomata on a 2-mm-long section of the needle on both the convex and flat sides (NT/NW, NSC and NSF, respectively). On the other hand, the types of sclerenchyma cells between vascular bundles and around resin canals were highly variable (Tab. S5 in Supplementary material). A moderate correlation was found between geographic vs. Euclidean (r = 0.417, p < 0.001) and Mahalanobis (r = 0.448, p < 0.001) distances.
Clustering of populations based on morphological data
The morphological analysis supported 3 clusters that generally did not correspond to the groups defined by the spatial genetic mixture analysis conducted using BAPS software. Despite this finding, populations A1 and APN formed a uniform group (cluster M1) separated from the others, as we described above for the cpSSRs. The second group (M2) included the easternmost stands of P. mugo (CAR2, CAR3, CAR4, BAL3 and BAL5) and one population from the Alps (A6). The remaining populations were assigned to the third cluster (M3), in which the Sudetes formed a condensed group (Fig. 1).
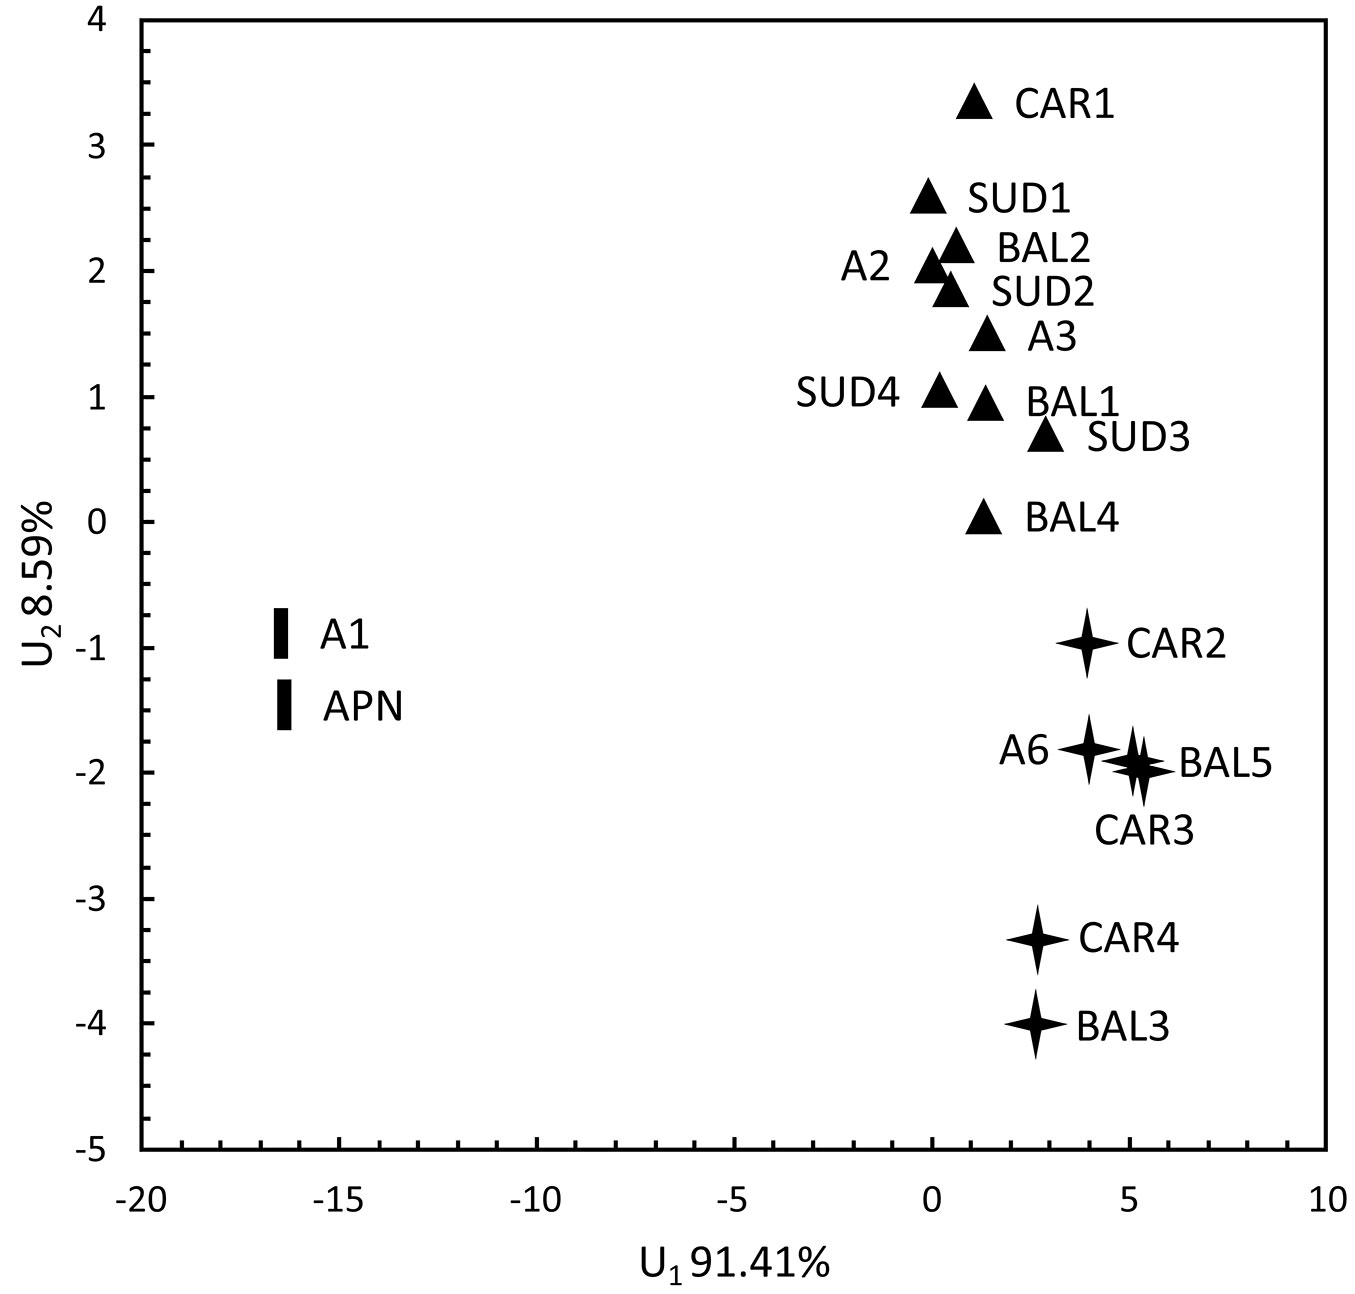
In the discrimination analysis between the two first discriminatory variables, the M1 cluster (A1, APN) was obviously separated from the rest along the first discriminatory variable that covered approximately 91.41% of the total variation. This variable was determined by the number of resin canals (NRC) and the types of sclerenchyma cells between the vascular bundles of the needles. The two remaining morphological clusters (M2, including A6, CAR2, CAR3, CAR4, BAL3 and BAL5; and M3, including SUD1, SUD2, SUD3, SUD4, A2, A3, CAR1, BAL1, BAL2 and BAL4) were not as differentiated. Still, they could have been defined along the second discriminatory variable that accounted for 8.59% of the total variation and included the types of sclerenchyma cells between vascular bundles and around the resin canals of the needles (Fig. 3).
Fig. 3 - Discrimination analysis of the P. mugo populations plotted along the two first discriminatory variables. Symbols correspond to the different morphological clusters shown in Fig. 1.
Correlations among needle traits, genetic data, geographical variables and climate conditions
We found that the mean values calculated for needle traits did not correlate with the haplotypic diversity measures. Nevertheless, there were a few significant correlations between the mean values calculated for needle traits and the geographic location of the populations. The number of resin canals (NRC), needle width (NW), needle thickness (NT) and thickness of epidermal cells (TE) showed a strong negative correlation with longitude (r ranging from -0.67 to -0.82; p < 0.05). Additionally, the width of epidermal cells (WE) correlated with altitude (r = -0.61; p < 0.05).
Regarding climate conditions, the needle length (NL) negatively correlated with the annual mean temperature, the maximum temperature of the warmest month and the mean temperature of the warmest quarter (r ranging from -0.59 to -0.63; p < 0.05). NRC showed a strong positive association with the precipitation of the driest month and the driest quarter (r = 0.65; p < 0.05). Finally, the ratio between the width and thickness of epidermal cells (WE/TE) negatively correlated with the minimum temperature of the coldest month and the mean temperature of the driest and coldest quarter (r = -0.66 to -0.68; p < 0.05).
Discussion
Genetic diversity and differentiation
We found that P. mugo shows a high level of haplotype variation assessed for cpSSRs that is similar or even higher than that found in other conifers ([42], [46]). In our study, genetic differentiation between P. mugo populations was also comparable to some previous findings in smaller areas of the species range (FST = 0.041, [44]; FST = 0.076, GST = 0.070, [24]; FST = 0.069 in the Carpathians and FST = 0.033 in the Alps, [43]; FST = 0.083, RST = 0.137, [14]; and GST = 0.020 for isoenzymes and GST = 0.017 for cpSSRs, [7]). Indeed, low genetic differentiation is expected for highly outcrossing species that usually show high genetic diversity at neutral markers.
Distinct vicariant gene pools for P. mugo might have originated from major mountain ranges, similar to other conifers ([48], [1]). Nonetheless, studying the differentiation of cpSSRs, which in pines are paternally inherited and transferred by pollen, is complicated by multiple private haplotypes due to the small number of individuals sampled. This fact makes it difficult to unambiguously partition genetic diversi-ty into within- and among-population differentiation. Tree species show substantial genetic diversity; therefore, a very large sample size would be required to overcome this problem. This may be why the genetic differentiation among mountain regions estimated in our dataset (FST = 0.027, RST = 0.026) was considerably lower than that reported by Dzialuk et al. ([14]) (FST = 0.119, RST = 0.196) and Boratynska et al. ([7]) (FST = 0.120). A markedly larger area and more mountain ranges with a slightly different set of cpDNA microsatellite markers were analysed in our study. As a result, we identified 311 distinct haplotypes compared to 168 reported by Dzialuk et al. ([14]) and 163 by Boratynska et al. ([7]). In addition, the strength of geographic barriers to gene flow may be different within various mountain ranges as well as among them. Finally, the transport of pollen between now-disjunctive stands of P. mugo may have occurred more frequently in the past during cooler periods when populations occupied areas at lower elevations. It is very likely that P. mugo covered a broader area during cold periods of the Pleistocene, as high quantities of Pinus pollen, described as “sylvestris” or “diploxylon” type, were usually interpreted as P. mugo, especially in mountain areas outside the geographic range of P. sylvestris during the Last Glacial Maximum (LGM) and the Holocene ([17], [29]). The high haplotypic diversity and low interpopulation divergence of P. mugo found in our study are consistent with the hypothesis assuming a relatively recent fragmentation of a historically larger population of this species ([42]). Despite the overall weak genetic divergence among mountain regions, there was at least one population in each range that displayed higher values of genetic diversity parameters than those of other populations in the same mountain chain (namely, SUD3, A2, A6, CAR4 and BAL3). Such source populations may represent themselves or be located close to glacial refugial populations. A similar low genetic differentiation among mountain populations was observed in a few studies for other conifers, e.g., Picea mexicana Martínez ([30]) or P. sylvestris ([42]).
Interestingly, our analysis yielded almost identical results of interpopulation differentiation regardless of the SSR distance type used (FST vs. RST). FST better reflects the effects of genetic drift and gene flow, whereas RST is more sensitive to the effect of mutations because it accounts for the evolutionary distance between alleles ([3]). We therefore conclude that the differentiation among the P. mugo populations in our study generally results from genetic drift. The not significant outcome of the permutation test indicates that the effects of mutations can be largely neglected because any new mutations are quickly spread by gene flow, whose rate is much higher than the mutation rate ([22]).
Grouping of populations
A comparison of genetic and morphological data showed that clusters defined for cpSSRs and morphological characteristics did not overlap for most of the species’ range. Morphological traits tended to have a west-east pattern, with the Eastern and Southern Carpathians forming a separate group along with two populations from Bulgaria (BAL3 and BAL5). Surprisingly, the population from the Carnic Alps in Italy (A6) was morphologically very similar to the group formed by the easternmost stands of P. mugo. Nevertheless, such similarities probably evolved separately and did not result from the same origin of these populations. On the other hand, clusters defined by the cpSSR analysis had a rather south-north pattern, with evident signs of genetic admixture between putative refugia located in the particular mountain chains.
Bayesian clustering revealed 4 and 3 groups for genetic and needle trait data, respectively. Only one population was assigned to the first genetic cluster (G1), namely A5, which is a peripheral stand located in Monte Baldo in the Italian Alps. The haplotypic diversity of A5 was the lowest of all populations, lower even compared to the most geographically isolated stand from the Apennines (APN). Such an apparent decline in the measured genetic parameters and a low number of haplotypes shared with other populations were the reasons why A5 was genetically very different from all the other P. mugo populations and therefore did not cluster with any other stand. It is possible that A5 experienced a genetic bottleneck that resulted in a reduction of its genetic diversity. We found only 11 haplotypes (mean HN = 19.23) in this location among 25 individuals. Additionally, the mean genetic distance among the samples from this population was the lowest of all populations tested (D2sh = 4.86 vs. mean D2sh = 9.18). It is not likely that 11 cpSSRs would combine into identical haplotypes present in individuals from the same population as a result of homoplasy. Nonetheless, the methods used to detect genetic bottlenecks are based on the fact that populations experiencing reductions in size tend to lose rare alleles. Consequently, their heterozygosity decreases but not as fast as allelic diversity. As a result, the observed heterozygosity is greater than expected from the observed number of alleles. Nuclear genome markers are therefore the most suitable for analysing fluctuations in population size.
Another southwestern-most population of P. mugo from the Maritime Alps in Italy (A1) and the isolated stand from the Apennines (APN) formed the second genetic cluster (G2), which was evidently different from the other populations. The genetic distinctiveness of A5, A1 and APN is most likely the result of their isolation, especially because A1 and APN were also assigned to one group based on morphological data, and because that group was separated from the other populations (A5 was not included in the morphological survey). This is not surprising considering the peripherality of these stands. In addition, the two groups (G1 vs. G2) were highly differentiated. As RST = 0.411 greatly exceeded FST = 0.162, mutations played an important role in this region, and the effect of gene flow was not as pronounced compared to the whole dataset. These results are generally consistent with the assumption that the rate of gene flow is lower at the range margins than at the range centre ([16]). We also hypothesise that the gene pool of A1 might have been affected by gene flow from Pinus uncinata (Ramond) Domin that grows in the Western Alps and in the Pyrenees as shown by Heuertz et al. ([24]). This possibility was discussed by Boratynska & Boratynski ([6]) and Boratynska et al. ([8]). Finally, APN may have originated from an Apennine glacial refugium with limited expansion into the Alps. Stronger spatial genetic structure and greater genetic differentiation are expected among populations inhabiting refugial areas compared to areas recolonised recently ([31]) unless the effect of genetic drift is strong and prolonged in refugial populations ([12]). In our study, a significant signal of IBD in the Mantel test observed for the whole dataset became not significant when populations A5, A1 and APN were excluded. This result supports the hypothesis that P. mugo in the Apennines and/or Western Alps has a different origin, whereas other populations have diverged relatively recently from a larger distribution of the species. Evidence of different origins of the Apennine vs. Alpine populations has been reported for other conifers, e.g., for P. sylvestris ([4]) and Abies alba Mill. ([38]).
The remaining populations from the Alps belonged to different genetic clusters (G3 and G4), contrary to what was described by Heuertz et al. ([24]). However, this is probably the effect of a much higher number of analysed cpSSRs (11 vs. 3) and different study design (large vs. small area of the P. mugo range). Indeed, when we analysed only a subset of the loci used in our study (5 out of 11 cpSSR loci, including Pt26081, PCP1289, PCP30277, PCP36567 and PCP87314), we found that only APN/A1 populations differed from the rest. Some genetic substructure within the populations of P. mugo from the Eastern Alps was also detected by Mosca et al. ([34]).
Our data indicate that the smallest genetic and morphological differences are among populations from the Sudetes. These populations are quite close to one another, yet they occupy different parts of the mountain landscape (the postglacial cirque, mountain peak, plateau and mountain side). All Sudeten locations belonged to a single genetic (G3) and morphological cluster (M3), suggesting a common population history. It seems that populations of P. mugo located in the Sudetes may be more recent than the Alpine and Carpathian populations. It is possible that they were established as an outcome of founder events at the end of the last glacial period ([7]). Considering their genetic similarity to some populations from the Alps, they may have been established by Alpine migrants. Low barriers to gene flow among these mountain ranges are also a possible explanation.
Most populations from the Carpathians, all Balkan populations and two Alpine populations were assigned to the last genetic cluster (G4), which was only slightly differentiated from G3 (FST = 0.036, RST = 0.026), which included all Sudeten and a few Alpine stands. Nevertheless, only the easternmost populations (M2) displayed differences in needle traits. This result suggests their different origin and longer separation during the Pleistocene ([8]), which were postulated previously ([9]), and/or that some needle traits have adaptive importance. Additionally, Wachowiak et al. ([51]) found a different mitotype in one Ukrainian population of P. mugo. Small differences among Bulgarian populations of P. mugo were detected by Slavov & Zhelev ([44]) using allozymes (FST = 0.041), comparable to the results of our study for cpSSRs (FST = 0.032). Despite these findings, the genetic variation of P. mugo in the Balkan region and Carpathians is largely unknown. However, considering the morphological dissimilarities found among populations from Bulgaria (BAL3, BAL4 and BAL5), it seems that this region may have been colonised by individuals from two different areas, namely, from the Alps and from the Southern Carpathians.
The distinct character of eastern stands of P. mugo with regard to needle trait variation can be explained by their origin from a different Pleistocene refugium, as hypothesized by Boratynska et al. ([9]). P. mugo could have survived the glacial period in the Eastern and Southern Carpathians. Unfortunately, it is difficult to unambiguously confirm this hypothesis. Palynological data are not suitable because, as mentioned earlier, the pollen of P. mugo greatly resembles that of P. sylvestris and P. nigra. However, the presence of P. mugo was reported in lake sediments in northern Romania and in the Pirin Mountains in Bulgaria during the end of last glacial period ([9]). Therefore, the hypothesis of a different origin of eastern P. mugo cannot be entirely excluded.
A specific phenotype is an effect of the interplay between a genotype and the environmental conditions. Environmental pressure may lead to a favourable phenotype via local adaptation, which is genetically determined, or phenotypic plasticity, which involves no changes in a genotype but rather in expression patterns. Phenotypic plasticity has been observed in the case of some needle characteristics of conifers, such as needle length ([33], [47]) and longevity ([41]), as well as stomatal density ([47]) and the number of stomatal rows ([33], [2]). However, some needle traits are highly heritable, indicating strong genetic control, e.g., thickness of epidermis ([18]), number of stomata per needle length on convex and flat sides and number of serrations ([33]). Therefore, the correlation of such traits with local environmental conditions is very likely to have a genetic basis.
Although we have limited information about the heritability of the needle morphological and anatomical traits analysed in our study, a comparison of the genetic and morphological variation of P. mugo indicates that some needle characteristics may be adaptively important. The easternmost populations of P. mugo can be distinguished from the others by the types of sclerenchyma cells between the vascular bundles and around the resin canals of needles. The variability of needle sclerenchyma cell types and their utility in distinguishing the taxa of two-needle pines in the subsection Sylvestres in Europe at the population level has already been ascertained by Boratynska & Boratynski ([6]). Nevertheless, it is unknown whether these traits have any adaptive importance. However, we found a strong negative correlation between longitude and the number of resin canals, needle width, needle thickness and thickness of epidermal cells (NRC, NW, NT and TE, respectively). Lower values of NRC and TE were also reported for P. mugo in Ukraine ([10]). Needles of P. mugo in the east are narrower and thinner and therefore have fewer resin canals and thinner epidermal cells. These characteristics appear to be plastic in pines, but TE was shown to have a hereditary nature ([18]). A thicker epidermis is considered to be adaptive in xeric conditions, as it limits transpiration ([28]). In our study, the ratio between the width and thickness of epidermal cells negatively correlated with the minimum temperature of the coldest month and the mean temperature of the coldest quarter. This means that the higher the temperature is, the narrower and thicker epidermal cells are. This result is consistent with the adaptive significance of a thicker epidermis under xeric conditions. In the case of needles that are narrower and thinner (as in eastern populations of P. mugo), their smaller area can also result in reduced water loss despite a thin epidermis. Furthermore, Fedorkov ([18]) showed that the thickness of the integumentary tissues of needles of P. sylvestris is inversely correlated with the level of atmospheric pollution. The evolutionary significance of NRC has not been widely studied, but the relationship between NRC and resistance to some insects has been shown ([36]). NRC may be important in wetter conditions, as according to our results it correlates with the precipitation of the driest month and the driest quarter. Nevertheless, whether these correlations stem from natural selection or are the effect of phenotypic plasticity remains unknown. A well-designed common garden study is required to verify this hypothesis. The only characteristic that is obviously plastic is the needle length (NL), which negatively correlates with temperature.
Conclusions
Our results indicate that patterns of chloroplast microsatellite and needle trait variation in P. mugo overlap only partially. In general, we found significant but low genetic differentiation between P. mugo populations across a large geographic area. However, we were still able to distinguish genetically differentiated groups of populations using cpSSRs. The results suggest that the divergence of P. mugo started relatively recently, following the reduction of a previously larger distribution that is compatible with signatures of nucleotide polymorphisms at nuclear gene loci ([49]). However, morphological variation did not correspond with the pattern of genetic differentiation. Therefore, differentiation at morphological traits may be a result of adaptive variation related to local environmental conditions. Nonetheless, more information about the hereditary nature and evolutionary significance of needle traits is needed to make unambiguous conclusions about their adaptive potential and to check whether they emerged as a result of genetic changes or phenotypic plasticity. Information about genetic variation at genes underlying adaptive traits complementing morphological and ecological data at distinct populations would help to solve this issue and to make future predictions regarding the adaptive potential and response of P. mugo, especially in the light of ongoing environmental changes.
Acknowledgements
We would like to thank Monika Litkowiec for technical assistance and Blazej Wojkiewicz for constructive comments on the previous version of the manuscript. The work was financially supported by the Polish National Science Centre (Grant No. DEC-2012/05/E/NZ9/03476).
References
CrossRef | Gscholar
Gscholar
Gscholar
Gscholar
Gscholar
Gscholar
CrossRef | Gscholar
Gscholar
Authors’ Info
Authors’ Affiliation
Krystyna Boratynska
Witold Wachowiak
Institute of Dendrology, Polish Academy of Sciences, Parkowa 5, 62-035 Kornik (Poland)
Institute of Environmental Biology, Faculty of Biology, Adam Mickiewicz University, Umultowska 89, 61-614 Poznan (Poland)
Corresponding author
Paper Info
Citation
Zukowska WB, Boratynska K, Wachowiak W (2017). Comparison of range-wide chloroplast microsatellite and needle trait variation patterns in Pinus mugo Turra (dwarf mountain pine). iForest 10: 250-258. - doi: 10.3832/ifor1860-009
Academic Editor
Andrea Piotti
Paper history
Received: Sep 05, 2015
Accepted: Sep 19, 2016
First online: Feb 11, 2017
Publication Date: Feb 28, 2017
Publication Time: 4.83 months
Copyright Information
© SISEF - The Italian Society of Silviculture and Forest Ecology 2017
Open Access
This article is distributed under the terms of the Creative Commons Attribution-Non Commercial 4.0 International (https://creativecommons.org/licenses/by-nc/4.0/), which permits unrestricted use, distribution, and reproduction in any medium, provided you give appropriate credit to the original author(s) and the source, provide a link to the Creative Commons license, and indicate if changes were made.

Web Metrics
Breakdown by View Type
Article Usage
Total Article Views: 40697
(from publication date up to now)
Breakdown by View Type
HTML Page Views: 34421
Abstract Page Views: 1841
PDF Downloads: 3406
Citation/Reference Downloads: 17
XML Downloads: 1012
Web Metrics
Days since publication: 2623
Overall contacts: 40697
Avg. contacts per week: 108.61
Article Citations
Article citations are based on data periodically collected from the Clarivate Web of Science web site
(last update: Feb 2023)
Total number of cites (since 2017): 5
Average cites per year: 0.71
Publication Metrics
by Dimensions ©
Articles citing this article
List of the papers citing this article based on CrossRef Cited-by.
Related Contents
iForest Similar Articles
Research Articles
Genetic variation of Fraxinus excelsior half-sib families in response to ash dieback disease following simulated spring frost and summer drought treatments
vol. 9, pp. 12-22 (online: 08 September 2015)
Research Articles
Genetic diversity of core vs. peripheral Norway spruce native populations at a local scale in Slovenia
vol. 11, pp. 104-110 (online: 31 January 2018)
Research Articles
Patterns of genetic variation in bud flushing of Abies alba populations
vol. 11, pp. 284-290 (online: 13 April 2018)
Review Papers
Genetic diversity and forest reproductive material - from seed source selection to planting
vol. 9, pp. 801-812 (online: 13 June 2016)
Research Articles
Genetic variation and heritability estimates of Ulmus minor and Ulmus pumila hybrids for budburst, growth and tolerance to Ophiostoma novo-ulmi
vol. 8, pp. 422-430 (online: 15 December 2014)
Research Articles
Comparison of genetic parameters between optimal and marginal populations of oriental sweet gum on adaptive traits
vol. 11, pp. 510-516 (online: 18 July 2018)
Review Papers
Indicators of drought effects in Pinus sylvestris: genetic analyses to corroborate the results of empirical methods
vol. 3, pp. 89-91 (online: 15 July 2010)
Research Articles
Age trends in genetic parameters for growth and quality traits in Abies alba
vol. 9, pp. 954-959 (online: 07 July 2016)
Research Articles
Local adaptation at a small geographic scale observed in Juniperus excelsa populations in southern Turkey
vol. 14, pp. 531-539 (online: 24 November 2021)
Commentaries & Perspectives
The genetic consequences of habitat fragmentation: the case of forests
vol. 2, pp. 75-76 (online: 10 June 2009)
iForest Database Search
Search By Author
Search By Keyword
Google Scholar Search
Citing Articles
Search By Author
Search By Keywords
PubMed Search
Search By Author
Search By Keyword


