Development of monitoring methods for Hemlock Woolly Adelgid induced tree mortality within a Southern Appalachian landscape with inhibited access
iForest - Biogeosciences and Forestry, Volume 9, Issue 2, Pages 178-186 (2016)
doi: https://doi.org/10.3832/ifor1712-008
Published: Jan 02, 2016 - Copyright © 2016 SISEF
Research Articles
Abstract
Hemlock woolly adelgid (Adelges tsugae Annand, HWA) is an introduced invasive forest pest in eastern North America. Herbivory by this insect results in mortality to eastern hemlock (Tsuga canadensis L. Carr.) and Carolina hemlock (Tsuga caroliniana Engelm.). These species occur in landscapes where extreme topographic variation is common. The vegetation communities within these landscapes feature high diversity of tree species, including several other conifer species. Traditional forest inventory procedures and insect pest detection methods within these limited-access landscapes are impractical. However, further information is needed to evaluate the impacts of HWA-induced hemlock mortality. Accordingly, our goal was to develop a semi-automatic method for mapping patches of coniferous tree species that include the living hemlock component and tree mortality by the HWA using aerial images and LiDAR (light detection and ranging) to increase our understanding of the severity and pattern of hemlock decline. The study was conducted in the Linville River Gorge in the Southern Appalachians of western North Carolina, USA. The mapping task included a two-phase approach: decision-tree and support vector machine classifications. We found that about 2% of the forest canopy surface was covered by dead trees and 43% by coniferous tree species. A large portion of the forest canopy surface (over 55%) was covered by deciduous tree species. The resulting maps provide a means for evaluating the impact of HWA herbivory, since this insect was the only significant coniferous mortality agent present within the study site.
Keywords
Decision-tree Classification, Eastern Hemlock, Hemlock Woolly Adelgid, Remote Sensing, Support Vector Machine
Introduction
Eastern hemlock (Tsuga canadensis L. Carr - Pinaceae) and Carolina hemlock (Tsuga caroliniana Engelm. - Pinaceae) are shade tolerant tree species that have a long life cycle ([50], [69]). These species are well adapted to a broad range of soils types and site conditions ([56]). Eastern hemlock has an extensive geographic range in eastern North America and is considered to be a foundation (keystone) species that provides a variety of intermediate and final ecosystem services, e.g., regulation of stream temperature, mitigation of soil erosion ([70]), and habitat and food resources for a suite of taxa, including birds, mammals ([25], [36], [56]), fish, invertebrates, amphibians, and reptiles ([36]). In contrast to eastern hemlock, Carolina hemlock has a more restricted geographic distribution in the Southern Appalachians and is often found on nutrient impoverished soils at higher elevations.
Hemlock woolly adelgid (Adelges tsugae Annand, HWA) is an invasive forest pest that feeds on hemlock parenchyma cells ([74]). The species was introduced from Japan and first detected in the eastern USA in the 1950s ([18]). Initially, the HWA was not considered to be a forest pest in its new environment ([69]). Subsequently, populations of this insect expanded and infested eastern and Carolina hemlock throughout a broad expanse of their ranges ([4]). Herbivory by the HWA results in progressive weakening and eventual mortality of trees ([62]). Hemlocks of all age and size classes are vulnerable ([49]) and infested trees routinely succumb to HWA herbivory, within a span of 5-15 years ([62]).
The effects of HWA herbivory at the landscape-scale ([9]) include widespread elimination of hemlocks. Both species composition and stand structure are fundamentally altered ([14]). One result is a landscape dominated by broad-leaved tree species ([61], [1]). In addition to the landscape-scale effects, responses include changes in transpiration ([10], [15]), carbon cycling ([49], [5]), and energy and nutrient fluxes ([62]).
Hemlocks commonly occur in topographically complex terrain, including steep slopes, deep gorges, ravines, and riparian borders ([47]). Hemlocks are not typically dispersed as large continuous canopies, but rather occur in small patches, often mixed with deciduous or other coniferous tree species ([56], [31]). Furthermore, Young & Morton ([75]) suggested that the patchy nature of eastern hemlock decline may also originate from the influence of landscape-level environmental factors. Landscape patterns and topography can directly influence pest populations and dispersal, or influence indirectly the health and distribution of the host trees ([75]). Traditional ground-based tree- and plot-wise inventory procedures and field surveys for insect-induced foliage alterations and their extent are inadequate. New methods are needed for revealing landscape-scale patterns of hemlock decline within areas that have difficult terrain and sparse road-networks. Remote-sensing methodologies provide an alternative means of assessment that can be both accurate and cost-effective. This approach to assessment provides land-cover maps at various and appropriate spatial and temporal scales ([13], [29]) and, aside from validation, reduces the need for costly and time-consuming ground survey ([43], [45]).
Aerial images are widely used in forest mapping and monitoring, since this medium is commonly available and relatively inexpensive ([26]). Color-infrared images (CIR) with a near-infrared (NIR) band are particularly well suited for tree species recognition, compared with true color images. The NIR band is especially useful for distinguishing conifers from hardwood species ([21]). Low-resolution remote sensing lacks power to reveal fine-scale community structures and dispersion patterns. Furthermore, remote-sensing applications using LiDAR (Light Detection and Ranging) provide another means for accurate mapping of forest vegetation in three dimensions. This approach has a variety of applications in vegetation mapping and monitoring in forestry, and other disciplines ([22]).
Aerially collected images have been widely utilized in forest health-monitoring applications. High-resolution imageries have been successfully applied in monitoring damage by pest insects, including mountain pine beetle (Dendroctonus ponderosae Hopkins - [6], [44], [73]), European spruce bark beetle (Ips typographus L. - [38]), common pine sawfly (Diprion pini L. - [26]), and Jack pine budworm (Choristoneura pinus pinus Free. - [39]). Accompanying advances in detection technologies has been the development of methods for pattern recognition of remotely sensed data ([40], [72]). These methodologies facilitate the use of large volumes of remotely sensed data with high spatial and spectral resolutions.
Despite the acknowledged ecological importance of hemlock species and concern over the decline of hemlock in Southern Appalachian forests, spatially explicit information on the landscape-scale pattern of hemlock mortality is limited. Hemlock is only of marginal economic value in commercial forestry ([4]). The lack of economic interest coupled with the difficulties in field inventory and monitoring tasks may have hindered quantitative evaluation of the ecological impact of hemlock removal in Southern Appalachian forested landscapes.
Methods for monitoring HWA herbivory on the landscape-scale are needed to estimate these impacts. These landscapes are often remote with limited access. Practical approaches include mapping procedures that can be conducted with no or little ground reference. Spatial resolution of the method should be high enough to enable investigation of landscape patterns and topographical relationships, as well as possible pathways for the HWA. The present investigation is a pilot study that aims towards a flexible monitoring system that could also be applied in inaccessible areas. Accordingly, the goal was to employ remote sensing technologies to assess HWA impact on hemlock mortality in Southern Appalachian forest landscapes. The specific objectives include employment of a semi-automatic method for mapping HWA-induced hemlock mortality as well as conifer patches with a living hemlock component within a Southern Appalachian landscape, using high-resolution aerial images and low pulse-density airborne-scanning LiDAR.
Material and methods
Study area
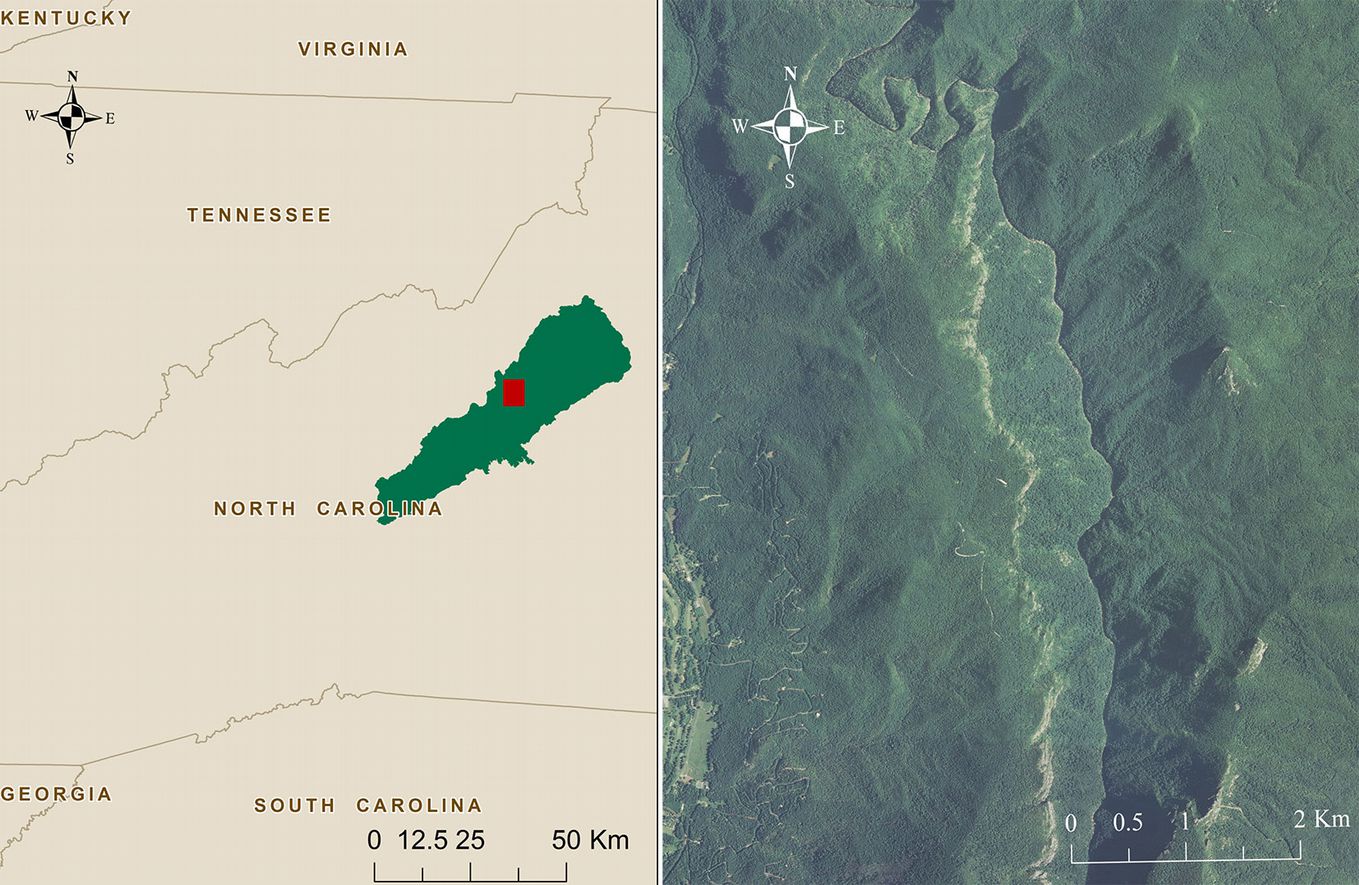
The approximately 48-km2 wide study area is located in the Grandfather Ranger District (35° 56′ N, 81° 55′ W), Pisgah National Forest, in the Southern Appalachians of western North Carolina (Fig. 1). The landscape vegetation consists primarily of mature, mixed-species forest stands that are characteristic of the ecoregion. The topography is very rugged, with elevations ranging from 1270 m a.s.l. on the ridgetops to 490 m (mean of 880 m) along the Linville River, which flows through the study site. The southwestern part of the area includes an urban component. Approximately half of the study site occurs within the Linville Gorge Wilderness, which has been only modestly logged; less than 5%, according to Newell & Peet ([48]). However, the area has been disturbed, e.g., by chronic acidic deposition and frequent forest fires ([48], [71], [12]). The most recent wildfire occurred in the southwestern part of the study area in October 2000 ([71], [12]). The three major ecological zones that occur within the study site include the Acidic Cove, Xeric Pine-Oak Heath and Oak Heath, and Mesic Oak-Hickory zones ([60], [1]). This structurally diverse landscape and humid climate provides a variety of habitats for more than 400 vascular plants and a rich diversity of tree species ([59], [53], [60]). A sparse road-network resulting from the complex terrain and preserved wilderness area further inhibits access and data collection in the area. Both eastern and Carolina hemlock are abundant within the area ([24]). The HWA was first detected in the area in the early 2000s ([32]) and was the most significant tree mortality agent during the time period of the study. Patches of dead hemlocks can be observed in the landscape. Hemlock decline is the most abundant on the riverside and along the drainages. We also found that the suppressed small hemlocks growing on the Linville River hillsides were infested and heavily defoliated in May 2014 (Kantola & Lyytikäinen-Saarenmaa, field observation, May 9-11, 2014).
Fig. 1 - The study area. Location of the Grand Father Ranger District (green) and the study area (red) in the western North Carolina (©ESRI - left) and an aerial image mosaic of the study area (right).
Remote sensing data sets
Aerial mages
CIR imagery with 1-m spatial resolution was acquired with a multiple Intergraph Digital Mapping Camera system (Intergraph Corp., Huntsville, AL, USA) at an altitude of approximately 9000 m in the summer of 2012 (leaf-on) by the National Agricultural Inventory Program (NAIP). The images were captured simultaneously from four 3072 × 2048 pixel multispectral cameras with 30 mm lenses producing red, green, blue, and NIR bands. The CIR imagery used in the analysis was resized to 3 m × 3 m pixel size to better correspond to the size of an individual tree crown.
Color aerial imagery (RGB) with 15-cm spatial resolution in the red, green, and blue bands was acquired by the Sanborn Map Company Inc. (Colorado Springs, CO, USA) with a large-format Zeiss (Carl Zeiss AG, Oberkochen, Germany) / Intergraph DMC in the winter 2010 (leaf-off). The flying altitude was approximately 1500 m above the mean terrain. The RGB imagery was used as a reference to enhance the accuracy of the training and testing data sets.
Airborne-scanning LiDAR
Airborne-scanning LiDAR was acquired during the North Carolina Floodplain Mapping Program phase II, in 2003. The LiDAR point cloud was acquired with a Leica GeoSystems Aeroscan system (Leica Geosystem AG, Heerbrugg, Switzerland). The flying altitude was 3000 m above the mean terrain at a speed of 150 knots, with a field of view of 55 degrees, and a laser pulse rate of 23100 Hz. The density of the pulses returned within the area was less than 1 per m2. A LiDAR point cloud of approximately 40 km2 was downloaded from the U.S. Geodetic Survey (USGS) Earth Explorer ([66]). The area covered by the LiDAR point cloud was used in the analysis. A canopy height model (CHM) was derived from the LiDAR point cloud and used in the first sub-task of the study.
Methods
General workflow
The first sub-task was to exclude non-forested land from the study site, including urban areas, water, and bare ground. We also excluded deep black shadows that lacked spectral information. These tasks were accomplished by creating a forest mask, using CHM and Normalized Difference Vegetation Index (NDVI) layers. The rationale for the forest mask creation was to avoid overestimation of dead tree coverage due to similar spectral reflectance associated with some non-forested patch types, such as bare ground and roads. Furthermore, reducing the number of cover classes usually improves the overall classification accuracy. The second sub-task included the classification of the remaining forest canopy cover. We assessed the accuracy by calculating the classification accuracies and Cohen’s kappa-values (κ - [7]) for both sub-tasks separately. The implementation was done by employing the FUSION® software (FUSION/LDV, USDA Forest Service, Seattle, WA, USA - [42]), Environment for Visualizing Images (Exelis Visual Information Solutions - ENVI®) software (EXELISVIS Inc., Boulder, CO, USA), and the ArcGIS® Geographic Information System environment (Environmental Systems Research Institute - ESRI, Redlands, CA, USA). The study workflow was divided into four main steps as follows:
- creation of training and testing data sets via visual interpretation (section “Training and testing data sets”);
- creation of LiDAR-derived CHM and NDVI layers (section “Forest mask creation”);
- forest mask creation with decision-tree classification and extraction of non-forested areas from the aerial imagery (section “Forest mask creation”); and
- conducting Support Vector Machine (SVM) classification for the forest cover classes (section “Forest cover classification”).
Training and testing data sets
We created testing and training data sets by visual interpretation of the aerial images. The original images (CIR and RGB) were used in the visual interpretation. The corresponding pixels from the resized image mosaic were chosen for the training and testing data sets. A 200 × 200-m systematic point network was created to test the accuracy of the forest mask created in sub-task 1. A total of 1080 pixels were assigned to the forest and non-forest classes, yielding 792 forest and 288 non-forest pixels. We created separate training and testing data sets for the second sub-task to classify and evaluate the forest cover classes (conifers, hardwood species, and dead trees). A sample of pixels was chosen that could be classified by an expert, without high uncertainty, into conifers, hardwood species, and dead trees. A total of 7925 pixels (5701 for training and 2224 for testing) were assigned to these data sets. A total of 81 041 m2 of the study area were used for training and testing (9720 m2 for the forest mask, 71 321 m2 for the forest cover classification - Tab. 1). The testing data set covered approximately 40% of the reference data set.
Tab. 1 - Areas and number of pixels in training and testing data sets for three different forest cover classes.
| Cover Class | m²/data set | Pixels/data set | ||
|---|---|---|---|---|
| Training | Testing | Training | Testing | |
| Conifer | 15498 | 9333 | 1722 | 1037 |
| Hardwood | 32592 | 10017 | 3621 | 1113 |
| Dead | 3216 | 666 | 357 | 74 |
| Total | 51305 | 20016 | 5701 | 2224 |
Forest mask creation
Separation of above-ground surface features offers useful data for a wide range of environmental applications. The digital surface model is a three-dimensional representation of the ground surface in non-vegetated terrain, as well as aboveground features, such as vegetation and buildings. In forestry applications, they are usually referred to as CHMs. The CHM was created from the LiDAR point cloud via the following steps. The elevation of the highest return within each grid cell was assigned as the local maximum to the grid cell center. The ground elevation was estimated, using a ground filter algorithm described in detail by Kraus & Pfeifer ([35]). Laser heights above ground (normalized heights, or canopy heights) were then calculated by subtracting the ground elevations from the corresponding local maxima. The CHM layer created with a spatial resolution of 3 × 3-m was smoothened with a 3 × 3 pixel median filter.
The NDVI is widely used in ecological applications ([54]). The principle behind it is that chlorophyll absorbs visible light in the read region of the electromagnetic spectrum, whereas radiation in the nonvisible NIR region of the spectrum is scattered by the leaf structure of a plant ([46]). As a result, vigorously growing healthy vegetation has low red-light reflectance and high NIR reflectance and, hence, high NDVI values.
Decision-tree classification is a non-parametric procedure and represents a practical method for land cover classification ([64]). A decision tree can be defined as a classification procedure that repetitively partitions a data set into smaller subdivisions ([16]). The partition is made, based on tests defined at each node of the decision tree. Decision-tree classification has advantages over traditional supervised classification methods, such as maximum likelihood or neural networks, which are widely used in remote sensing applications ([40], [64]). There are no required assumptions about the distributions and variations in data. The procedure accommodates missing values and the use of both numerical and categorical input values ([16], [40]). The method is flexible and can also process non-linear relationships ([40]).
We used the CHM and the NDVI layers in the decision tree classification for delineation of the forested areas. CHM heights greater than 1.2 m were considered vegetation, buildings, and other objects above the ground. A typical threshold height for vegetation returns in forestry application is 2 m ([26]). We kept the threshold value for the canopy height even lower, because the LiDAR point cloud was somewhat dated. With a 1.2-m threshold, grasslands and other short vegetation could still be excluded. This concession was reasonable, because we were simply separating terrain and vegetation and not estimating tree or stand characteristics. A low threshold value of 0.05 for the NDVI was chosen. We excluded deep shadows, water, and other non-vegetation elements having low NDVI values as well. The NDVI threshold chosen, however, did not exclude the dead trees. The resulting classification layer was filtered with a neighborhood majority filter to smooth the forest mask. The area within the forest mask was further used in the second sub-task.
Forest cover classification
The goal of the forest cover classification was to detect patches of dead hemlocks and distinguish living conifers from hardwood species. The procedure permits mapping of clusters of dead trees and potential areas of living hemlocks. The spectral reflectance of deciduous tree species is known to differ from that of conifers. The SVM classification methods presented by Boser et al. ([3]) and Vapnik ([67]), are not as well-known as many other procedures ([45]). However, their performance can exceed that of other classification methods ([17], [45]). SVM is a supervised non-parametric learning technique ([8]). SVM aims to determine the location of optimal decision boundaries separating different classes ([67]). The nearest data points to the resulting hyperplane that are used to measure the margin are called support vectors ([52]). SVM approaches using kernel functions can map non-linear data into a higher dimensional space. In that space, a linear separating surface between two classes is searched ([17]). SVM classifiers are suitable for remote sensing applications, especially with limited training data sets ([41], [45]). SVM classifiers are also seen as being robust to noise in data sets and to high-dimensional data. SVM minimizes classification errors without any prior assumptions about the probability distributions of a data set.
SVM classifiers have been successfully used in remote sensing applications, including vegetation classification ([17], [37]), forest classification ([23]), and tree species classification ([19]). The radial basis function (RBF) and polynomial kernels are the most commonly used in remote sensing-based SVM classifications ([29]). Kavzoglu & Colkesen ([29]) gained better overall classification accuracy with RBF in land cover classification. We used the spectral bands of red, green, NIR, and NDVI layers, and the RBF kernel in the SVM classification.
Results
Forest mask
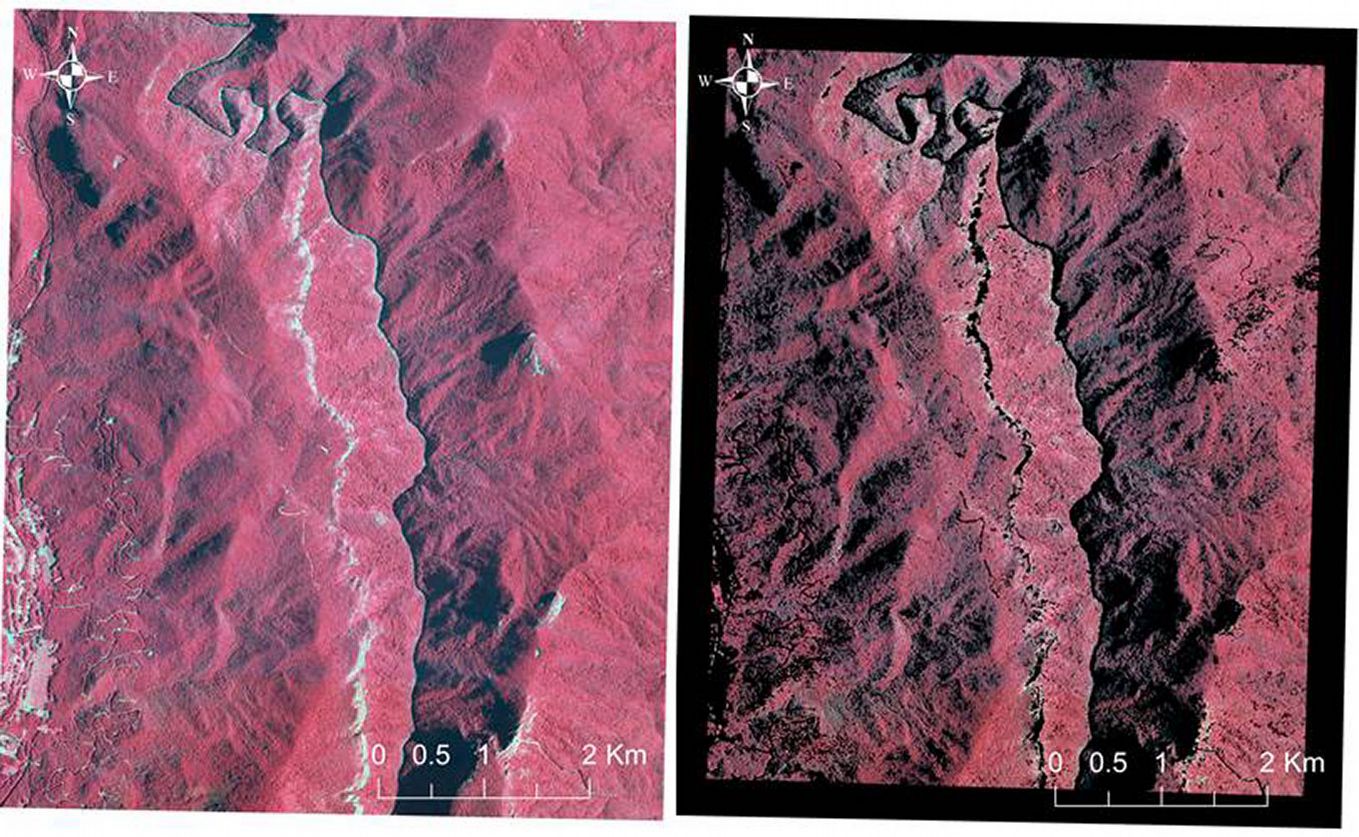
We extracted the non-forested areas from the CIR image for the second phase of the analysis (Fig. 2). The area of the LiDAR point cloud was smaller than the CIR mosaic causing the black frame. The overall classification accuracy was 93.5% (κ = 0.84).
Fig. 2 - The used high resolution image tiles. The original color-infrared (CIR) image mosaic of the study area (left), and the classified image for the second phase (right). On the classified image, only the forested areas are visible and the non-forested areas are extracted. Black color indicates the extracted areas.
Forest cover classification
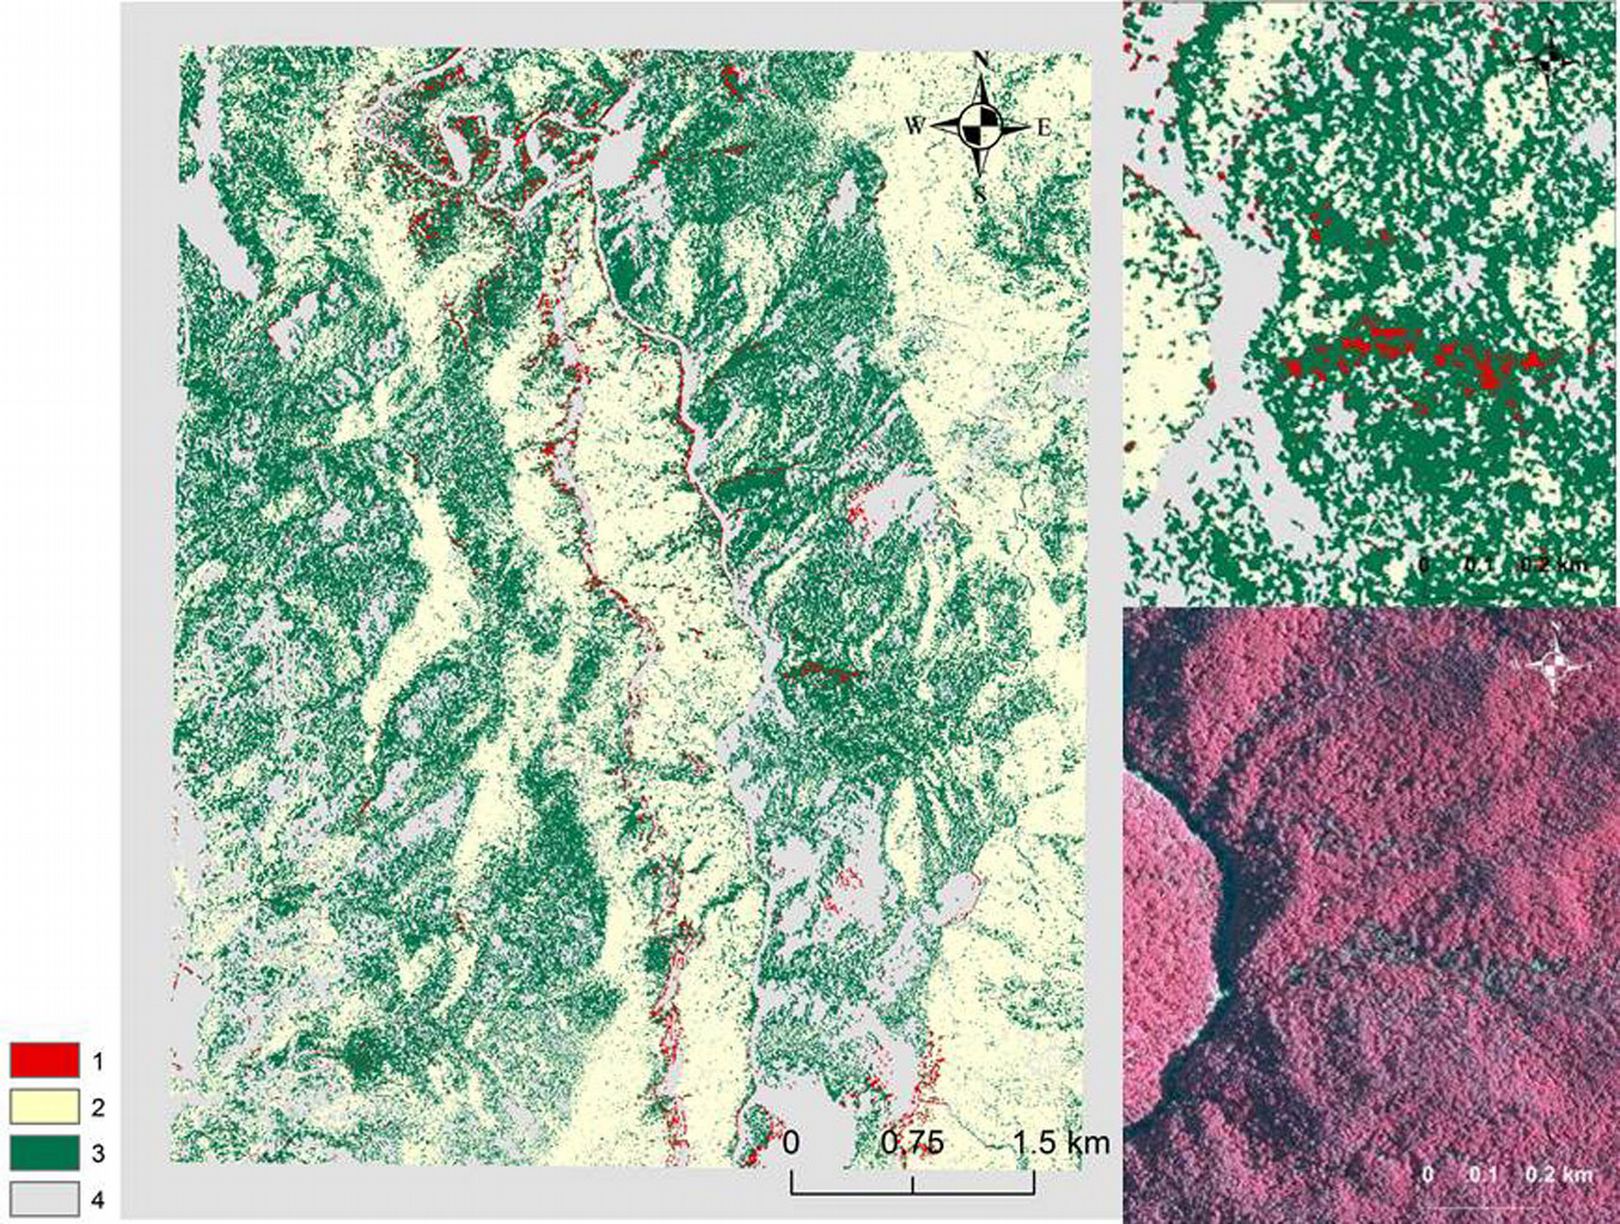
The forested area, a total of 30.2 km2, was classified into three forest cover classes: dead trees, conifers, and hardwood. The overall classification accuracy was 98.1% (κ = 0.96). Hardwood species covered over 55% of the classified area, while conifers and dead trees covered 44.7% of the classified area (42.6% and 2.1%, respectively) (Tab. 2). Over 0.6 km2 of the area was classified as dead trees and 12.9 km2 as conifers. The proportions found throughout the study area, including unclassified areas, were 1.63% dead trees, 42.5% hardwood species, 32.8% conifers, and 23.1% non-forested/non-classified (Fig. 3).
Tab. 2 - (A) Classification accuracies within the study area: an error confusion matrix of the SVM classification results. (B) The area covered by different forest cover classes and the proportions of the forested area.
| Cover class | (A) Testing data (Percent) | (B) Classification | ||||
|---|---|---|---|---|---|---|
| Dead | Conifer | Hardwood | Total | Km2 | Percent | |
| Dead | 98.65 | 1.93 | 0.00 | 4.20 | 0.64 | 2.12 |
| Conifer | 1.35 | 96.71 | 0.63 | 45.53 | 12.85 | 42.58 |
| Hardwood | 0.00 | 1.35 | 99.37 | 50.27 | 16.69 | 55.29 |
| Total | 100.00 | 100.00 | 100.00 | 100.00 | 30.18 | 100.00 |
Fig. 3 - The resulting classification image. The SVM classification image (left): 1=dead trees; 2=hardwood species; 3=conifers; and 4= unclassified. A magnified portion of the classification image (a black square) is illustrated on the left side of the figure. The classification image is on top and the CIR image below (right). Conifers show as darker purple color in the CIR image, hardwood species show as pink or red, and dead trees show as pale green.
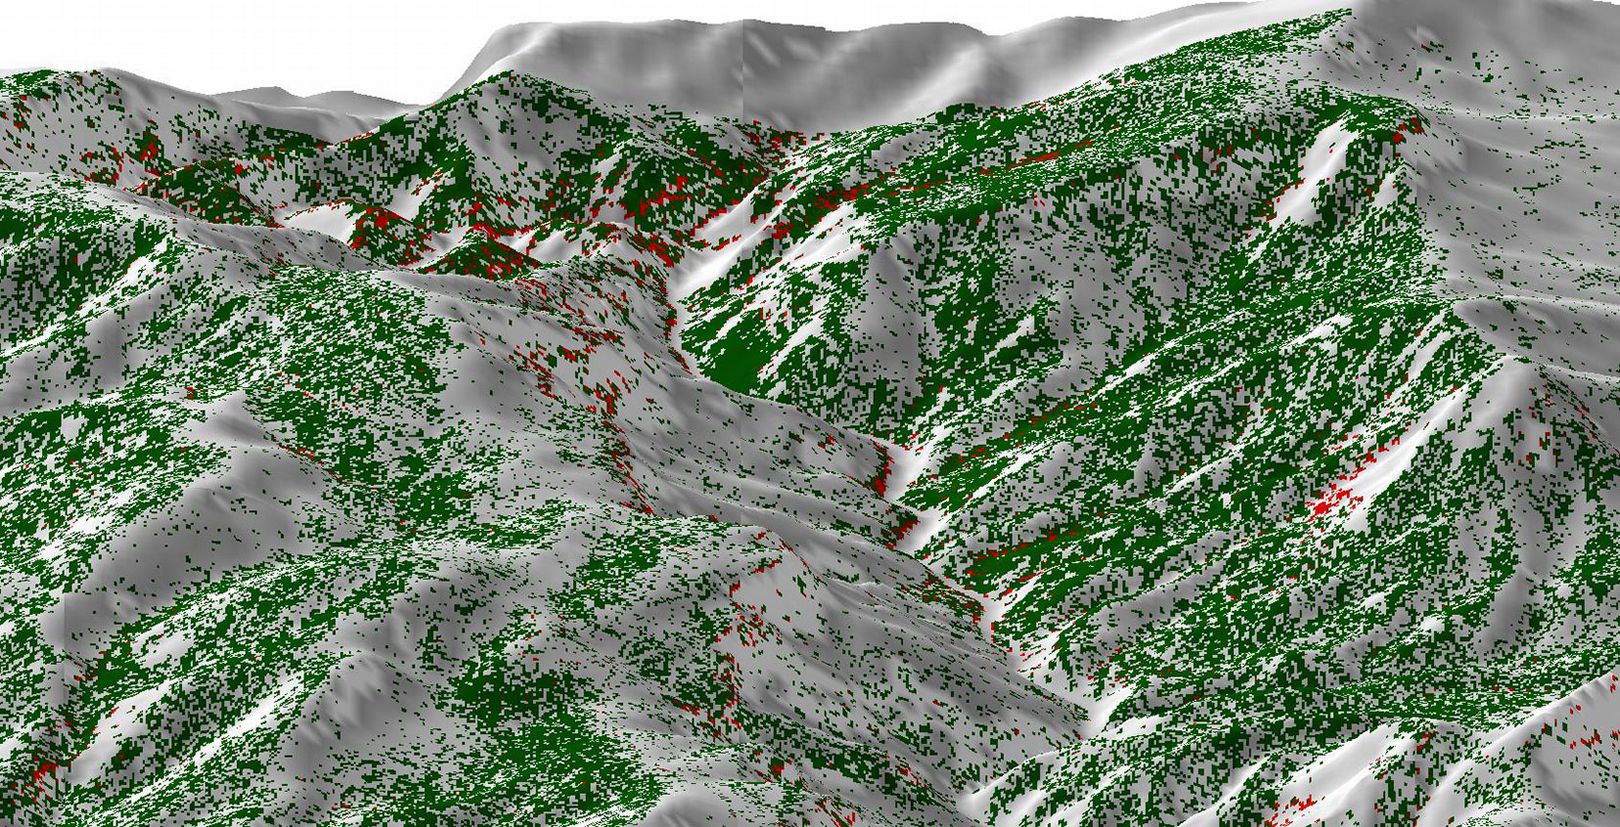
The classification image combined with the digital terrain model (DTM) revealed that conifers are most abundant in drainages and on northern and western slopes (Fig. 4). Clusters of dead trees could be found, especially near the Linville River, in drainages and at higher elevations.
Fig. 4 - The classification result combined with a digital terrain model at the Linville River Gorge. The classification image pronounces areas under interest, conifers and dead trees (green and red, respectively). Pixels classified as non-forest or hardwood species show as grey.
Discussion
Evaluating hemlock mortality
Previous studies directed at evaluating the impacts of hemlock decline have been based mainly on plot-wise field assessments and the use of lower-resolution remote sensing approaches. Plot-wise sampling schemes have been used for studying both small-scale within-stand effects of hemlock mortality ([50], [11], [34]) and broad-scale regional and state-wide impacts ([65]). Estimates for rates of hemlock mortality varied considerably. Results of plot- and stand-wise studies revealed hemlock mortality rates between 0% and 95%, depending on the infestation histories and latitudes ([50], [11], [34]).
Landsat Thematic Mapper (TM) has been the most commonly used remote sensing sensor in the mapping of hemlocks and HWA-induced hemlock mortality ([2], [58], [71], [33]). These studies provided good insights into HWA herbivory and hemlock decline at different spatial scales. On the other hand, wall-to-wall studies at landscape level with high spatial resolution are scarce. Kantola et al. ([28]) studied spatial pattern of hemlock decline in the Southern Appalachians (NC, USA). They visually assessed tree mortality in the upper canopy cover layer within the Lower Linville Watershed. They suggested that despite the modest loss in total biomass, corresponding to 0.1% of the canopy surface, the impacts were substantial to the area due to the patchy nature of the hemlock decline, as well as the elimination of a foundation species. However, on the landscape scale, the magnitude of impacts is still mainly unknown and the lack of information is even more pronounced in inaccessible areas.
Hemlocks are distributed throughout forested landscapes and grow in mixed-species stands. These landscapes generally comprise several tree species, including other conifers. High-resolution remote sensing enables a more detailed mapping of broad spatial extent. The high-resolution imagery used in our study enable a more detailed projection of the area and pattern of the hemlock decline suitable for estimating the magnitude of ecological and social impacts on the landscape-scale ([9]).
Two-phase forest cover classification
The first phase of the classification comprised the creation of a forest mask. This sub-task was mandatory for distinguishing dead trees from bare ground and some urban infrastructure, such as roads. Without this phase, our assessment for dead trees would have been overestimated. We observed that the mask followed the borders of forest and non-forested in most parts. An overall classification accuracy of 93.5% (κ = 0.83) was obtained for forest/ non-forest classification. Minor inaccuracies could be found, e.g., on the edges of bare ground ridges. This error may have been partly due to filtering of the mask and loss of small-scale information.
Projection transformations and photogrammetry can also affect spatial accuracy and thereby result in imprecise overlapping of the remote sensing data sets. The LiDAR point cloud used in the study was acquired in 2003, nine years earlier than the aerial image mosaic. A destructive forest fire occurred in the study area in 2000 ([12]), which certainly affected the forest stand dynamics. There is no information available on logging outside of the Linville Wilderness area. The threshold value for the height was purposefully kept low to minimize the impact of changes in the vegetation between 2003 and 2012. More recent LiDAR data could have improved the accuracy of the method. With simultaneously acquired high-pulse density LiDAR and aerial imagery, it may be possible to delineate and classify individual trees ([26]).
The results of our forest cover classification indicated that dead trees occurred in an area of approximately 0.64 km2 (about 2% of the study area). We found that 12.9 km2 of the area were covered by conifers. The last high mortality-causing disturbance occurred in the early 2000s. The area was infested with the southern pine beetle (Dendroctonus frontalis Zimm., SPB - [30]). Inspection of a time-series of high resolution aerial images, acquired from the Linville Gorge revealed that a large portion of the dead trees in the forest canopy surface became invisible within a span of five or more years after dying (Kantola et al., unpublished data). We assume that the majority of the dead trees were hemlocks, because the HWA has been the only high mortality agent during recent years, Therefore, we suggest that HWA herbivory has been the cause of death to nearly 5% of the overstory coniferous component of the vegetation community present at the time of data acquisition. Other plausible tree mortality agents within the area include minor infestations of other species and abiotic factors, including hardwood species. Kantola et al. ([28]) found that dead trees covered an area approximately of 0.72 km2 (0.1%) of the forested area within the Lower Linville Watershed. The central parts of the area in our study belong to the same watershed.
Use of passive remote sensing, i.e., aerial images enables only investigation of the overstory HWA mortality. Orwig & Foster ([50]) and Krapfl et al. ([34]) suggest that the mortality may be greater among understory hemlocks than in the upper canopy layers. However, the information provided by aerial images can produce good estimates of the extent and pattern of hemlock decline that include most of the biomass.
We obtained an overall accuracy of 98.1% (κ = 0.96) for the three forest cover classes. These values are probably an overestimation resulting from the visual assessment of aerial images. In cases where there was uncertainty, pixels were excluded from the evaluation data set. Shadows were excluded from the forest cover classification. Topographic correction methods for high-resolution images in order to reduce the effect of shadows can be problematic. With planning, the image acquisition can be done on date and at time of day when the shadows are less pronounced. Another option is to acquire two sets of images captured at different times of day for the assessment. Most of the shadowed areas were assumed to be covered by forest. Excluding the areas may have introduced bias into the results. However, our classification approach provided reasonable accuracy for mapping fine-scale HWA-induced tree mortality. Thomlinson et al. ([63]) set the criteria for successful land-cover classifications stating that overall classification accuracy should exceed 85% with at least 70% per-class accuracy.
A large component of the coniferous community within the study area was assumed to be hemlock. Several sources support this assumption. Using the North Carolina Vegetation Survey (NCVS) protocol, Newell & Peet ([48]) sampled 181 plots within the Linville River Watershed. Eastern and Carolina hemlocks were abundant in the vegetation classes covering most of the northern part of the Linville Gorge Wilderness, which included much of the study area ([48]). Knebel & Wentworth ([30]) reported that a combination of frequent forest fires and previous SPB infestations diminished the pine (Pinus spp.) component of the vegetation community. In addition to eastern and Carolina hemlocks, possible coniferous species within the study area include eastern white pine (P. strobus L.), pitch pine (P. rigida P.Mill.), table mountain pine (P. pungens Lamb.), and Virginia pine (P. virginiana Mill. - [48], [12]).
Since hemlocks and other conifers have similar reflectance values, distinguishing among the species is difficult and prone to errors ([57], [51], [31]). One option for addressing this issue is to sample accessible parts of target areas that are classified as conifers and collect tree-wise field data with accurate locations. Reference data may be collected from another, and accessible, landscape with similar tree species composition, with consideration. A spectral library for the coniferous species present could be built using similar remote sensing data. These spectral reflectance signature may help to distinguish the hemlock component from other conifers. Use of existing auxiliary information under conditions typical of hemlock sites could be another approach to separate hemlocks and other conifers. Environmental layers, such as topography, soil, temperature, and site-type layers can be utilized. A vast array of algorithms could be employed in modeling of the most probable areas for hemlock species within the conifer patches.
An early symptom of HWA infestation is gradual defoliation ([50], [11]). Defoliation can be estimated to some degree from aerial images or LiDAR point clouds ([55], [27], [68]). For example, Elliott & Vose ([11]) discovered that after less than three years of an HWA infestation, the mean defoliation level was over 80% in the sampling plots with 100% hemlock infestation rate. In the present study, defoliated hemlocks were included in the forest cover class of conifers. A portion of the heavily defoliated trees may have been classified as dead trees.
Remote sensing in hemlock mapping and HWA monitoring
Although high-resolution imageries have not been utilized in mapping hemlocks and HWA-induced tree decline, there are studies that have used various remote sensing approaches. Koch et al. ([31]) studied hemlock mapping via ASTER (Advanced Spaceborne Thermal Emission and Reflection Radiometer) satellite images in the Great Smoky Mountains of North Carolina. Auxiliary raster layers were used to enhance the classification. Their overall classification accuracy was 85.3% (κ=0.77) and the accuracy of hemlock stand detection was 69%. In the western part of their study area, hemlocks were limited to narrow riparian corridors. In the eastern part, hemlocks were more broadly distributed. These authors assumed that restricting hemlocks to riparian corridors in the training data caused misclassification in the other areas.
Royle & Lathrop ([58]) investigated the use of multi-temporal Landsat TM derived vegetation indexes in mapping the health of hemlock forest stands in Connecticut. The best overall classification accuracy for four hemlock forest health classes was 82%. Wimberly & Reilly ([71]) used Landsat TM images to assess fire severity and species diversity in the Linville River Gorge. Eastern hemlock was associated with moist areas along ravines and at the bottom of the gorge. Kong et al. ([33]) used Landsat TM and ASTER images combined with environmental variables to detect hemlock stands in a study conducted in Kentucky. From the evergreen pixels, they correctly detected 72% of the hemlock points. Pontius et al. ([55]) detected hemlock-dominated pixels from AVIRIS hyperspectral images (Airborne Visible/Infrared Imaging Spectrometer) with 83% accuracy in New York.
Impacts of HWA on the landscapes
Our classification image indicated that conifers and dead trees were abundant in the proximity of the Linville River, on steep hillsides, and at high elevations. Most of the dead trees were located in the northern and northwestern aspects. Kantola et al. ([28]) obtained similar results, showing that within the Lower Linville Watershed, the density of the dead trees was higher in proximity to the Linville River, at higher elevations, and in the northern and northwestern aspects. They also found that the spatial pattern of the dead trees was typically clustered. They obtained the results with more time-consuming visual assessment of aerial images. The classification image showed that conifers were most abundant on northern and western slopes and drainage. This observation is in line with the results from other reports. Narayanaraj et al. ([47]) examined the topographical pattern of living eastern hemlock in the Coweeta Basin of North Carolina. Their results showed that living eastern hemlocks were more abundant close to streams and on flat or gentle slopes, at lower elevations. They found that eastern hemlock was absent above 1250 m. In a study conducted in central Connecticut, Orwig et al. ([51]) observed that a large number of hemlock stands were located on ridge tops, steep hillsides, and in narrow valleys. Hemlock mortality occurred mostly on the westward-facing slopes. Several studies suggested that microclimate and soil conditions related to variation in topography are important factors in HWA damage ([20] [47]).
Trotter et al. ([65]) used the USDA Forest Service Forest Inventory and Analysis (FIA) database to address changes in hemlock abundance in the eastern USA. They observed an increase in the basal area of living and dead hemlocks during a 20-year study period at county- and state-levels. Trotter et al. ([65]) suggested that impacts of HWA are not evident at the regional level. Our results indicate that the reduction in total plant biomass within the landscape is modest. Hemlocks, serving as foundation species, play multiple functional roles in forested landscapes, such as modifying environmental conditions and providing forage and habitat resources for a variety of taxa. Therefore, the impacts of the decline are profound. The clustered pattern of the dead trees, especially in the riparian areas, can intensify the impacts on forest landscapes and ecosystems.
The developed two-phase classification strategies used in this investigation can be adapted for monitoring other invasive pest insects that cause heavy defoliation and tree mortality, e.g., the gypsy moth (Lymantria dispar L.), SPB, and emerald ash borer (Agrilus planipennis Fairmaire). The methodology can also be used with auxiliary information to produce training sets for large area inventories with lower-resolution remote sensing data sets.
Conclusions
The HWA is a major mortality agent of eastern and Carolina hemlocks throughout their distribution in the eastern USA. Accurate spatially explicit information on hemlock distribution and HWA-induced mortality is not available at the landscape-level. Therefore, it is not possible to evaluate the impact of this insect on the vegetation community in which hemlocks are a prominent component. The straightforward two-phase methodology described herein, which utilizes aerial images and LiDAR point clouds, can result in distribution maps of considerable accuracy. This procedure is suitable for mapping the coniferous patches that include the hemlock component of the vegetation community and for distinguishing tree mortality resulting from the HWA or other disturbance agents.
Acknowledgments
This study was made possible by financial aid from the Graduate School in Forest Sciences (GSForest) in Finland, the Finnish Academy project “Centre of Excellence in Laser Scanning Research” (CoE-LaSR, decision number 272195), the University of Helsinki project “Towards semi-supervised characterization and large-area planning of forest resources using airborne laser scanning data acquired for digital elevation modeling”, and by the US Forest Service through USDA Forest Service cooperative agreement SRS-12-CA-11330129-077. We thank Dr. Hannu Saarenmaa for fruitful insights.
References
Gscholar
CrossRef | Gscholar
CrossRef | Gscholar
Online | Gscholar
Gscholar
Gscholar
Online | Gscholar
Gscholar
Gscholar
Online | Gscholar
Authors’ Info
Authors’ Affiliation
Robert N Coulson
Maria D Tchakerian
Knowledge Engineering Laboratory, Department of Entomology, Texas A&M University, College Station, TX 77843-2475 (USA)
Markus Holopainen
Department of Forest Sciences, University of Helsinki, P.O. Box 27, FI-00014 Helsinki (Finland)
USDA Forest Service, Southern Research Station, Alexandria Forestry Center, 2500 Shreveport Highway, Pineville, LA 71360 (USA)
Corresponding author
Paper Info
Citation
Kantola T, Lyytikäinen-Saarenmaa P, Coulson RN, Holopainen M, Tchakerian MD, Streett DA (2016). Development of monitoring methods for Hemlock Woolly Adelgid induced tree mortality within a Southern Appalachian landscape with inhibited access. iForest 9: 178-186. - doi: 10.3832/ifor1712-008
Academic Editor
Massimo Faccoli
Paper history
Received: May 14, 2015
Accepted: Nov 20, 2015
First online: Jan 02, 2016
Publication Date: Apr 26, 2016
Publication Time: 1.43 months
Copyright Information
© SISEF - The Italian Society of Silviculture and Forest Ecology 2016
Open Access
This article is distributed under the terms of the Creative Commons Attribution-Non Commercial 4.0 International (https://creativecommons.org/licenses/by-nc/4.0/), which permits unrestricted use, distribution, and reproduction in any medium, provided you give appropriate credit to the original author(s) and the source, provide a link to the Creative Commons license, and indicate if changes were made.

Web Metrics
Breakdown by View Type
Article Usage
Total Article Views: 44562
(from publication date up to now)
Breakdown by View Type
HTML Page Views: 36579
Abstract Page Views: 2490
PDF Downloads: 4388
Citation/Reference Downloads: 23
XML Downloads: 1082
Web Metrics
Days since publication: 3030
Overall contacts: 44562
Avg. contacts per week: 102.95
Article Citations
Article citations are based on data periodically collected from the Clarivate Web of Science web site
(last update: Feb 2023)
Total number of cites (since 2016): 6
Average cites per year: 0.75
Publication Metrics
by Dimensions ©
Articles citing this article
List of the papers citing this article based on CrossRef Cited-by.
Related Contents
iForest Similar Articles
Research Articles
Hemlock woolly adelgid niche models from the invasive eastern North American range with projections to native ranges and future climates
vol. 12, pp. 149-159 (online: 04 March 2019)
Review Papers
Remote sensing-supported vegetation parameters for regional climate models: a brief review
vol. 3, pp. 98-101 (online: 15 July 2010)
Review Papers
Accuracy of determining specific parameters of the urban forest using remote sensing
vol. 12, pp. 498-510 (online: 02 December 2019)
Review Papers
Remote sensing of selective logging in tropical forests: current state and future directions
vol. 13, pp. 286-300 (online: 10 July 2020)
Technical Reports
Detecting tree water deficit by very low altitude remote sensing
vol. 10, pp. 215-219 (online: 11 February 2017)
Review Papers
Remote sensing support for post fire forest management
vol. 1, pp. 6-12 (online: 28 February 2008)
Research Articles
Afforestation monitoring through automatic analysis of 36-years Landsat Best Available Composites
vol. 15, pp. 220-228 (online: 12 July 2022)
Research Articles
Assessing water quality by remote sensing in small lakes: the case study of Monticchio lakes in southern Italy
vol. 2, pp. 154-161 (online: 30 July 2009)
Technical Reports
Remote sensing of american maple in alluvial forests: a case study in an island complex of the Loire valley (France)
vol. 13, pp. 409-416 (online: 16 September 2020)
Research Articles
Evaluation of hydrological and erosive effects at the basin scale in relation to the severity of forest fires
vol. 12, pp. 427-434 (online: 01 September 2019)
iForest Database Search
Google Scholar Search
Citing Articles
Search By Author
Search By Keywords
PubMed Search
Search By Author
Search By Keyword


