Nutritional, carbon and energy evaluation of Eucalyptus nitens short rotation bioenergy plantations in northwestern Spain
iForest - Biogeosciences and Forestry, Volume 9, Issue 2, Pages 303-310 (2015)
doi: https://doi.org/10.3832/ifor1505-008
Published: Oct 05, 2015 - Copyright © 2015 SISEF
Research Articles
Abstract
This study provides essential information related to the nutrient and carbon levels and the energy potential of Eucalytpus nitens (Deane & Maiden) Maiden bionenergy plantations located in northwestern Spain. Nutritional analysis showed that leaves and bark had the highest concentrations of N, P, K and Mg. Carbon concentration was constant for all above-ground tree components. Nutrients and carbon were analyzed at stand level according to plantation productivity. Stemwood, the main tree component at the end of the rotation, had the highest nutrient content, except for N and Ca, which were highest in leaves and bark respectively. Based on this study, the nutrient content per ha of above-ground biomass was 243-706 kg N, 44-122 kg P, 131-375 kg K, 121-329 kg Ca and 25-67 kg Mg at the end of the bioenergy rotation (6-12 years, depending on site quality) and 19-56 Mg C ha-1. Energy analysis showed a fairly constant Net Calorific Value for wood, 18.32 ± 0.19 MJ kg-1. The results obtained are valuable for selecting the most appropriate forest management system in these bioenergy plantations, and thereby promote the sustainable use of woody crops.
Keywords
Eucalyptus, Woody Crops, Bioenergy, Site Quality, Nutrient, Carbon, Energy Potential, Calorific Value
Introduction
Short rotation woody crops can produce high biomass yields in a short period of time and play a key ecological and economic role as an alternative use for abandoned agricultural lands and as a renewable power source ([39]).
Woody crops are particularly suitable as a bioenergy source because their cycles are relatively short compared with traditional forestry. However, since in bioenergy plantations the above-ground tree biomass is harvested to maximize yields, tree components such as branches, leaves (in evergreen species) and bark that contain a significant amount of nutrients ([46], [31], [51]) are extracted. In addition, the shorter the rotation, the higher the ratio of crown components in the above-ground biomass, which compounds this problem as these, especially the foliage, are the components with the highest nutrient concentrations ([25], [6]). Increased use of forest fuels thus results in an intense export of plant nutrients from the forest ([44]) and hence, harvesting of such crops and the concomitant nutrient export from the site should be major considerations in sustainable production ([21]). Nutrient removal resulting from biomass harvesting can easily exceed nutrient contributions through natural means, such as mineral weathering or atmospheric inputs, and therefore woody crops can result in greater soil degradation than longer rotation plantations ([44]).
There is a great degree of uncertainty as regards to the concentrations of nutrients acquired by species and their distribution through the various tree components ([37]) that needs to be clearly addressed in order to provide the tools necessary for forest managers to make decisions which ensure the sustainability of land use. In Northwest Spain, nutritional information is available for Eucalyptus globulus Labill. ([7], [46], [2]) although currently information for Eucalyptus nitens, a species with great bioenergy potential in this area ([40]), is limited. A notable exception is a study of nutritional information for this species in relation to wood or pulp production at stand ages of 9-13 years and stockings from 400 to 1400 trees ha-1 ([45]).
Furthermore, interest in the use of Eucalyptus plantations for thermal or electric power in northwest Spain highlights the importance of establishing information regarding the energy content of a stand ([43], [42]). The most suitable energy crop species should combine high production with high quality biomass ([24]), and Eucalyptus have higher energy potential than other fast growing energy species such as Populus and Pawlonia ([48]). Within the Eucalyptus genus the energy potential of residual biomass (tree fractions obtained from wood harvesting that are not used for wood or pulp production) has been found to be higher for E. nitens than for E. globulus in northern Spain ([43]). A better understanding of biofuel properties facilitates the increased use of forest energy, which helps mitigate the climate change on a global scale, among its many advantages ([28]).
The importance of Eucalyptus species in the forestry sector of northwest Spain, as well as the increasing interest in bioenergy systems and the lack of knowledge pertaining to the influence of forestry management and site quality on nutrient balance and carbon content within the system, have led to the following objectives to be defined for this work: (1) to assess the nutritional status of E. nitens bioenergy plantations; (2) to study the concentration and distribution of nutrients in above-ground biomass; and (3) to estimate the level of nutrients removed at the end of the rotation (depending on productivity). At the same time, the carbon content (4) and the energy potential (5) of these crops were also evaluated to provide essential information for the use and management of these bioenergy plantations.
Material and methods
Stand characteristics
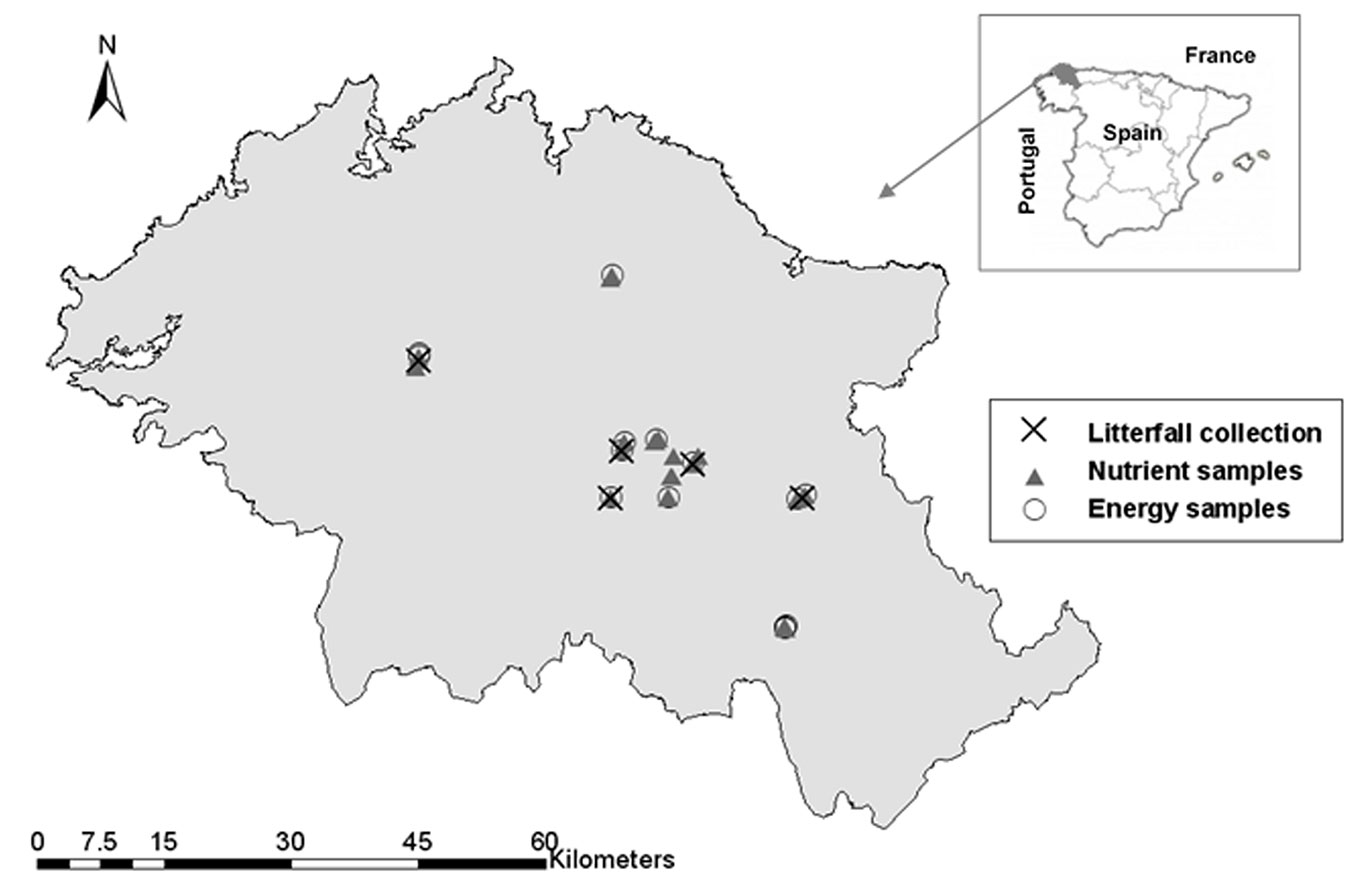
The study was carried out in northwest Spain (Fig. 1) in the distribution area of the bioenergy plantations of Eucalyptus nitens (Deane & Maiden) Maiden (McAlister provenance from the central Highlands in Victoria, Australia). The dataset used in this study came from 40 experimental plots, each of 400 m2, installed in E. nitens stands that had been previously established using seedlings. These plots were subjectively chosen to represent the range of site conditions, ages and stocking densities (2300 to 5600 trees ha-1) for this type of plantation in the study area. The climate of the area is defined as European Atlantic with an average annual precipitation of approximately 1200 mm and an average annual temperature of 11 °C.
Fig. 1 - Study area and location of sample collection.
In this region Eucalyptus are generally planted in existing forest land in soils that are limited in terms of forest productivity, although in recent decades there has been an increase in the use of abandoned agricultural land, which is highly productive ([32]).
The study stands had been fertilized using 100-150 g per plant of 8/24/16 NPK immediately after planting, equal to 230-840 kg of fertilizer ha-1 (18-67 kg N ha-1, 24-89 kg P ha-1 and 31-112 kg K ha-1) according to plant stocking. Chemical and mechanical weed control had been carried out when necessary to avoid competition, especially during the first stages of the plantations ([4]).
Sample collection
The destructive sample used in this study was composed of 120 trees (three per plot) aged between 2 and 5 years, which represented the height-diameter distribution in the stands which was obtained in a previous inventory (for further information see [18], [19]). These trees were cut down and separated into five tree components: leaves, branches, dead branches, stemwood and bark, to estimate above-ground tree biomass, as described in González-García et al. ([18]). A subsample consisting of 25 % by weight of the crown components (leaves and branches) and stem disks (for wood and bark), was taken to the laboratory and oven dried to a constant weight at 65 °C to avoid nutrient volatilisation.
For the nutrient analysis, the dried biomass samples of the three trees felled per plot were ground and all samples of the same component were mixed to produce a representative sample of the site and the component. Fifty such samples (10 per tree component) corresponding to different site qualities, tree ages and stockings in order to cover the variability existing in the stands were analyzed.
Furthermore, from each trunk several other wood disks were cut at various heights from the ground and transported to the laboratory and stored prior to energy evaluation. A total of 17 wood samples from 14 sites, all corresponding to disks cut at a height of 0.5 m from the ground, were selected for energy evaluation according to several criteria, such as plot location, site quality, stand age and tree diameter.
Fig. 1 shows the locations of the sample collection points and Tab. 1 lists the descriptive statistics of the sample trees and the disks selected for this study.
Tab. 1 - Descriptive statistics for the main variables measured in the sample of biomass trees (120 trees) and stemwood disks (17 trees & disks).
| Variables | Min | Max | Mean | Std. Dev. |
|---|---|---|---|---|
| Tree age (years) | 2 | 5 | 3.4 | 0.7 |
| Total height (m) | 2.61 | 15.48 | 6.43 | 2.33 |
| Diameter at breast height (cm) | 1.75 | 14.3 | 5.77 | 2.58 |
| Above-ground dry biomass (kg) | 0.58 | 45.87 | 7.6 | 7.44 |
| Stemwood volume (dm3) | 1.26 | 137.71 | 19.76 | 21.95 |
| Disk diameter at 0.5 m height (cm) | 2.7 | 15.75 | 7.22 | 3.22 |
Net production in a forest should be evaluated as the sum of biomass accumulation and litterfall production, although, in fact, litterfall is hardly ever used for energy production. However, its estimation is important to study carbon accumulation and nutrient cycle ([40]) and at the moment there are no publications for the species in the region which include this information. Litterfall was collected monthly during 1 year in five sites which covered plantation variability according to stand age (3-7 years by the time the samples were collected), stocking (2300-5600 trees ha-1), site quality and location (Fig. 1). Stand age was higher in this case than in the tree biomass sampling (Tab. 1) because litter was collected some considerable time after biomass destructive sampling. Four foliar traps, each with a total area of 1.8 m2, were distributed within each of the selected stands and the litterfall mass collected then taken to the laboratory and dried to constant weight.
Nutritional evaluation
Different methods were used to determine the concentrations of the different elements in the biomass. The percentage of total C and N was determined by high temperature combustion using an automatic analyser, Leco-TruSpec CHN® (LECO, St. Joseph, MI, USA). Although Na is not considered a nutrient, it is an important element in bioenergy because it produces corrosion in boilers, and thus Na concentration was considered in this study. Ca, Mg, K and Na were extracted by acid digestion in a microwave using HNO3 and HCl and determined by atomic absorption ([15]). The pH of the extract was then adjusted and P was analyzed by colorimetry ([36]).
Variations in the concentration of the different elements in the distinct tree components studied (leaves, branches, dead branches, stemwood and bark) were analyzed individually for each element using the non-parametric Kruskal-Wallis Test ([8]).
The concentrations of nutrients in the foliage are those most frequently sampled and analyzed, and hence those that are more easily comparable between studies ([23]). Typical ranges of foliar nutrients in live leaves obtained from Eucalyptus species ([23]), together with reference values for E. nitens ([49]) obtained by different laboratories around the world (IUFRO Inter-laboratory Comparisons), and reference values for E. nitens in the region ([45]) were used to evaluate the nutritional status of the plantations (Tab. 2) as well as the soil information from the stands, which is presented in Tab. 3.
Tab. 2 - Typical values of nutrients in live leaves for Eucalyptus species ([23]), reference values for E. nitens obtained by different laboratories around the world ([49]) and in the region ([45]).
| Range | Foliar nutrient concentration (g kg-1 dry biomass) | ||||
|---|---|---|---|---|---|
| N | P | K | Ca | Mg | |
| Typical Eucalyptus spp. | 10.0-23.0 | 0.5-1.5 | 4.0-14.0 | 5.0-10.0 | 2.0-4.0 |
| Reference E. nitens (world) | 15.9-25.4 | 1.2-1.7 | 6.3-10.5 | 4.2-7.0 | 0.8-1.4 |
| Reference E. nitens (region) | 15.76±1.53 | 1.0±0.2 | 4.2±0.8 | 4.2±0.8 | 1.6±0.3 |
Tab. 3 - Soil properties of the stands studied (40 sites). Methods: (a) method described in Mehlich ([30]); (b) method described in Peech ([38]).
| Variable | Min | Max | Mean | Std. Dev. |
|---|---|---|---|---|
| pH (H2O 1:2.5) | 3.90 | 5.27 | 4.46 | 0.29 |
| Electrical conductivity (dS m-1) | 0.02 | 0.19 | 0.06 | 0.03 |
| Organic matter (%) | 7.90 | 22.27 | 12.49 | 3.07 |
| Total N (%) | 0.10 | 0.40 | 0.22 | 0.07 |
| C/N ratio | 15.79 | 71.77 | 35.30 | 12.66 |
| Available P(a) (mg kg-1) | 10.20 | 18.13 | 14.60 | 2.10 |
| CaCEC(b) (cmolc kg-1) | 0.04 | 0.88 | 0.16 | 0.15 |
| MgCEC(b) (cmolc kg-1) | 0.06 | 0.51 | 0.20 | 0.09 |
| NaCEC(b) (cmolc kg-1) | 0.09 | 0.45 | 0.17 | 0.06 |
| KCEC(b) (cmolc kg-1) | 0.12 | 0.85 | 0.27 | 0.13 |
| AlcEC(b) (cmolc kg-1) | 1.96 | 14.82 | 6.64 | 2.44 |
| Sum of base cations (cmolc kg-1) | 0.45 | 1.40 | 0.81 | 0.25 |
| Effective cation exchange capacity (cmolc kg-1) | 2.84 | 15.60 | 7.44 | 2.43 |
| Sand (%) | 13.00 | 71.72 | 42.31 | 14.92 |
| Clay (%) | 2.70 | 39.61 | 11.87 | 7.49 |
| Silt (%) | 17.17 | 73.10 | 45.83 | 14.04 |
Mean nutrient content was estimated for each tree component according to site index (SI), which is an indicator of forest site quality, defined as the dominant height (Ho) of the stand at a specific base age. In total, four quality classes have been defined for E. nitens woody crop stands in northwest Spain: 5, 8, 11 and 14 m (class midpoint) at a reference age of 4 years ([20]). The projections of dominant height and basal area in the present study, which were necessary for the biomass estimation at the end of the rotation, were obtained from the dynamic growth model and initialization function fitted in González-García et al. ([20]).
The biomass dry weight of each tree component at stand level was estimated using the allometric models previously developed for E. nitens woody crops ([18]) using dominant height and projected basal area values. Once the biomass of the different tree components was estimated, these values were multiplied by the mean nutrient concentration (N, P, K, Mg, Ca) of the corresponding tree component to quantify the nutritional content of each site quality class at the end of the rotation. Rotation length was obtained from the intersection of Mean Annual Increment (MAI) and Current Annual Increment (CAI) data and ranged from 6 to 12 years for the highest and the lowest site quality respectively ([20]).
Finally, carbon content at stand level was calculated for all the above-ground biomass components using the same methodology as explained in the earlier section on nutrient content estimation.
Energy evaluation
In this study, only the wood component was analyzed in relation to energy potential, although information for the other biomass components was also taken into account, using results derived from studies of E. nitens forest residues in northern Spain ([43], [41], [42]).
For energy evaluation the stored stemwood disks (from a height of 0.5 m) were ground separately in a cutting mill with a bottom sieve of 1 mm. Subsequent analyses were carried out using a LECO TGA-701® to determine moisture, ash and volatile matter content of the samples. In addition, final analyses to obtain C, H and N levels were made using a LECO CHN-2000® and with a LECO-S632® to determine sulphur content, while oxygen content was calculated as the difference. All analyses were made in duplicate.
Calorific values were determined using an IKA C4000® calorimeter (Gemini BV, Apeldoorn, Netherlands), which provides a direct evaluation of Gross Calorific Value (GCV). Net Calorific Value (NCV) was calculated from GCV values by applying the H content of each sample.
Results and discussion
Nutritional evaluation
The results of the nutrient analysis for E. nitens woody crops are shown in Tab. 4. Leaves showed the highest mean value of N, 14.58 g kg-1, which is significantly higher (p<0.05) than in the other components, while the wood and dead branches components had the lowest, 2.06 and 2.58 g kg-1, respectively. Similar trends were found in the P and K analyses, where mean values were 2.38 g kg-1 and 4.95 g kg-1 in leaves, for both elements respectively. These nutrient concentrations showed significant differences with respect to other tree components. In contrast, P and K concentrations in dead branches were significantly lower than in the other fractions. Thus, in general terms, the magnitude of concentration of the elements N, P and K was as follows: leaves > bark > branches > wood > dead branches, although the order of the latter two components occasionally changed. In terms of Mg, bark, followed by leaves, showed the highest mean values, the difference between them being significant, and levels in wood being the lowest. The concentrations for this element ranged from 0.27 to 1.67 g kg-1. In contrast, Ca values were highest in bark and dead branches.
Tab. 4 - Content and distribution of elements in the different above-ground tree biomass components (10 samples per component) for tree age from 2 to 5 years. In the mean column, the same letter indicates that there are no significant differences (p-value < 0.05) in the concentration of the element analyzed between tree components.
| Element | Tree component |
Min | Max | Mean | Std. error |
|---|---|---|---|---|---|
| N (g kg-1 dry biomass) | Leaves | 5.78 | 18.37 | 14.58 a | 0.11 |
| Branches | 2.86 | 6.29 | 4.61 c | 0.03 | |
| Dead branches | 1.81 | 3.57 | 2.58 d | 0.02 | |
| Wood | 1.36 | 3.40 | 2.06 d | 0.02 | |
| Bark | 3.16 | 7.62 | 5.62 b | 0.04 | |
| P (g kg-1 dry biomass) | Leaves | 0.79 | 2.87 | 2.38 a | 0.19 |
| Branches | 0.58 | 1.72 | 1.13 b | 0.11 | |
| Dead branches | 0.12 | 0.42 | 0.28 d | 0.03 | |
| Wood | 0.25 | 1.40 | 0.76 c | 0.12 | |
| Bark | 0.42 | 1.62 | 1.33 b | 0.12 | |
| K (g kg-1 dry biomass) | Leaves | 3.83 | 5.74 | 4.95 a | 0.17 |
| Branches | 2.00 | 4.70 | 3.43 c | 0.31 | |
| Dead branches | 0.51 | 1.70 | 0.86 d | 0.14 | |
| Wood | 1.28 | 4.25 | 2.72 c | 0.37 | |
| Bark | 2.59 | 7.06 | 4.44 b | 0.36 | |
| Ca (g kg-1 dry biomass) | Leaves | 3.08 | 7.86 | 5.28 b | 0.46 |
| Branches | 2.54 | 10.38 | 5.51 b | 0.72 | |
| Dead branches | 7.14 | 13.64 | 9.86 a | 0.60 | |
| Wood | 0.20 | 1.26 | 0.62 c | 0.10 | |
| Bark | 5.52 | 16.14 | 10.92 a | 1.12 | |
| Mg (g kg-1 dry biomass) | Leaves | 0.98 | 1.68 | 1.35 b | 0.07 |
| Branches | 0.32 | 1.04 | 0.69 c | 0.06 | |
| Dead branches | 0.50 | 1.02 | 0.74 c | 0.06 | |
| Wood | 0.12 | 0.60 | 0.27 d | 0.05 | |
| Bark | 1.08 | 2.18 | 1.67 a | 0.11 | |
| Na (g kg-1 dry biomass) | Leaves | 0.35 | 1.19 | 0.68 a | 0.07 |
| Branches | 0.35 | 1.43 | 0.84 a | 0.10 | |
| Dead branches | 0.30 | 0.80 | 0.56 a | 0.05 | |
| Wood | 0.36 | 1.69 | 0.71 a | 0.13 | |
| Bark | 0.28 | 1.57 | 0.66 a | 0.13 |
Similar patterns of nutrient distribution in biomass components have been found in various Eucalyptus studies ([23], [33], [7], [25], [21], [46], [2], [45]), although the dead branch component was not considered in most cases.
Na concentration ranged from 0.56 to 0.84 g kg-1 and did not show significant differences between tree components (Tab. 4) albeit they were higher than those obtained by Rodríguez da Costa ([45]) for the same species in the region, except in bark where the concentration was higher in the earlier study.
Mean foliar nutrient concentrations were within the typical range for the species for N, K and Ca, although they were below the typical range in some stands. However, a high P concentration was found in leaves, higher than the typical range, and is evidence of the fact that this nutrient was found to be available in the soil in concentrations of 10-20 mg kg-1, where 5 mg P kg-1 is considered to be the limiting threshold in agricultural crops. This is likely to be the result of a positive response to fertilization in these stands, given that unfertilized soils in the region generally have low levels of P, at or below the limit of the threshold cited. An additional problem is the tendency for P to form complexes with metals in the soil, thereby making it inaccessible to plants ([11]). In contrast, for Mg, which was not applied in the fertilization treatment, none of the stands analyzed reached the typical minimum foliar concentration (< 2 g kg-1) which is probably linked to the low availability of this element in the soil. In general the soils analyzed in this study had low values of exchangeable Mg and Ca. This is in line with the typical values found for the acidic forest soil of the region ([11], [7], [3]), which are below the thresholds considered as limiting for agricultural crops, i.e., 0.4 and 1.5 cmolc kg-1 for Mg and Ca respectively ([10], [12]). For K, although the soil concentration had been modified by fertilization following planting, 30 % of the stands had values lower than 0.2 cmolc kg-1, the threshold below which deficiencies are characterized in crops.
Comparing the findings of the current study with other studies for E. nitens in the region ([45]), K and Mg concentrations were found to be similar, N was slightly lower, while Ca was slightly higher, although all were within a similar range in the two studies. On the other hand, P concentrations were much higher in the current study compared to in the E. nitens stands evaluated by Rodríguez da Costa ([45]). However, the stands in the latter were considerably older (9-13 years) and had much lower stocking densities (400-1400 trees ha-1) than the plantations studied here (2 to 5 years at stockings of 2300-5600 trees ha-1). It may well be that the high rate of fertilization applied as a result of the high stocking (24-89 kg P ha-1) may have had an effect on the results obtained in this study.
Finally, according to the reference values for E. nitens from several laboratories around the world, foliar levels of N and K were below the normal range, while Ca and Mg were both within it, and P was above the reference values ([49]).
Several factors could be involved in determining the tree nutrient content of the plantations studied, such as site fertility, season or age ([34], [25]). Stand age may possibly have a large effect in this study due to young age of the stands when comparing nutrient levels with the rates found in older stands for the same species in the region ([45]). A marked influence in accumulation of nutrients has been shown during two stages of stand growth, the juvenile phase up to canopy closure, and the period following canopy closure up to harvest, in trials with short rotation Eucalyptus forests in Congo ([26]).
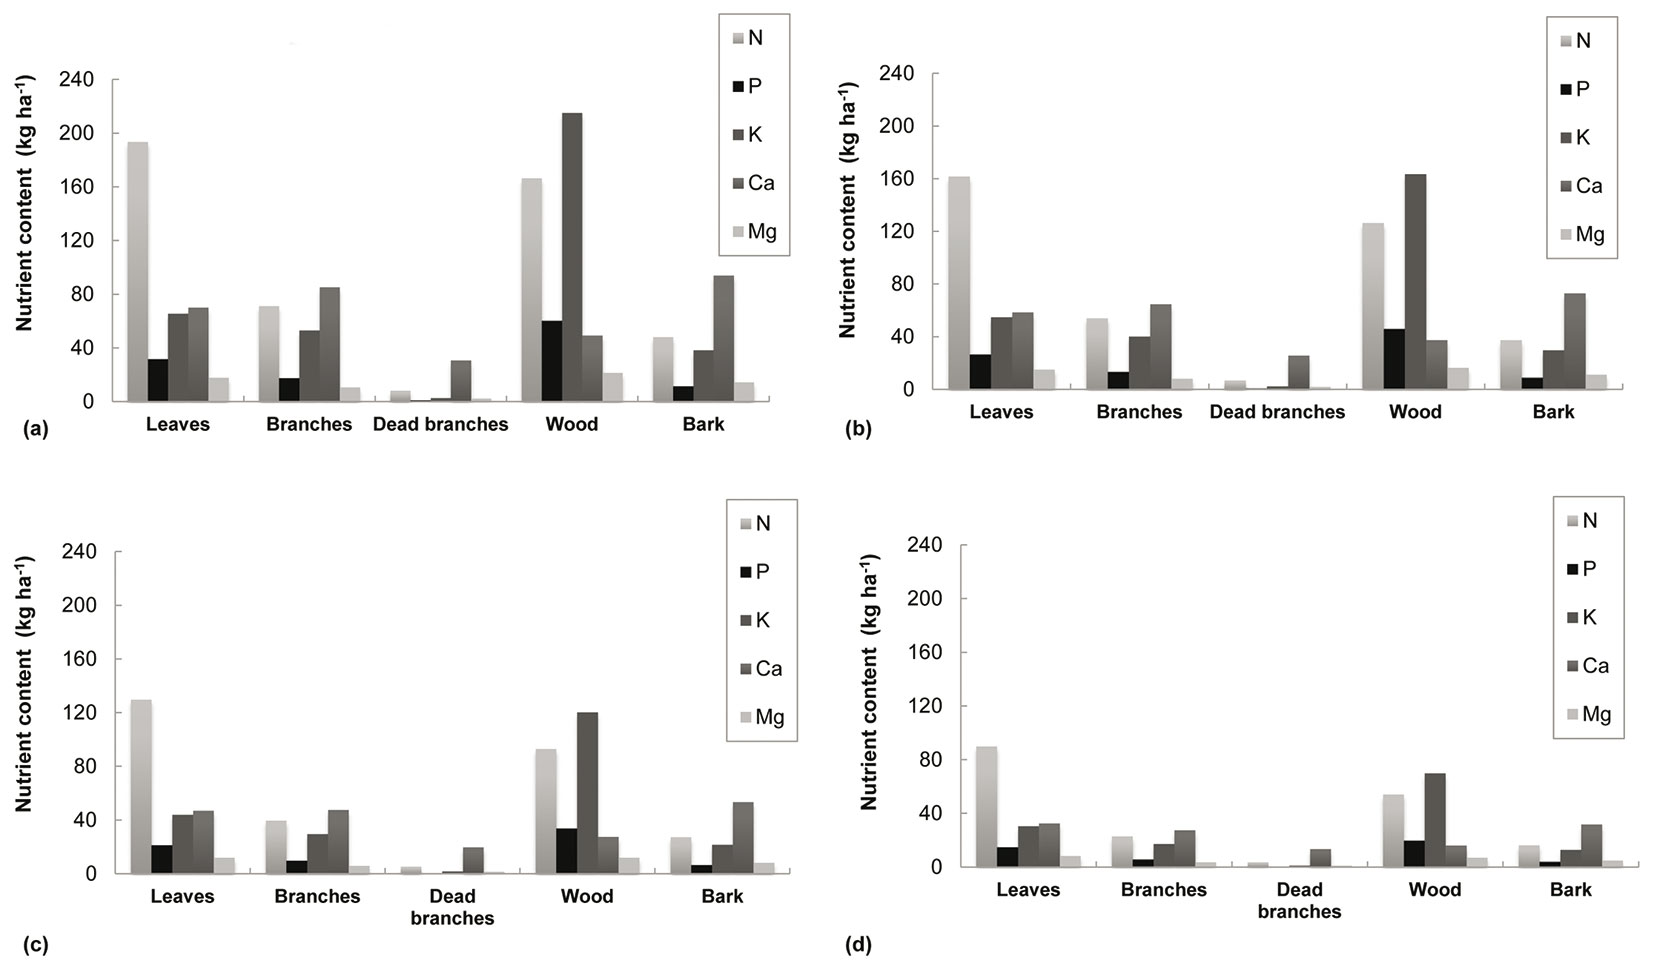
Nutrient removal estimations are represented in Fig. 2. Estimations of nutrient content for the stemwood fraction at stand level were: 20-60 kg P ha-1, 70-215 kg K ha-1 and 7-21 kg Mg ha-1, depending on site quality. Furthermore, leaves had the highest N (90-193 kg ha-1) while Mg levels were similar in wood (7-21 kg ha-1) and in leaves (8-18 kg ha-1). Finally, the bark component presented the highest value for Ca, 32-94 kg ha-1, followed by branches, 27-85 kg ha-1. Tab. 5 presents the total nutrient content, both for the plantation cycle and annually (depending on rotation length) for the lowest and the highest site quality.
Fig. 2 - Nutrient quantification in biomass components according to site quality at the end of the rotation. Site quality, defined by site index (base age of 4 years), was projected at the end of the rotation using the growth models and the biomass equations developed for E. nitens woody crops ([18], [20]). Above-ground biomass (WAGB) is based on dry weight. (a) Site quality I (SI=14 m), WAGB= 120 Mg ha-1 (6 years). (b) Site quality II (SI=11 m), WAGB= 92 Mg ha-1 (7 years). (c) Site quality III (SI=8 m), WAGB= 69 Mg ha-1 (9 years). (d) Site quality IV (SI=5 m), WAGB= 41 Mg ha-1 (12 years).
Tab. 5 - Nutrient extraction in above-ground biomass at stand level (from low to high site quality) for complete rotation and annually.
| Period | N (kg ha-1) | P (kg ha-1) | K (kg ha-1) | Ca (kg ha-1) | Mg (kg ha-1) |
|---|---|---|---|---|---|
| Rotation | 243-706 | 44-122 | 131-375 | 121-329 | 25-67 |
| Annual | 21-118 | 4-20 | 11-62 | 11-55 | 2-11 |
These estimations show that nutrient content varies greatly according to site quality and the specific nutrient involved. However, an approximately 3-fold differences between nutrient content in low and high quality stands was found across all nutrients when the rotation was considered, compared to a 5-fold difference when considering nutrient content on an annual basis.
While the results provided here establish reference values for stands of differing site quality, forest managers need to estimate actual dry weight of the biomass production of the plantation in question to calculate the specific nutrient extraction. This input can then be used together with other inputs of the nutrient cycle (atmospheric deposition, bedrock degradation, atmospheric fixation, above- and below-ground litter turnover etc.) and outputs (volatilization, lixiviation, etc.) in order to determine the re-fertilization needs of the stand.
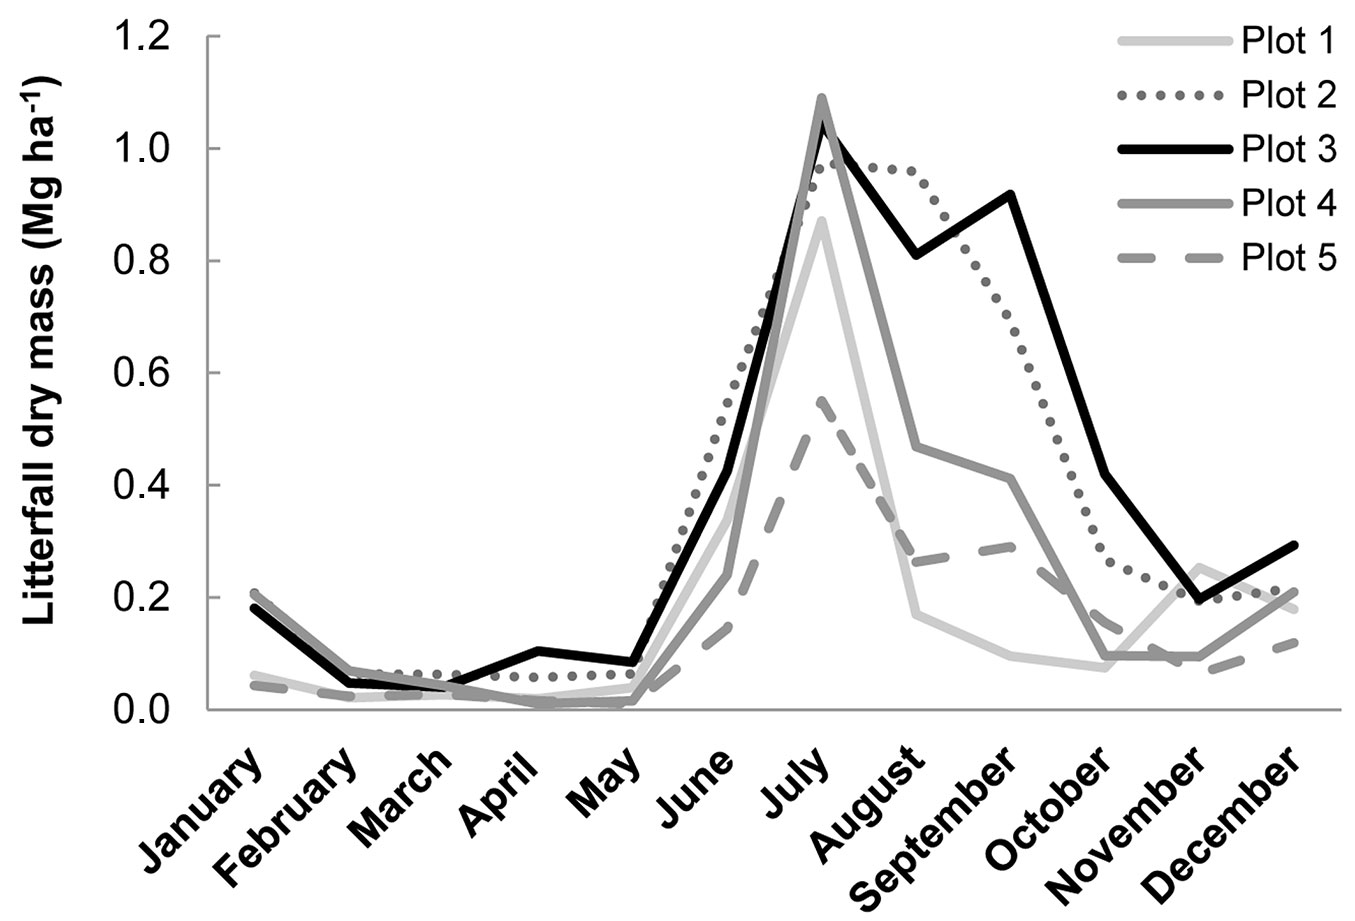
Litterfall rates shown in Fig. 3 (Tab. 6 shows characteristics of the sites sampled) exhibited the same trend in annual variation. They peaked in the dry season and at the onset of the rainy season, as has been found in other studies ([13]). Monthly litterfall was highly variable, ranging from 0.01 to 1.09 Mg ha-1, and the annual mean was between 1.71 and 4.56 Mg ha-1 (depending on stand), lower than in other studies of 3- to 7-year-old E. nitens plantations in Chile (4-9 Mg ha-1y-1 - [5], [1], [17]).
Fig. 3 - Monthly litterfall variation in the stands studied.
Tab. 6 - Characteristics of the sites used in litterfall collection.
| Plot | Site Index (m) (Reference age: 4 years) |
Stocking (trees ha-1) |
Soil class (Texture) |
|---|---|---|---|
| 1 | 6.7 | 3400 | Silty loam |
| 2 | 14.2 | 3750 | Clay loam |
| 3 | 8.0 | 5200 | Silt |
| 4 | 7.5 | 3400 | Silty loam |
| 5 | 11.4 | 2400 | Loam |
Options other than chemical fertilizers can be applied in bioenergy plantations to avoid compromising soil fertility, and consequently productivity. Fertilization with ash, the solid residue produced after biomass combustion, which is rich in inorganic elements previously taken up from the soil during tree growth, is one possible way to close the nutrient cycle. Another alternative is sewage sludge, which provides essential nutrients for plant growth, and organic matter which improves soil structure and water storage ([9]). However, the use of ash or sewage needs to be calculated according to the specific characteristics of a plantation to obtain efficient nutrient consumption and to avoid problems focused on soil or groundwater contamination, especially when these products contain compounds such as heavy metals ([21]).
Carbon estimation
The results of the carbon (C) analysis showed, as expected, a fairly constant content in the above-ground components, the average being 47.09 %. Leaves had the highest values at 50.20 %, while bark had the lowest, 44.70 %, both exhibiting significant differences with respect to the other components, and the major tree component, wood, contained 46.67 % (Tab. 7). These values thus provide a more accurate carbon transformation value for E. nitens woody crops, of great use since carbon content is easily overestimated if the typical transformation value of 50 % is used by default, as is the case in some studies of other species ([27], [50], [51]).
Tab. 7 - Distribution and content of carbon in the different above-ground tree biomass components (10 samples per component). The results relate to dry biomass. In the mean column, the same letter indicates that there are no significant differences (p-value < 0.05) in the concentration of the element analysed between tree components.
| Component | Carbon content (%) | |||
|---|---|---|---|---|
| Min | Max | Mean | Std. error | |
| Leaves | 49.18 | 50.83 | 50.20 a | 0.20 |
| Branches | 45.72 | 47.94 | 46.61 b | 0.22 |
| Dead branches | 46.12 | 49.04 | 47.22 b | 0.32 |
| Wood | 45.61 | 48.08 | 46.69 b | 0.28 |
| Bark | 43.48 | 46.55 | 44.70 c | 0.28 |
Other studies for E. nitens in northwest Spain have obtained higher mean values of C. For example, Pérez-Cruzado et al. ([40]) found levels from 46.9 to 57.2 % for above-ground tree components and 50.1 % specifically for wood, and Pérez et al. ([43]) obtained results of 53.12 % for wood and 50.99 % for the other components. For E. globulus in the same region a higher value for leaves (53.1 %) but similar values for wood (46.5 %), bark (43.1 %) and branches (46.5 %) have been found ([7]).
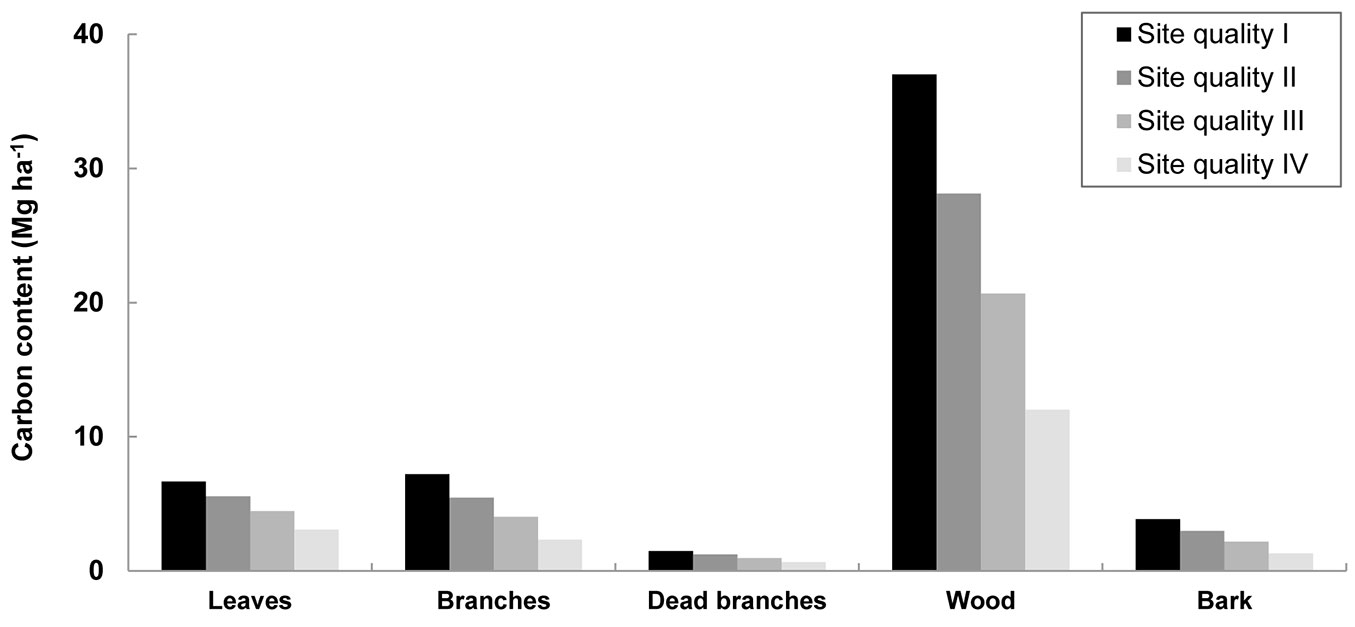
Carbon sequestration in biomass was estimated at stand level according to site quality (Fig. 4). The wood component had the highest carbon content (12-37 Mg ha-1), since it comprises the largest portion of the biomass, followed by leaves and branches. Total carbon capture was 19-56 Mg ha-1 at the end of the rotation, and 2-9 Mg ha-1 y-1 when the rotation length was taken into account. Other studies for E. nitens stands with stockings of 1600 and 2400 stems ha-1 obtained higher estimations of 12.7 and 13.5 Mg C ha-1 y-1, respectively, in longer rotations of 11-12 years taking into account litter and above-ground biomass ([40]). The large difference between the results obtained in this study and the values of Pérez-Cruzado et al. ([40]) can be attributed to the far younger age of the plantations studied here.
Fig. 4 - Carbon content in bioenergy plantations according to site quality at the end of the rotation. Site quality, defined by site index (base age of 4 years), was projected using the growth models and the biomass equations developed for E. nitens woody crops ([18], [20]). Above-ground biomass is on dry weight.
Energy evaluation
Tab. 8 shows the results of the energy evaluation for the wood component in this study and the reference rates for the other biomass tree components according to Pérez et al. (2006, 2008, 2011). Stemwood showed constant results for calorific values, with an average of 19.54 and 18.32 MJ kg-1 for GCV and NCV respectively. This low variability in the heating value of wood is due to the great uniformity in its composition, while this is not the case for other components, such as bark and leaves, which are more heterogeneous ([47]). The heating values found in the current work are similar to those obtained for young plantations of E. nitens in a neighbouring region, where GCV was found to be 18.6 MJ kg-1 for wood with a moisture content of between 0 and 5 % ([42]) and in other Eucalyptus studies for wood (ranging from 18.8-19.5 MJ kg-1) ([16], [14]). However, they are higher than results for poplar and willow short rotation woody crops, where GCV was found to be 17.3 and 18.7 MJ kg-1 respectively ([29]).
Tab. 8 - Results of elemental and proximate analyses, and determination of calorific value (17 samples). (VM): Volatile Matter; (FC): Fixed Carbon; (GCV): Gross Calorific Value; (NCV): Net Calorific Value. The estimations for wood relate to dry biomass. (a): average data derived from Pérez et al. ([43], [41], [42]) with 0-50 % moisture content, including adults and young trees; (*): determined by difference.
| Component | Variable | Min. | Max. | Mean | Std. Dev. |
|---|---|---|---|---|---|
| Wood | C (%) | 48.57 | 49.75 | 49.15 | 0.38 |
| H (%) | 5.70 | 6.13 | 5.93 | 0.09 | |
| N (%) | 0.35 | 0.50 | 0.44 | 0.04 | |
| S (%) | 0.01 | 0.04 | 0.02 | 0.01 | |
| O (%) | 43.28 | 44.88 | 44.20 | 0.44 | |
| Ash (%) | 0.48 | 1.13 | 0.76 | 0.19 | |
| VM (%) | 79.14 | 80.80 | 80.07 | 0.51 | |
| FC* (%) | 18.51 | 19.79 | 19.18 | 0.42 | |
| GCV (MJ kg-1) | 19.22 | 19.86 | 19.54 | 0.18 | |
| NCV (MJ kg-1) | 18.00 | 18.68 | 18.32 | 0.19 | |
| Leaves(a) | GCV (MJ kg-1) | 10.48 | 22.55 | - | - |
| Branches(a) | GCV (MJ kg-1) | 8.92 | 18.64 | - | - |
| Bark(a) | GCV (MJ kg-1) | 7.00 | 19.94 | - | - |
In a study analysing the residual biomass of E. globulus in the same region as this work, NCV was 7.2 MJ kg-1 for a mixture of leaves (57%), thin branches (25%) and thick branches (18%) ([35]). Additionally, in another residual biomass study of several species, Eucalyptus was found to have the highest values (GCV: 18.4 MJ kg-1; NCV: 17.1 MJ kg-1), with leaves and bark showing the highest and the lowest GCV respectively ([41]). Leaves of E. nitens were also found to be the component with the highest heating value, an average GCV of 22.6 MJ kg-1, in another study ([47]).
The results of element analysis (Tab. 8) showed there to be little variation in composition between samples, thereby corroborating the low variability in heating value ([24]). The fact that the percentage of N (< 0.5 %) and S (< 0.04 %) found in the species is low in comparison with fossil fuels ([29]) is obviously of environmental importance.
In the combustion process, first Volatile Matter (VM) is burnt off as gas leaving behind the Fixed Carbon (FC) as char, which later burns in the solid state. VM and FC values in this work were 79.14-80.80 % and 18.51-19.79 %, respectively. The low value of fixed carbon content found here can be attributed to the high VM, and illustrates that the bulk of the woodfuel material was consumed in the gaseous state during combustion ([47]). The VM values found were lower than those obtained by Senelwa & Sims ([47]) for this species in 3 year rotations (91.9 %), although the FC values in the present work were above those found by these authors (6.9 %).
Ash content in this study ranged from 0.5 to 1.1 % for the stemwood component (average 0.76 %), values in line with the those established for woody species ([47], [24], [48]), which are considerably lower than for herbaceous species ([22], [29]). The average percentage of ash is lower in E. nitens than in other Eucalyptus species such as E. globulus ([47], [43], [42]) resulting in two advantages: a lower quantity of nutrients needs to be provided to the soil, and less maintenance required in boilers.
Conclusions
This study presents a nutritional, carbon and energy analysis of E. nitens bioenergy plantations in order to promote sustainable forest management.
Leaves and bark were the components with the highest nutrient concentration, except in the case of Ca, where bark and dead branches were the principal components. The nutritional state of the stands showed high levels of P, which may be associated with soil fertilization, and a clear Mg deficiency. Stemwood was the main tree component at the end of the rotation and the fraction with the highest content per hectare of P, K, Mg and Na, while N and Ca were stored mainly in leaves and bark, respectively.
All the tree components were fairly consistent with respect to C content. Leaves had the highest C concentration although wood, as in the nutrient analysis, had the largest quantity. Mean C content in above-ground biomass was 2-9 Mg C ha-1 y-1, depending on forest productivity.
Stemwood showed consistent NCV (18.32 MJ kg-1) with low ash content.
Acknowledgements
The authors are especially grateful to “ENCE (Energía & Celulosa)” for agreeing to data being collected from the company’s plantations. We also acknowledge the collaboration of CETEMAS and SERIDA field workers. We wish to thank Ms Rosa Calvo de Anta (Departamento de Edafología y Química Agrícola, Facultad de Biología, Universidad de Santiago de Compostela, Spain) for the nutritional analysis and her suggestions on the manuscript. We also thank Ronnie Lendrum for revising the English of the manuscript. Marta González-García was supported by Plan de Ciencia Tecnología e Innovación del Gobierno del Principado de Asturias (PCTI) through the PhD research grant “Severo Ochoa”.
References
Gscholar
Gscholar
Gscholar
Gscholar
Gscholar
Gscholar
Gscholar
Gscholar
Gscholar
Gscholar
Gscholar
Gscholar
Gscholar
CrossRef | Gscholar
Gscholar
Online | Gscholar
Gscholar
Authors’ Info
Authors’ Affiliation
Andrea Hevia
Juan Majada
Forest and Wood Technology Research Centre (CETEMAS), E-33820 Grado (Spain)
Instituto Nacional del Carbon (INCAR-CSIC), Apartado 73, E-33080 Oviedo (Spain)
Department of Organisms and Systems Biology, Polytechnic School of Mieres, University of Oviedo, E-33600 Mieres (Spain)
Corresponding author
Paper Info
Citation
González-García M, Hevia A, Majada J, Rubiera F, Barrio-Anta M (2015). Nutritional, carbon and energy evaluation of Eucalyptus nitens short rotation bioenergy plantations in northwestern Spain. iForest 9: 303-310. - doi: 10.3832/ifor1505-008
Academic Editor
Gianfranco Minotta
Paper history
Received: Nov 19, 2014
Accepted: May 18, 2015
First online: Oct 05, 2015
Publication Date: Apr 26, 2016
Publication Time: 4.67 months
Copyright Information
© SISEF - The Italian Society of Silviculture and Forest Ecology 2015
Open Access
This article is distributed under the terms of the Creative Commons Attribution-Non Commercial 4.0 International (https://creativecommons.org/licenses/by-nc/4.0/), which permits unrestricted use, distribution, and reproduction in any medium, provided you give appropriate credit to the original author(s) and the source, provide a link to the Creative Commons license, and indicate if changes were made.

Web Metrics
Breakdown by View Type
Article Usage
Total Article Views: 53623
(from publication date up to now)
Breakdown by View Type
HTML Page Views: 44343
Abstract Page Views: 3804
PDF Downloads: 4088
Citation/Reference Downloads: 20
XML Downloads: 1368
Web Metrics
Days since publication: 3875
Overall contacts: 53623
Avg. contacts per week: 96.87
Article Citations
Article citations are based on data periodically collected from the Clarivate Web of Science web site
(last update: Mar 2025)
Total number of cites (since 2016): 17
Average cites per year: 1.70
Publication Metrics
by Dimensions ©
Articles citing this article
List of the papers citing this article based on CrossRef Cited-by.
Related Contents
iForest Similar Articles
Research Articles
Energy production of poplar clones and their energy use efficiency
vol. 7, pp. 150-155 (online: 23 January 2014)
Research Articles
Interaction between planting spacing and wood properties of Eucalyptus clones grown in short rotation
vol. 14, pp. 12-17 (online: 02 January 2021)
Research Articles
Carbon emission reduction potentials through thinned wood in Japan
vol. 4, pp. 107-112 (online: 01 June 2011)
Research Articles
Comparison of alternative harvesting systems for selective thinning in a Mediterranean pine afforestation (Pinus halepensis Mill.) for bioenergy use
vol. 14, pp. 465-472 (online: 16 October 2021)
Research Articles
Variation of wood and bark density and production in coppiced Eucalyptus globulus trees in a second rotation
vol. 9, pp. 270-275 (online: 08 September 2015)
Research Articles
Impact of rotation length of Eucalyptus globulus Labill. on wood production, kraft pulping, and forest value
vol. 15, pp. 433-443 (online: 20 October 2022)
Research Articles
Validation of models using near-infrared spectroscopy to estimate basic density and chemical composition of Eucalyptus wood
vol. 17, pp. 338-345 (online: 03 November 2024)
Research Articles
First vs. second rotation of a poplar short rotation coppice: leaf area development, light interception and radiation use efficiency
vol. 8, pp. 565-573 (online: 27 April 2015)
Review Papers
Carbon neutrality of forest biomass for bioenergy: a scoping review
vol. 16, pp. 70-77 (online: 05 March 2023)
Research Articles
Potential for utilization of wood ash on coastal arenosols with limited buffer capacity in KwaZulu-Natal and its effect on eucalypt stand nutrition and growth
vol. 10, pp. 180-188 (online: 19 November 2016)
iForest Database Search
Search By Author
Search By Keyword
Google Scholar Search
Citing Articles
Search By Author
Search By Keywords
PubMed Search
Search By Author
Search By Keyword


