
Soil respiration and carbon balance in a Moso bamboo (Phyllostachys heterocycla (Carr.) Mitford cv. Pubescens) forest in subtropical China
iForest - Biogeosciences and Forestry, Volume 8, Issue 5, Pages 606-614 (2015)
doi: https://doi.org/10.3832/ifor1360-007
Published: Feb 02, 2015 - Copyright © 2015 SISEF
Research Articles
Abstract
Understanding spatial and temporal variation in soil respiration (RS) in different forest ecosystems is crucial to estimate the global carbon balance. Bamboo forest is a special forest type in southern China covering an area of 5.38 million ha, 70% of which are Moso bamboo (Phyllostachys heterocycla (Carr.) Mitford cv. Pubescens) forests. Bamboo forests contribute more than 10% to the whole carbon stock of forest ecosystems in China, and therefore play a critical role in the regional and national carbon balance. However, little information on the seasonal dynamic of RS and the carbon balance of Moso bamboo forests is available. In this study, litter removal and trenching methods were applied to partition RS into root respiration (RR), litter respiration (RL) and soil organic matter derived respiration (RM), and to study their seasonal dynamics and carbon balance in a pure Moso bamboo forest. Monthly RS, its source components and combined monthly environmental factors were measured. RS and its source components showed a significant seasonal variability with higher values from June to August and lower values from December to February driven by soil temperature and moisture (P < 0.001). Annual average RS, RR, RL and RM were 2.37, 0.69, 0.58 and 1.10 μmol m-2 s-1 with Q10 values of 1.25, 1.15, 1.19 and 1.26, respectively. Annual RS was 8.97 t C ha-1, and RR, RL and RM contributed 29%, 22% and 49%, respectively. Annual NEP was 4.72 t C ha-1 y-1, indicating that the Moso bamboo forest studied is a significant carbon sink.
Keywords
Soil Respiration, Source Components, Soil Temperature, Soil Moisture, Net Ecosystem Production
Introduction
Forest ecosystems can be carbon sinks or sources depending on the balance between carbon input through photosynthesis and release from respiration ([54]). In forest ecosystems, soil respiration (RS) can account for 30% to 80% of the whole ecosystem respiration ([13], [36], [14]). Globally, RS is the second largest carbon exchange between the soil and atmosphere, and returns as much as 80 to 98 Pg C yr-1 back into the atmosphere ([2], [50]), which is more than 10 times the carbon release from fossil fuel combustion ([25]). Therefore, RS is one of the major contributors to the carbon balance, and small changes in RS rate could give rise to significant changes in atmospheric CO2 concentration, leading to feedbacks to climate change ([52]). Although the significance of RS for carbon balance on a regional and even the global scale has been demonstrated, there is still much to understand about biotic or abiotic controllers of RS and its source components ([20]). For example, partitioning RS is still challenging because of remarkable soil disturbances ([21], [60]). Spatial and temporal variability in RS are often reported due to high variations in forest types, stand ages and management practices ([32], [59], [54], [66], [47]). This has limited our ability to accurately predict the responses of RS and carbon balance to current and future climate change ([52]). Therefore, measuring RS in different forest types has been proven to be increasingly important to accurately predict global carbon cycles and its responses to climate change ([66]).
RS is overwhelmingly comprised of rhizoshperic respiration (respiration from roots, mycorrhizae and microbial respiration in the rhizosphere) and heterotrophic respiration (respiration by microbial organisms and soil fauna - [3], [64]). Quantifying RS and the contributions of its components are essential to understand and model global carbon cycling ([64]). However, partitioning RS is still difficult ([21]). Attempts have been done to partition RS using different approaches, such as component integration by removing roots directly from the soil ([17]), isotopic signal detection techniques ([34]), root exclusion by trenching in a subplot to prevent root ingrowth and eliminating root growth and respiration ([21]). Trenching is the approach more widely used in forest ecosystems ([21]). However, trenching increases the residual decomposition of remaining roots ([38]), increases soil moisture due to the absence of water uptake by roots in trenched plots ([21]) and may change substrate supply for microbial respiration and microbial populations ([23], [38]). The artificially introduced bias or modifications in the trenching plots must be quantified in order to precisely estimate the carbon cycle in forest ecosystems ([57]).
Soil temperature and moisture are the main controllers of RS and have received great attentions ([12], [51]). The relationships between RS and soil temperature are generally modeled as exponential functions ([54], [72]). In contrast, equations used to model the relationship between RS and soil moisture either assume asymptotic RS values for high soil moisture or a maximum RS at an optimized soil moisture ([13], [18]). However, strong variability in RS does not correlate with soil temperature or moisture in a predicable manner ([63], [59]). For example, some researchers conclude that soil moisture has significant effects on RS ([51], [58]), while others report only minimal effects ([50]) or no effect at all ([47]). Biological drivers, such as photosynthesis, have been recognized as key drivers of rhizospheric respiration ([27], [33]). However, the fact has been overlooked in most RS studies because RS is highly related with soil temperature or water content, which could mask the direct effects of photosynthesis on RS ([33]). Therefore, it is still unclear how the relationships between RS components change with environmental factors, biological drivers and vegetation types, and obviously more measurement data on RS components from across various climate zones and different vegetation types are required to improve our understanding of RS and its components ([4]).
Bamboo forest is an important forest type in southern China and has expanded very rapidly in recent decades. According to the seventh National Forest Inventory data, bamboo forest covered an area of 5.38 million hectares in 2009 with an increasing trend, 70% of which was Moso bamboo forests ([28]). The carbon stock in bamboo forests contributes by more than 10% of the carbon stock in forest ecosystems in China ([10]). Thus, bamboo forests play a critical role in the regional, national, and even global carbon balance ([61]). Two recent publications have been done on RS in Moso bamboo forest ([70], [42]), however they applied different methods to measure RS, which makes comparisons difficult. Quantifying RS and its source components in Moso bamboo forest is critical for evaluating the role of these forests in carbon cycling and climatic systems.
The objectives of this study were: (1) to evaluate seasonal dynamics of RS and its source components; (2) to qualify the contributions of source components to total RS; (3) to evaluate the relationship between RS, its source components and environmental factors; and (4) to assess whether Moso bamboo forest could act as a carbon sink or source under climate change.
Materials and methods
Site description
The experimental site is located in Dingmushan forest station in Chibi city (29° 28′ to 29° 55′ N, 113° 32′ to 114° 13′ E), Hubei province, China. This area has a typical subtropical monsoon climate. The average precipitation is 1251-1608 mm yr-1, mainly distributed between May and August (accounting for 51.5% of the total rainfall). The maximum precipitation was 2678 mm in 1954 and minimum precipitation was 910 mm in 1968. The mean annual temperature is 16.9 °C with the highest temperature in July and the lowest temperature in January. The number of frost free days is 247-261.
The Moso bamboo forests were planted in the 1960s in China, and most are currently pure bamboo forests with small shrubs and herbs, and understory species such as Lirildendron chinense Hemsl., Rhus chinensis Mill., Loropetalum Chinense (R. Br.) Oliv., Smilax glabra Roxb., Castanea seguinii Dode., Castanopsis tibetana Hance and Castanopsis tessellata Hick. et A. Camus, etc. More details of the site conditions and soil characteristics are shown in Tab. 1.
Tab. 1 - Main characteristics of the plots in the investigated Moso bamboo forest in Chibi city from April 2011 to March 2012.
| Variable | Values |
|---|---|
| Average elevation (m) | 161 |
| Slope (°) | 16 |
| Average height (m) | 11.1 |
| Average Diameter (cm) | 8.2 |
| Average density (stems ha-1) | 2908 |
| Soil bulk density (g cm-3) | 1.28 |
| Total porosity (%) | 45.21 |
| Root depth (cm) | 0-40 |
| SOM content (g kg-1) | 26.41 |
| Total N (g kg-1) | 1.33 |
| Total K (g kg-1) | 9.68 |
| Available K (mg kg-1) | 58.77 |
| Total P (g kg-1) | 0.32 |
| Available P (mg kg-1) | 11.68 |
Experimental design
In March 2011, three 20 × 20 m plots (representing the average conditions of bamboo growth in the area in terms of slope, density and soil depth) were established in an unmanaged Moso bamboo forest. The distance between each plot was less than 1 km, which avoided differences in climate and soil types. In each plot, 10 transparent polyvinyl chloride collars (PVC, 20 cm inside diameter, 12 cm in height) were inserted into the soil at a depth of 3 cm ([41]). Once installed, collars were not moved all over the study period. The collars were divided into three groups: intact soil (IS), litter-free soil (LS) and trenched soil (TS).
Firstly, four collars were inserted 5 m away from the plot center along a diagonal transect into IS to measure the total RS. Secondly, 50 cm apart from IS collars, litter was removed from the soil surface (25 cm radius circle) and four collars were inserted into LS. The CO2 flux measured on LS was considered as RS without CO2 flux derived from the litter. This litter-free RS was defined as RC. The difference between RS and RC was considered to be litter respiration (RL): RL = RS - RC.
Third, trenching was performed in early March 2011. In each plot center, a subplot with a size of 80 × 80 cm was established and trenched to a depth of 80 cm. After that, vegetation and litter were removed with care to minimize soil disturbance, and the subplots were kept free of live vegetation and litter throughout the study period. Since most of the bamboo roots were distributed within 40 cm of the surface, trenching to 80 cm was sufficient to achieve the objectives of this research. Polyethylene boards with a thickness of 0.5 cm were inserted into the trenches vertically to prevent root ingrowth after trenching. The CO2 flux from these trenched subplots was considered as the CO2 flux derived from the soil organic matter (RM). Therefore, root respiration (RR) could be calculated as RR = RC - RM.
RS, soil temperature and soil moisture measurement
Four weeks after trenching, RS was measured using a LI-Cor-8100 (Li-Cor Inc., Lincoln, NE, USA) automated soil CO2 flux system from April 2011 to March 2012. The soil CO2 efflux was calculated based on a linear increase in chamber CO2 concentrations over time. The RS was expressed by μmol m-2 s-1. Measurements were carried out between 9:00 a.m. and 12:00 a.m. because the respiration rate during that period represents the diurnal average ([68]). RS in rainy days was not measured. Soil temperature and moisture near the collars at a depth of 5 cm were measured using the soil temperature and moisture sensors of the LI-Cor-8100 while measuring the CO2 flux over the entire study period.
Carbon stock in bamboo
In May 2011, bamboos with a diameter at breast height (DBH, cm) larger than 5 cm were measured (only bamboos larger than 5 cm were accounted in carbon stock estimation - [76]). The aboveground biomass of individual bamboo stems was estimated using the eqn. 1 reported below ([77]). For simplicity, 0.5 was used as carbon concentration to convert biomass to carbon ([75]). The belowground carbon was measured by the ratio 0.2 of aboveground/belowground carbon stock ([11] - eqn. 1).
where A is the age expressed in du ([77]). One “du” stands for 1-2 years, and therefore 2, 3 and 4 “du” correspond age 3-4, 5-6 and 7-8 years, respectively.
Carbon stock in understory and litter
Understory was harvested by uprooting in three 1 × 1 m subplots in each plot. All samples were washed in floating water. Monthly litter input was collected by 1 × 1 m collectors (n = 3) for each plot. All understory samples and litter were dried to constant weight at 65 °C. The subplots for understory and collectors for litter input were set in a similar equilateral triangle shape in each plot. The carbon concentration to convert biomass to carbon was assumed to be 0.5. Since most of understory species were annual plants, the standing stock was used to represent the annual growth.
Data analysis and annual RS
Data analysis was conducted using the software package SPSS® v.16.0 and Microsoft Excel® 2003. First, RS, soil temperature and moisture from four collars (two collars for RM) were averaged over each plot. Repeated measures analysis of variance (RM ANOVA) and least significant difference (LSD) were applied to test the seasonality of RS, soil temperature and moisture with α = 0.05. Regression analysis was used to model the relationships between respiration rates and soil temperature and moisture. Standard errors were calculated over the 3 plots considered and represent the spatial variation in respiration rates among plots. Both one-factor and two-factor models were conducted to model the relationship between RS and soil temperature and moisture ([40] - eqn. 2, eqn. 3, eqn. 4):
where RS is the measured monthly RS rate or its component respiration rates (μmol m-2 s-1), T (°C) and W (%) are the measured soil temperature and moisture at 5 cm depth, respectively, and a, b and c are the fitting parameters.
Temperature sensitivity (Q10), which is related to the increase of RS rate at 10 °C intervals, was calculated as RST+10/RST; RST is a regression model in the form of eqn. 2 or eqn. 4 related soil temperature. In most cases, Q10 was derived from a one-factor regression model (eqn. 3 - [16], [51]). However, the one-factor regression model could not well reveal the RS and soil temperature, and the Q10 changed with soil temperature and soil moisture ([14]). Therefore, a two-factor regression model were developed to estimate Q10 (eqn. 5):
where a and b were taken from eqn. 4.
Net ecosystem production (NEP)
The annual carbon flux of RS and source components were calculated as follows (eqn. 6):
where RA is the annual carbon flux of RS and its components (g C m-2 ha-1 y-1); Ri is the mean monthly respiration rates of RS and its components (μmol m-2 s-1); 10-6 is the unit conversion from 1 μmol to 1 mol; 12/44 is the conversion from CO2 to C; 1 day = 3600 × 24 s; 30·(29/31) are the days of each month.
The net ecosystem production was calculated using the following equation ([43] - eqn. 7):
where NPP is the net primary production (t C m-2 ha-1 y-1), which was obtained as the annual increase in total woody biomass plus annual litterfall and vegetation, RRA and RSA are the annual carbon flux (t C m-2 ha-1 y-1) of RR and RS, respectively.
Results
Seasonal variability in soil temperature and soil moisture
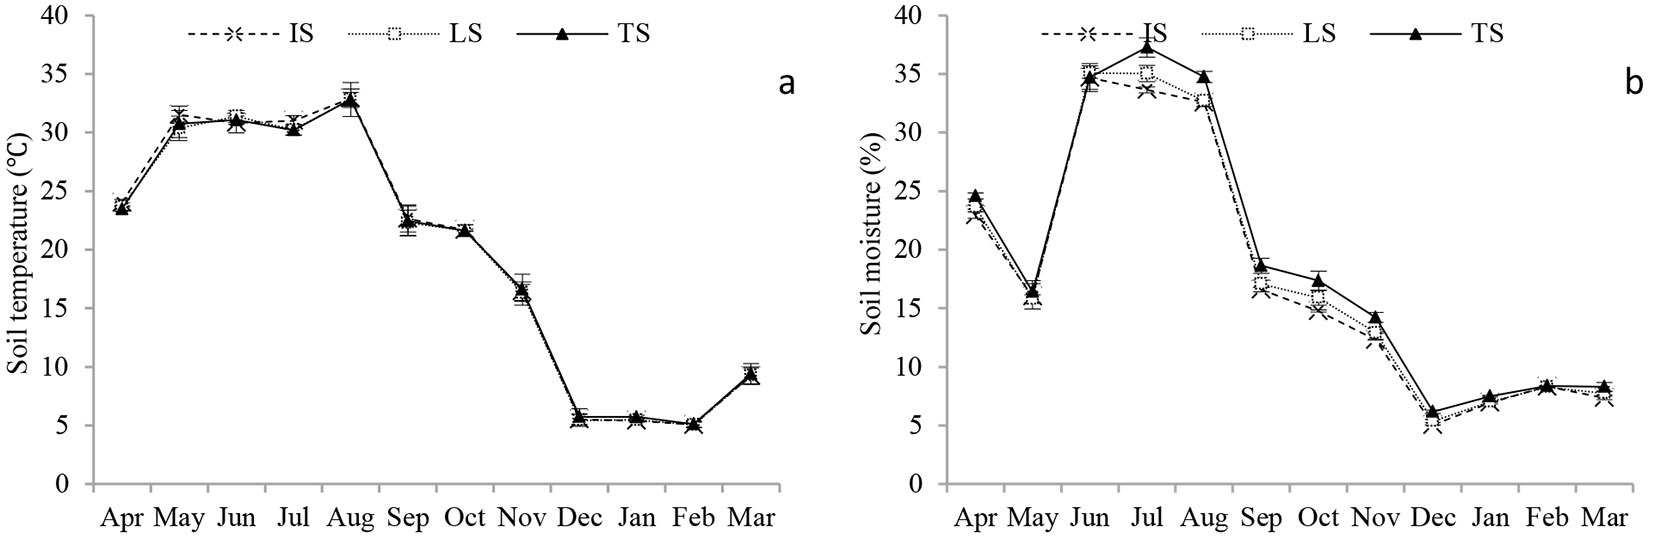
Fig. 1 showed the seasonal changes in soil moisture, soil temperature of IS, LS and TS. Soil temperature showed significant seasonal variability (P < 0.001) ranging from 5.0 °C in February in TS to 32.9 °C in August in LS. Mean annual soil temperature was 19.7 °C, 19.5 °C and 19.6 °C for IS, LS and TS, respectively, with no significant differences among groups (P > 0.05). Similarly, soil moisture ranged from 5.5% in December in IS to 35.3% in July in TS with significant seasonal variability (P < 0.001). Soil moisture decreased in May due to a short drought period, and then increased significantly, starting to decrease again after August. However, soil moisture in TS was significantly higher than that in IS and LS (P < 0.05), though no significant difference in the soil moisture were detected between IS and LS (P > 0.05). The annual moisture was 17.6%, 18.0% and 19.0% for IS, LS and TS, respectively.
Fig. 1 - Seasonal changes of (a) soil temperature (T, °C) and (b) soil moisture (W, %) at depth of 5 cm in the Moso bamboo forest in Chibi city from April 2011 to March 2012. IS, LS and TS represent intact soil, litter-free soil and trenched soil, respectively. Error bars represent the standard error (n=3).
Seasonal variability in RS
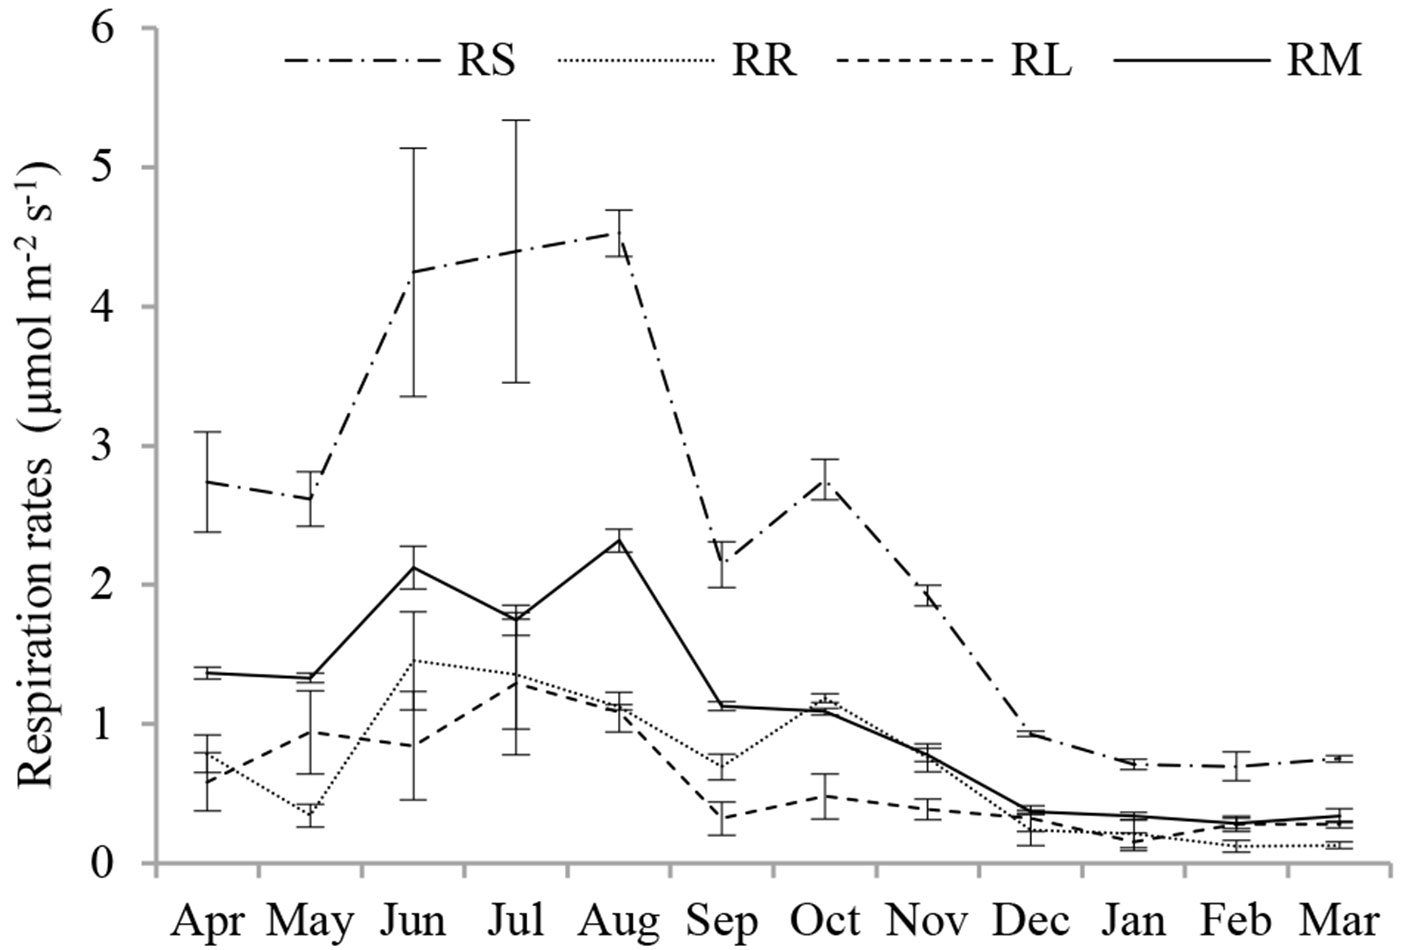
A significant seasonality in RS and its source components (P < 0.001) was observed over the study period (Fig. 2). RS, RR, RL and RM increased from spring to their maximum rates in summer, reaching values of 4.53, 1.46, 1.29 and 2.31 μmol m-2 s-1, respectively. Respiration rates then declined smoothly from autumn to winter, except RR in October, and reached minimum values of 0.70, 0.12, 0.15 and 0.28 μmol m-2 s-1, respectively. The average annual RS, RR, RL and RM rates were 2.37, 0.69, 0.58 and 1.10 μmol m-2 s-1, respectively. However, the various source components did not reach their maximum or minimum values synchronously.
Fig. 2 - Seasonal variation in contributions of RR, RL and RM to RS in the Moso bamboo forest in Chibi city from April 2011 to March 2012. RS, RR, RL and RM represent total soil respiration, root respiration, litter respiration and soil organic matter derived respiration, respectively. Error bars represent the standard error (n=3).
Contributions of source components to total RS
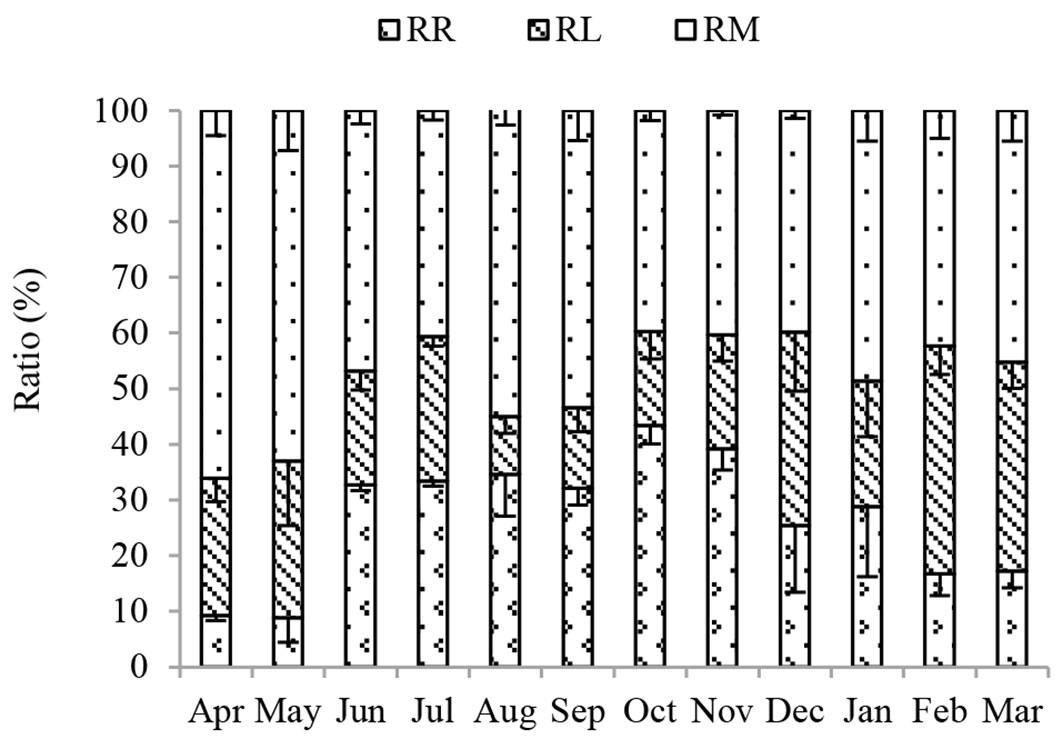
Annual contributions of RR, RL and RM to RS were 29%, 22% and 49% over the whole study period (Fig. 3). The contribution of RM was relatively stable at about 50% of RS, except in April and May. RR represented as much as 43% of RS in October, but only 13% in May, while contributions of RL to RS ranged from 15% to 41%. Noticeably, the contribution of RM to RS was always higher (except in October) than that of RR and RL.
Fig. 3 - Seasonal dynamics of the contributions of RR, RL and RM to RS in the Moso bamboo forest in Chibi city from April 2011 to March 2012. RS, RR, RL and RM represent total soil respiration, root respiration, litter respiration and soil organic matter derived respiration, respectively. Error bars represent the standard error (n=3).
Relationships between RS and soil temperature and soil moisture
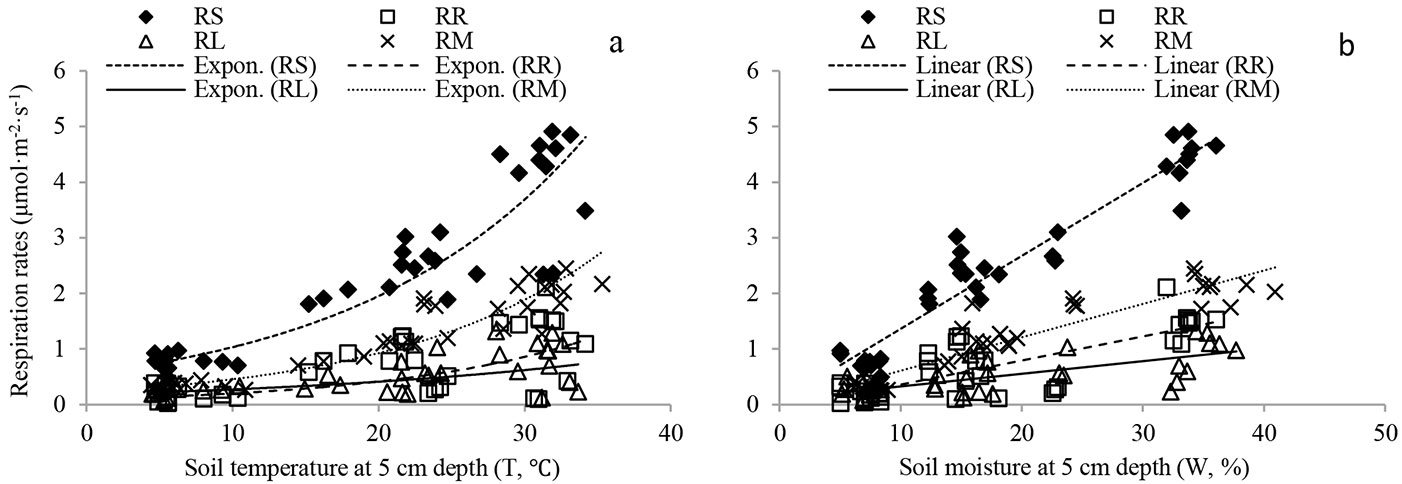
RS and source components were exponentially related to soil temperature (Fig. 4a, Tab. 2). Soil temperature explained 46-93% of the total variation in RS and its source components. Positive linear correlations were found between respiration rates and soil moisture (Fig. 4b, Tab. 2). Soil moisture accounted for 41-89% of the total variation in RS and its source components.
Fig. 4 - Relationship between RS and its source components and: (a) soil temperature at 5 cm depth (T, °C); (b) soil moisture (W, %) at depth of 5 cm in the Moso bamboo forest in Chibi city from April 2011 to March 2012. RS, RR, RL and RM represent total soil respiration, root respiration, litter respiration and soil organic matter derived respiration, respectively. Fitting parameters are reported in Tab. 2.
Tab. 2 - Fitted parameters of: (a) the exponential relationship between soil respiration (μmol m-2 s-1) and soil temperature (°C - RS = aebT); (b) the linear relationship between soil respiration and soil moisture (% - RS = aW + b); (c) bivariate models of soil temperature and moisture (RS = aWT + b) for different source components. RS, RR, RL and RM represent total soil respiration, root respiration, litter respiration and soil organic matter derived respiration, respectively.
| Group | Components | a | b | R2 | n | Prob | Q 10 |
|---|---|---|---|---|---|---|---|
| (a) | RS | 0.555 | 0.062 | 0.862 | 36 | <0.001 | - |
| RR | 0.099 | 0.076 | 0.510 | 36 | <0.001 | - | |
| RL | 0.161 | 0.050 | 0.456 | 36 | <0.001 | - | |
| RM | 0.224 | 0.069 | 0.925 | 36 | <0.001 | - | |
| (b) | RS | 0.127 | 0.140 | 0.778 | 36 | <0.001 | - |
| RR | 0.036 | 0.047 | 0.553 | 36 | <0.001 | - | |
| RL | 0.029 | 0.060 | 0.410 | 36 | <0.001 | - | |
| RM | 0.059 | -0.026 | 0.890 | 36 | <0.001 | - | |
| (c) | RS | 3.452×10⁻³ | 0.847 | 0.915 | 36 | <0.001 | 1.25 |
| RR | 1.124×10⁻³ | 0.193 | 0.588 | 36 | <0.001 | 1.15 | |
| RL | 0.585×10⁻³ | 0.249 | 0.446 | 36 | <0.001 | 1.19 | |
| RM | 1.587×10⁻³ | 0.406 | 0.869 | 36 | <0.001 | 1.26 |
Two-factor models were applied to analyze the co-effect of soil temperature and moisture on RS. The interaction of soil temperature and moisture explained 45-92% of the total variation in RS and its source components (Tab. 2). Temperature sensitivity (Q10) values of RS, RR, RL and RM (calculated from monthly changes in respiration rates and temperature) were 1.25, 1.15, 1.19 and 1.26, respectively. The Q10 value of RM was the highest, while the Q10 value of RR was the lowest.
Carbon balance
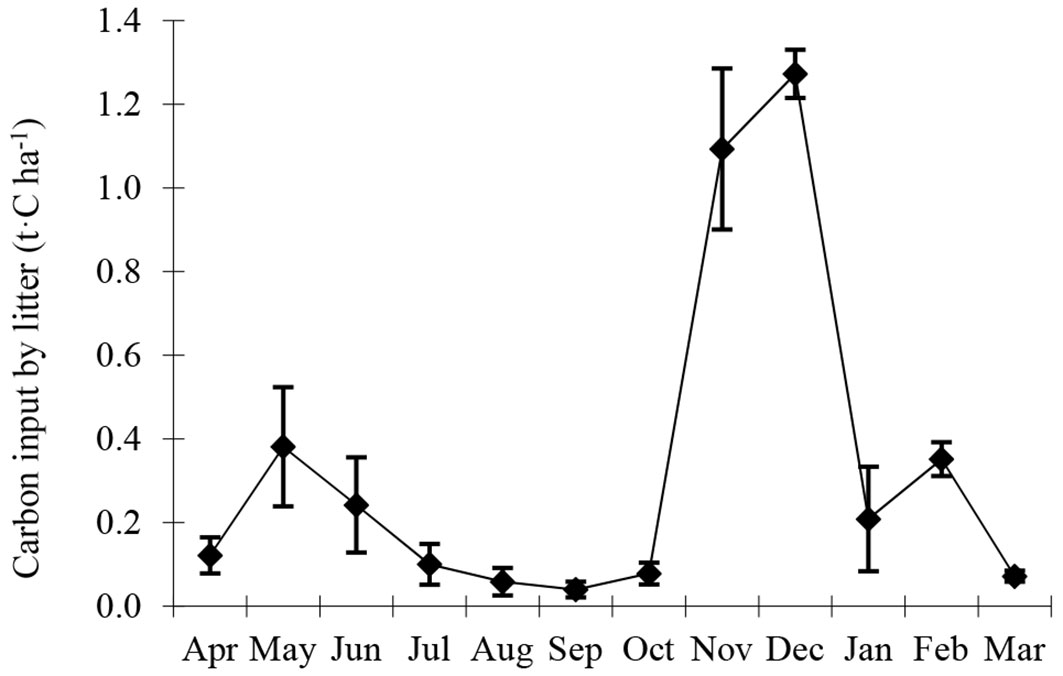
Significant seasonal variability (P < 0.001) was observed in carbon input by litter (Fig. 5). Carbon input by litter was lowest in September (0.04 t C ha-1) and peaked in December (1.27 t C ha-1), with a monthly average of 0.33 t C ha-1. Annual RM was the highest among source components with 4.41 t C ha-1 y-1 while annual RL was the lowest with 1.95 t C ha-1 y-1. More than 95% of carbon input by bamboo was from 1 du bamboos, and this changed little as age increased (Tab. 3). Annual carbon input from litter and vegetation were 4.02 and 0.69 t C ha-1 y-1, respectively. NEP was 4.72 t C ha-1 y-1, indicating that the Moso bamboo forest acted as a carbon sink.
Fig. 5 - Seasonal variability of carbon input by litter (t C ha-1) at the Moso bamboo forest in Chibi city from April 2011 to March 2012.
Tab. 3 - Various components of ecosystem carbon flux in the Moso bamboo forest in Chibi city from April 2011 to March 2012 (t C ha-1 y-1). RS, RR, RL and RM represent total soil respiration, root respiration, litter respiration and soil organic matter derived respiration, respectively.
| Parameter | Value |
|---|---|
| RS | 8.97 ± 0.17 |
| RR | 2.61 ± 0.10 |
| RL | 1.95 ± 0.09 |
| RM | 4.41 ± 0.05 |
| Age 1 (du) | 6.26 ± 0.11 |
| Age 2 | 0.07 ± 0.03 |
| Age ≥ 3 | 0.04 ± 0.01 |
| Litter | 4.02 ± 0.20 |
| Understory | 0.69 ± 0.07 |
| NEP | 4.72 |
Discussion
Annual variability RS
RS showed a noticeable seasonality, and had an annual average rate of 2.37 μmol m-2 s-1, which was within the range reported for Chinese forest ecosystems (0.62-7.98 μmol m-2 s-1 - [9]). However, the rate observed in this study was higher than that reported for evergreen broadleaved forests (1.63 μmol m-2 s-1), mixed evergreen and deciduous broadleaved forests (1.79 μmol m-2 s-1), deciduous broadleaved forests (1.74 μmol m-2 s-1) and sub-alpine coniferous forests (1.35 μmol m-2 s-1) of the Shennongjia Forest Region, which is 500 km away from our study area in the same climate zone ([44]). On the other hand, the observed annual RS rate was lower than that reported for the Moso bamboo forest of the Tianmu Mountain, Zhejiang province (3.82 μmol m-2 s-1 - [56]), and for the Wangmuling natural reserve in the Fujian province (3.65 μmol m-2 s-1 - [68]).
The factors contributing to the variability of RS among different forest ecosystems were complex. Likely, a major reason is the carbon availability from photosynthesis to RS ([52]). Vegetation structure and species composition may strongly influence carbon allocation patterns ([65]). Increases of carbon transfer from aboveground to belowground due to a longer photosynthesis period in evergreen pine plantations increase root biomass and RS as compared with deciduous larch plantations, but have no influence on heterotrophic respiration ([64]). It has been proved that higher NPP in the Moso bamboo forest caused 1.89 times higher RS than that of Chinese fir stands in the same study area ([69]). A second potential reason may be the belowground dynamics, since RS is strongly related with root biomass and root nitrogen concentration ([7], [66]). Soil organic carbon (SOC) concentration, especially the newly labile SOC produced by litter, may be a third potential factors affecting the RS variability. The Moso bamboo forest produced less readily decomposable litter than Chinese fir stands ([69]), and broad-leaved forest ([35]). A fourth reason might be attributable to differences in temperature, which becomes a major control of RS at regional level ([49], [67]). The temperature dependence of RS varies across forest ecosystems, though RS is controlled by soil temperature at a regional scale, as demonstrated by many studies ([19], [51], [61], [68]). Indeed, the Moso bamboo forest in the Hu’nan province with lower annual temperature showed lower RS rates as compared with this study (16.5 vs. 19.6 °C - [19]), while the Moso bamboo forest in the Fujian province had higher RS rate (19.6 vs. 22.5 °C - [68]).
Contribution of source components to RS
In this study, a large range in the contribution of RR to RS has been reported (10-90% - [21]). Such variability may partly result from methodological issues and partly from differences in forest types and soil conditions ([21]). Annual contribution of RR to total RS was 29%, which is similar to that reported for temperate mixed hardwood forests (33% - [6]) and to the average contribution of main forest types in China (34.7% - [9]). However, it was relatively low when compared with other forests types ([39], [46], [61]) and with the world average (46% - [21]).
Li et al. ([39]) ascribed the low contribution of RR to RS to different forest types, stand ages and forest structures, while Rey et al. ([51]) attributed it to the decrease of NEE and NPP due to coppicing, logging operation (decrease in LAI), and the increase in litter and detritus both above- and below-ground. The low contribution of RR to RS could be also partly due to the trenching treatment. An increase in dead root mass due to trenching may have increased the root debris, whose decomposition rate may differ depending on forest type, ranging from several months to one year ([51], [73]). To minimize such trenching effect, it has been suggested to measure the RS several months later, when the respiration rate in the trenched plots is stable ([21], [73]). However, the decomposition of dead roots has been asserted to occur in the first month ([30]) and Bowden et al. ([6]) further argued that the influence of dead root decomposition could be ignored, though they did not measure long-term decomposition of dead roots. To evaluate the early responses of RS to trenching in this study, RS was measured one month later. This could lead to an underestimation of the RR, and to an overestimation of the RM. Thus, the annual RM contribution to RS was as high as 49%, especially in the first few months. Additionally, higher water availability in TS compared with IS and LS (Fig. 1b) could increase the contribution of RM to RS, because RM was strongly positively related with soil moisture. The annual contribution of RL to RS was 22%, which was similar to other studies ([6], [51], [61]).
Effects of soil temperature on RS
RS and soil temperature are often exponentially related in forests ([51], [61], [66]). Such kind of relationship was also found in the Moso bamboo forest analyzed in this study. Soil temperature accounted for most of the variation in RS and its source components, indicating that soil temperature is one of the most important drivers of RS variability.
To describe the dependence of RS on temperature, the Q10 value was applied. The Q10 value is always calculated from a time series of measured RS values, and well depicts the response of RS to changes in temperature ([51]). Q10 values in this study varied from 1.15 to 1.26, which are close to the range (1.28-5.53) reported for the main forest types in China ([9], [74]). Also, the values observed in this study are lower than those reported for aspen-birch forests (3.75), a temperate mixed hardwood forest in Harvard Forest (3.9), evergreen broadleaved forests (2.38), mixed evergreen and deciduous broadleaved forests (2.68), deciduous broadleaved forest (2.99) and sub-alpine coniferous forest (4.24) in the Shennongjia Forest Region ([12], [44], [66]). The Q10 of the different source components was different, suggesting that different RS components had different responses to soil temperature. Q10 value of RR was the lowest, indicating that RR is less sensitive to soil temperature than other components of RS. This is inconsistent with data from mixed temperate forests ([4]), likely because bamboo forests show high activities in winter and early spring, due to the growth of shoots.
The large variability of Q10 values across different ecosystems may be partly attributed to the different methodology applied and partly to environmental factors. First, soil temperature at different depths can result in different Q10 values. Khomik et al. ([31]) measured the mean soil temperature in a boreal mixed wood forest at 2, 5, 10, 15, 20 and 50 cm depths, and found Q10 values in the range 3.6 to 12.7, though the highest coefficients of RS to soil temperature were found at 10 cm depth. Borken et al. ([5]) reported similar values of Q10 for European beech, Norway spruce and Scots pine forests, ranging from 1.87 at 0 cm to 3.46 at 10 cm of depth. Based on the above evidence, such authors suggested to model the relationship between RS and soil temperature using data measured at 5-10 cm, which is the depth where the highest proportion of CO2 along the profile is released. Second, Q10 values may change depending on the timescale considered. Based on the same dataset, Janssens & Pilegaard ([26]) obtained seasonal and annual Q10 values ranging from 1.3 to 5.5, with an annual average of 4.2 in a beech forest. Long-term continuous datasets are required to throw light on the temperature dependence of Q10 value of RS. The third reason underlying the large variability of Q10 is the calculation method. In most studies, the calculation of Q10 was based on an exponential model (Q10 = ebT - [5], [19], [64]). However, because of the strong co-variation with soil moisture, one-factor regression models are not well suited for analyzing the relationship between RS and soil temperature. In this study, a two-factor model was applied to calculate Q10 (eqn. 5). Our results showed that one-factor models tend to overestimate Q10 (data not shown), likely because of water stress in winter and early spring. Although widely adopted in different studies of soil temperature, the use of Q10 as the only variable is somehow limiting ([15]). For example, the assumption of constant temperature sensitivities of respiratory enzymes does not hold at all temperatures ([1]). Rapid changes in substrate availability ([24]), clipping and shading ([62]), kinetics of SOM decomposition ([14]), and the occurrence of drying and rewetting cycles ([55]) also clearly affect soil respiration independent of temperature. Therefore, the annual Q10 value did not only reflect the dependence of RS on soil temperature, but also includes the effects of changes of plant phonological patterns, substrate availability, soil temperature and moisture ([26]).
Effects of soil moisture on RS
Soil moisture is another important factor affecting RS. In this study, RS and its source components were linearly related with soil moisture at 5 cm depth, similar to previous studies ([39], [40]). Very high or low soil moisture constrained RS by limiting aeration ([12], [71]). For example, the lowest RS rate was observed in summer in a Mediterranean mixed oak forest due to summer drought ([51]). In the current study, a similar occurrence was observed in May, when RS and its source components decreased despite the increase of soil temperature, as a consequence of a short drought period that led to a decrease in the soil moisture (Fig. 1b and Fig. 2).
Combined effects of soil temperature and moisture on RS
RS is often modeled as a function of either soil temperature or soil moisture ([71]). However, temperature and moisture co-vary in the soil, making difficult to distinguish their individual effects on RS. Soil moisture limits RS in dry areas or during dry seasons ([51]) and soil temperature controls RS in low temperature areas or seasons, especially at high altitudes ([2], [40]).
In this study, two-factor equations were applied to model the combined effects of soil temperature and moisture on RS. These models explained 45-92% of the variation in RS, which was consistent with previous studies ([12], [71]). Compared with a one-factor model, the two-factor models were able to describe the seasonal variability and co-effect of soil temperature and soil moisture on RS, especially when either one or the other are the limiting factors ([12], [29], [71]). However, the R2 of the two-factor model was relatively low for RR and RL, as compared with that obtained for RS and RM, indicating that other factors may be responsible for the variability of RR and RL, such as carbohydrates, root biomass, root activity, soil nutrient availability and litter biomass ([37], [48], [53], [72]). This fact has been underrated in most RS studies, because temperature variability is highly correlated with solar radiation, masking the direct effect of photosynthesis on substrate availability in the soil ([33]).
Carbon balance
RS studies carried out in Moso bamboo forests are very scarce in the literature. Fan et al. ([19]) reported an annual CO2 flux estimate of 33.94 t CO2 ha-1 y-1 (equaling 9.26 t C ha-1 y-1) in a Moso bamboo forest located in the Huitong county, Hunan province (subtropical China), which was comparable to that obtained in this study (8.97 t C ha-1 y-1). On the other hand, our estimate was lower than that reported for both intensively managed and conventional Moso bamboo forests (15.98 and 10.88 t C ha-1 y-1, respectively) in Lin’an, Zhejiang province, which has higher precipitation (1629 mm - [42]).
In contrast to bamboo forests, several studies have examined RS in other forest types of subtropical China. Xiao et al. ([70]) reported an annual CO2 flux in a Chinese fir plantation of 19.88 t CO2 ha-1 y-1 (equaling 5.42 t C ha-1 y-1) in Huitong county, Hunan province. Yang et al. ([73]) measured RS in Castanopsis kawakamii and adjacent monoculture evergreen plantations of C. kawakamii and Cunninghamia lanceolata in the subtropical Sanming Nature Reserve, Fujian Province, estimating an annual RS of 13.74, 9.44 and 4.54 t C ha-1 y-1, respectively. Such large variation in estimates suggests that forest types and climate conditions had significant effects on annual RS. Therefore, the availability of data on RS in different forest types and climate zones is critical to accurately predict global carbon cycles and its responses to climate change.
NEP of terrestrial ecosystems is a key process for actively managing the carbon cycle ([22]). In this study, NEP estimate was 4.72 t C ha-1 y-1, indicating that the investigated Moso bamboo forest acts as carbon sink. However, such estimate was higher than that obtained for a similar forest in the Hunan province (3.96 t C ha-1 y-1 - [70]), as well as for an open eucalypt savanna in northern Australia (3.8 t C ha-1 y-1 - [8]). Contrastingly, annual NEP estimated in this study was lower than that reported for a European temperate deciduous forest (5.9 t C ha-1 y-1 - [45]) and a natural evergreen forest of Castanopsis kawakamii (7.5 t C ha-1 y-1), but close to that from a Castanopsis kawakamii plantation in China (4.1 t C ha-1 a-1 - [73]). Xiao et al. ([70]) attributed such large differences in NEP estimates not only to tree species and their biological characteristics, but also to site conditions. Malhi et al. ([45]) concluded that the use of different methods (e.g., eddy flux measurement, estimation derived from component processes) also caused a great bias in annual NEP estimation.
Conclusion
This study provides a better understanding of the RS and carbon balance of Moso bamboo forests in subtropical China, and contributes to estimate a global carbon balance across different forest types. RS and its source components varied across seasons, mainly in response to soil temperature and moisture changes and their interactions. Two-factor models using both soil temperature and moisture as predictors accounted for variation in RS and its components better than either soil temperature or moisture. RM contributed half to RS, while RL contributed only 22%. NEP estimate was 4.72 t C ha-1 y-1, indicating that the Moso bamboo forest investigated acts as carbon sink.
Acknowledgements
The study was supported by Special Funds for Forestry Public Industry Research (201104008); Special funds for basic research of International centre for Bamboo and Rattan (1632013010); key special funds of Jiangxi province (2011511101). The authors thank Qingbiao Xu for carrying the fieldwork and lab work, and Jin Yu, Chuxin Shen for fieldwork support.
References
Gscholar
Gscholar
Gscholar
Gscholar
CrossRef | Gscholar
Gscholar
Gscholar
CrossRef | Gscholar
Gscholar
Gscholar
Gscholar
Gscholar
Gscholar
Gscholar
Gscholar
Authors’ Info
Authors’ Affiliation
Shaohui Fan
Lianghua Qi
Fengying Guan
Chunju Cai
Manyi Du
Key Laboratory of Bamboo and Rattan Science, International Centre for Bamboo and Rattan, 100102 Wangjing, Chaoyang District, Beijing (China)
Department of Forest Inventory and Remote Sensing, Burckhardt Institute, Georg-August-Universität Göttingen, 37077 Göttingen (Germany)
Corresponding author
Paper Info
Citation
Tang X, Fan S, Qi L, Guan F, Cai C, Du M (2015). Soil respiration and carbon balance in a Moso bamboo (Phyllostachys heterocycla (Carr.) Mitford cv. Pubescens) forest in subtropical China. iForest 8: 606-614. - doi: 10.3832/ifor1360-007
Academic Editor
Silvano Fares
Paper history
Received: May 24, 2014
Accepted: Oct 18, 2014
First online: Feb 02, 2015
Publication Date: Oct 01, 2015
Publication Time: 3.57 months
Copyright Information
© SISEF - The Italian Society of Silviculture and Forest Ecology 2015
Open Access
This article is distributed under the terms of the Creative Commons Attribution-Non Commercial 4.0 International (https://creativecommons.org/licenses/by-nc/4.0/), which permits unrestricted use, distribution, and reproduction in any medium, provided you give appropriate credit to the original author(s) and the source, provide a link to the Creative Commons license, and indicate if changes were made.

Web Metrics
Breakdown by View Type
Article Usage
Total Article Views: 59681
(from publication date up to now)
Breakdown by View Type
HTML Page Views: 48000
Abstract Page Views: 5026
PDF Downloads: 5067
Citation/Reference Downloads: 33
XML Downloads: 1555
Web Metrics
Days since publication: 4148
Overall contacts: 59681
Avg. contacts per week: 100.72
Article Citations
Article citations are based on data periodically collected from the Clarivate Web of Science web site
(last update: Mar 2025)
Total number of cites (since 2015): 11
Average cites per year: 1.00
Publication Metrics
by Dimensions ©
Articles citing this article
List of the papers citing this article based on CrossRef Cited-by.
Related Contents
iForest Similar Articles
Research Articles
Soil respiration along an altitudinal gradient in a subalpine secondary forest in China
vol. 8, pp. 526-532 (online: 01 December 2014)
Research Articles
Spatial heterogeneity of soil respiration in a seasonal rainforest with complex terrain
vol. 6, pp. 65-72 (online: 07 February 2013)
Research Articles
Seasonal dynamics of soil respiration and nitrification in three subtropical plantations in southern China
vol. 9, pp. 813-821 (online: 29 May 2016)
Research Articles
Thinning effects on soil and microbial respiration in a coppice-originated Carpinus betulus L. stand in Turkey
vol. 9, pp. 783-790 (online: 29 May 2016)
Review Papers
Separating soil respiration components with stable isotopes: natural abundance and labelling approaches
vol. 3, pp. 92-94 (online: 15 July 2010)
Research Articles
Short-time effect of harvesting methods on soil respiration dynamics in a beech forest in southern Mediterranean Italy
vol. 10, pp. 645-651 (online: 20 June 2017)
Research Articles
Effect of different dolomitic limestone dosages on soil respiration in a mid-altitudinal Norway spruce stand
vol. 12, pp. 357-365 (online: 05 July 2019)
Research Articles
The manipulation of aboveground litter input affects soil CO2 efflux in a subtropical liquidambar forest in China
vol. 12, pp. 181-186 (online: 10 April 2019)
Research Articles
Comparison of soil CO2 emissions between short-rotation coppice poplar stands and arable lands
vol. 11, pp. 199-205 (online: 01 March 2018)
Research Articles
Wood-soil interactions in soil bioengineering slope stabilization works
vol. 2, pp. 187-191 (online: 15 October 2009)
iForest Database Search
Search By Author
Search By Keyword
Google Scholar Search
Citing Articles
Search By Author
Search By Keywords
PubMed Search
Search By Author
Search By Keyword


