Effects of planting density on the distribution of biomass in a douglas-fir plantation in southern Italy
iForest - Biogeosciences and Forestry, Volume 8, Issue 3, Pages 368-376 (2015)
doi: https://doi.org/10.3832/ifor1078-007
Published: Sep 09, 2014 - Copyright © 2015 SISEF
Research Articles
Abstract
The effects of initial planting densities on the distribution of above-ground biomass of Douglas-fir (Pseudotsuga menziesii [Mirb.] Franco var. menziesii) were investigated in a plantation in southern Italy. Allometric equations designed for the plantation under study were used to estimate above-ground biomass and in particular partitioning to stem and crown compartments. A comparison between biomass estimated with allometric equations and biomass estimated with a constant biomass expansion factor (BEF) from the Italian National Forest Inventory (INFC 2005) was carried out. Moreover, a BEF calculated as the ratio of total above-ground or compartment biomass to stem volume was used to define the sensitivity of BEF to age and to tree density. Variation of above-ground standing biomass estimated with allometric equations was evaluated according to 6 differing planting densities (833, 1000, 1250, 1667, 2000 and 2500 trees per hectare). In the first 20 years after planting higher biomass stock was detected in high density plots, but after the age of 32 years differences between plots disappeared. When the plantation was 40 years old, a higher amount of total biomass was observed in plots of 2000 trees per hectare (about 405 Mg ha-1), a lower amount in plots of 2500 trees per hectare (about 381 Mg ha-1). The Douglas-fir plantation has a total above-ground carbon stock of 197 Mg C ha-1 at the age of 40 and a mean annual CO2 sequestration of 18 Mg ha-1 y-1. Constant BEF from INFC underestimated biomass on average by 11% for ages 15 and 25 and overestimated biomass on average by 16% for older ages. BEFs expressed as a ratio of biomass to stem volume significantly depended upon age and planting density, with decreasing trends for total, stem and crown compartments. Our results indicated that total above-ground biomass production is not influenced by different tree density if considered over a long period. If cutting cycles are short, planting density on average of 2000 trees per hectare may ensure high biomass production rates; if cutting cycles are longer, 1000-1200 trees per hectare could also be a valid choice.
Keywords
Allometric Equations, Biomass, Biomass Expansion Factor, Carbon, Douglas-fir, Planting Density, Spacing Trial
Introduction
Douglas-fir (Pseudotsuga menziesii (Mirb) Franco var. menziesii) is a species native to western north America which has been widely used in the reforestation of abandoned rural areas in Italy, particularly along the Apennines, because of its rapid growth and adaptability ([6]). It has been usually managed with 30-70 years cutting cycle, with harvest of total stand volume, mainly destined for use in construction.
The crucial phase of a reforestation project is the choice of tree-density and spacing, because these are parameters influencing the kind of management to adopt and the costs during the early phase after planting ([10], [43]). Furthermore planting density strictly affects management, due to the ecological, silvicultural and economic implications ([6], [26], [34], [27], [7]). Considering the biomass distribution at tree and stand level, planting density and spacing are fundamental elements to be accounted for. In the context of global warming potential, information concerning the influence of planting density on biomass allocation is extremely important, because all the countries which adhere to the Kyoto Protocol are requested to adopt forms of forest management which may enhance the atmospheric CO2 absorption ([49]). Currently, planting density adopted for reforestation, and for plantations destined to biomass production for energy, is generally lower compared to the past, when planting density was chosen without considering its effects on carbon stocking. The choice then revolved around the wood quality (tree grown in high density stands showed better mechanical characteristics) and traditional management as defined by the German forestry school ([8]). Currently, the practice of adopting lower planting densities is more widespread for the following reasons: (i) the higher cost of young plants; (ii) the need to pass through rows with specialized machinery to carry out maintenance operations; (iii) the convenience of postponing early thinning with the aim to harvest larger trees.
In Italy high density plantations were normally established because of the costs of manpower and young plants were low. Such plantations presented high tree density even at a late stage, since no silvicultural intervention has been carried out (difficulty in trading small dimension trees). As a consequence, losses due to self-thinning, meteoric causes and pathogen attacks occurred with high frequency. In conifers, a higher density results in a lower tree diameter growth and, to a lesser extent, tree height may be lowered or suppressed ([23]).
At stand level wood production increases with increasing stand density because the volume associated with the additional trees more than compensates for the decrease in the size of individuals ([15]). At later ages of stands, it often happens that stands with differing densities do not result in different wood production, because the growth rate of high-density stands reaches a maximum and begins to decline earlier than lower-density stands.
In Italy spacing trials (without thinning) in Douglas-fir plantations were carried out on the coastal chain in Calabria (southern Italy - [6], [34], [8]) and in Tuscany ([26]). In the USA the first trials were performed in 1925 ([42]). In France the first spacing trials were carried out in 1955 by Mitchell et al. ([35]) and in 1971 by Bartoli ([2]), whereas in Germany the first spacing trials date back to 1958 and 1961 ([25]).
Assessments of forest stand carbon dynamics, nutrient fluxes, and tree growth often include estimates of tree biomass ([14]). In the present study, we aim at evaluating the above-ground biomass distribution and subsequently the carbon stock of a Douglas-fir plantation in southern Italy. We consider the effects of planting density on the distribution of biomass and its partitioning to stem and crown compartments, using a spacing trial measured periodically over 25 years. Quantifying forest productivity following the guidelines by the Intergovernmental Panel on Climate Change ([22]), allows us to finally define the role of management in strengthening the global warming potential of the plantation under study. Two methods were used to estimate carbon stock ([22]): (i) allometric equations designed for the Douglas-fir plantation grown under the same conditions as the plantation in our study ([34]); and (ii) a constant biomass expansion factor (BEF) taken from the Italian National Forest Inventory ([21]). Moreover, a BEF derived as the ratio between stand characteristics ([28]) was used to develop BEFs that are dependent on stand age for the whole tree, stem and crown biomass, taking into account the planting density. Considering that currently in Italy there are no spacing trials which account for biomass allocation over a long period of time, the present study aims at producing a more in-depth knowledge of biomass allocation in Douglas-fir plantations differing in planting density.
To summarize, the final aims of this study were: (i) to evaluate above-ground, stem and crown biomass of a Douglas-fir stand and its changes over time according to different planting densities; (ii) to compare different estimation methods of biomass stock of trees (allometric equations and constant BEF); (iii) to determine age dependent functions of BEFs.
Material and Methods
Study site
The study area is located in the central coastal chain of Calabria, on the western flank of the southern Apennines exposed to the Tyrrhenian sea. The locality is called Serra Salinaro (39° 25′ N, 16° 2′ E, mean altitude 900 m a.s.l.). It is the property of the regional Italian State Forestry Agency (Azienda di Stato Foreste Demaniali - ASFD) that afforested the area in 1967 mainly with Douglas-fir and to a lesser degree with white pine (Pinus strobus L.), black pine (Pinus nigra Arnold var. calabrica), atlas cedar (Cedrus atlantica (Endl. Carrierre), maritime pine (Pinus pinaster Ait.), silver fir (Abies alba Mill.) and Japanese larch (Larix leptolepis (Sieb. Et Zucc.) Gard. = L. Kaempferi Sarg.). The understory vegetation is mainly constituted of fern (Pteridium aquilinum (L.) Kuhn), bramble (Rubus ulmifolius Schott, 1818) and holly (Ilex aquifolium L.). The plantation is part of a reforestation project carried out in southern Italy with funding earmarked by national government to restore forest ecosystems in abandoned agricultural land. Rapid growth non-indigenous species were largely used, with the final aim of obtaining a continuous covering of land in a short time.
Climatic data have been collected from the meteorological station of Guardia Piemontese (515 m a.s.l., 5 km apart), and climatic equations proposed by Ciancio ([5]) have been used to define climatic data related to the altitude of the location under study. The climate is typically Mediterranean. The annual rainfall is 1233 mm, with minimum precipitation in summer (88 mm) and a maximum during the winter (501 mm). Average annual temperature is 11.5 °C at an altitude of 950 m a.s.l. Average temperature of the coldest month is 3 °C, while the warmest has an average temperature of 20.8 °C. According to Pavari’s phytoclimatic classification ([39]), the plantation is located between warm and cold sub-zones of Castanetum. The problem of summer aridity is absent, owing to abundant precipitation, frequent fogs and exposure to moist air from the Tyrrhenian sea ([4]).
Geologically the site is underlain by green and purple Paleozoic schist. According to FAO soils classification ([18]) soils are brown Podzols, with a plinthic horizon starting within 50 cm from the soil surface, deriving from basic metamorphic rocks, with highly decomposed organic material in more arid sites.
Experimental designs and dendrometric surveys
Six plots with different spacing trials were identified in the plantation. The planting densities were the following:
- Planting density A: 2500 trees ha-1, with spacing of 2 m between rows and 2 m between trees (PL2500);
- Planting density B: 2000 trees ha-1, with spacing of 2 m between rows and 2.5 m between trees (PL2000);
- Planting density C: 1667 trees ha-1, with spacing of 2 m between rows and 3 m between trees (PL1667);
- Planting density D: 1250 trees ha-1, with spacing of 2 m between rows and 4 m between trees (PL1250);
- Planting density E: 1000 trees ha-1, with spacing of 2.5 m between rows and 4 m between trees (PL1000);
- Planting density F: 833 trees ha-1, with spacing of 3 m between rows and 4 m between trees (PL833);
Each plot had an area of 5000 m2. Within each plot two sub-plots of 900 m2 were earmarked for dendrometric surveys with a subsequent testing of the effects of different planting densities. In each plot (12 plots), two orthogonal diameters at breast height (DBH) of all trees were measured. In addition, the total height (Ht) of a representative sample (about 50%) of trees was measured. Dendrometric surveys were performed over a 25 year period. Initially, when the stand was 15 years old, and then again at age 25, 32 and 40. In each plot the removal of dead trees was carried out for phytosanitary reasons. Tab. 1 shows the main dendrometric parameters for the six planting densities at the age considered.
Tab. 1 - Main dendrometric parameters of stands for each planting density at the ages considered.
| Planting density (trees ha-1) |
Age (year) |
Current density (ha-1) |
Cumulative Mortality (%) |
Basal area (m2 ha-1) |
Quadratic mean DBH (cm) |
Stand height (m) |
Volume (m3 ha-1) |
|---|---|---|---|---|---|---|---|
| 2500 | 15 | 1989 | 20 | 36.66 | 15.3 | 12.5 | 215.8 |
| 25 | 1634 | 35 | 54.27 | 20.6 | 19.9 | 486.37 | |
| 32 | 1333 | 47 | 58.46 | 23.6 | 24 | 623.35 | |
| 40 | 946 | 62 | 64.44 | 29.5 | 29.4 | 830.68 | |
| 2000 | 15 | 1860 | 7 | 34.75 | 15.4 | 12.2 | 200.09 |
| 25 | 1699 | 15 | 52.68 | 19.9 | 19.2 | 456.99 | |
| 32 | 1398 | 30 | 56.88 | 22.8 | 23.8 | 602.29 | |
| 40 | 1280 | 36 | 62.88 | 25 | 28.6 | 792.28 | |
| 1667 | 15 | 1538 | 8 | 32.89 | 16.5 | 13.1 | 201.52 |
| 25 | 1409 | 16 | 49.41 | 21.1 | 21.4 | 473.89 | |
| 32 | 1151 | 31 | 54.93 | 24.7 | 25.6 | 622.34 | |
| 40 | 925 | 45 | 59.97 | 28.7 | 29.8 | 783.63 | |
| 1250 | 15 | 1122 | 10 | 26.83 | 17.5 | 11.9 | 150.45 |
| 25 | 1056 | 16 | 46.82 | 23.8 | 19.9 | 417.7 | |
| 32 | 900 | 28 | 54.71 | 27.8 | 23.4 | 566.79 | |
| 40 | 778 | 38 | 66.26 | 32.9 | 28.2 | 818.26 | |
| 1000 | 15 | 967 | 3 | 24.12 | 17.8 | 11.8 | 134.09 |
| 25 | 933 | 7 | 46.61 | 25.2 | 19.5 | 407.06 | |
| 32 | 889 | 11 | 56.83 | 28.5 | 23.7 | 595.62 | |
| 40 | 811 | 19 | 68.28 | 32.7 | 28.6 | 854.86 | |
| 833 | 15 | 689 | 17 | 20.66 | 19.5 | 11.8 | 114.4 |
| 25 | 689 | 17 | 42.15 | 27.9 | 19 | 357.94 | |
| 32 | 678 | 19 | 53.54 | 31.7 | 24.4 | 575.43 | |
| 40 | 667 | 20 | 65.31 | 35.3 | 27.9 | 796.99 |
Allometric equations and biomass expansion factors
Due to the lack of equations which allow the prediction of below-ground biomass for Douglas-fir plantation, in this study only the above-ground biomass has been considered. The biomass of each component (total above-ground, stem and crown) at tree-level was estimated from the diameter at breast height (DBH) using equations by Menguzzato & Tabacchi ([34]), with different coefficients for different planting densities. Tab. 2 shows the equations used for the estimation of stem, crown and total above-ground biomass. Some statistics on sample trees collected in the six plots with differing planting densities are also reported. Equations were used to predict biomass at tree and stand level for all ages, when plantation was 15, 25, 32, 40 years old.
Tab. 2 - Equations for stem, crown and total biomass estimates, and minimum and maximum diameter values of the sampled trees (source: [34], modified).
| Planting density (trees ha-1) |
Biomass component |
Equation | DBH sampled trees (min-max, cm) |
|---|---|---|---|
| A: 2500 | Stem | -15.85 + 0.33 dbh2 | 11.5 - 28.8 |
| Crown | -7.14 + 0.16 dbh2 | ||
| Total | -22.76 + 0.49 dbh2 | ||
| B: 2000 C: 1667 |
Stem | -27.94 + 0.40 dbh2 | 10.3 - 29.0 |
| Crown | -9.74 + 0.17 dbh2 | ||
| Total | -33.40 + 0.56 dbh2 | ||
| D: 1250 | Stem | -12.79 + 0.31 dbh2 | 13.5 - 32.8 |
| Crown | -9.06 + 0.18 dbh2 | ||
| Total | -20.45 + 0.48 dbh2 | ||
| E: 1000 F: 833 |
Stem | -8.82 + 0.30 dbh2 | 15.3 - 35.3 |
| Crown | 0.70 + 0.18 dbh2 | ||
| Total | -5.95 + 0.47 dbh2 |
A conversion procedure was also adopted based on biomass expansion factors (BEFs), proposed by the Intergovernmental Panel on Climate Change ([22]) guidelines for the cases where no specific biomass models are available ([20]). A constant BEF from the INFC for conifer plantations in Italy (BEF = 1.41; basic wood density = 0.43) was multiplied by aggregated stand-level volume. To estimate stem volume at tree level, volume equation for Pseudotsuga menziesii (Mirb.) Franco from the INFC ([48]) was used.
A second BEF was developed from the data of volume and biomass at stand level per hectare as the ratio of total or component dry biomass to stem volume ([28] - eqn. 1):
where Wi is total or component dry biomass at stand level per hectare (Mg ha-1) estimated with the allometric equation by Menguzzato & Tabacchi ([34]), V is the stem volume at stand level per hectare (m3 ha-1), determined with the equation by Tabacchi et al. ([48]). The BEF was also calculated for both crown and stem biomass.
The second BEF was used to define the age-dependent functions of BEF, in order to predict the BEFs for each biomass component depending on stand age and planting density.
Data analysis
A linear regression was used to correlate the distribution of above-ground biomass to planting density for every age. Analysis of variance (ANOVA) based on a scheme of randomized blocks (six planting density repeated twice) was carried out to test the differences in biomass stock, mean increments of biomass and partitioning to crown and stem, between differing density plots. The significance of the differences was tested by the Tukey’s method.
Both the paired-sample T test and the paired-sample Z-Test (Wilkoxon test) were used to compare the biomass estimates calculated by allometric equations with the biomass estimates calculated by the constant BEF from INFC. The T test is a parametric test known to be more statistically powerful; on the other hand, the Z-Test is non-parametric and requires almost no assumptions. Applied statistic textbooks ([53], [37], [46]) usually recommend to use both tests in order to truly verify the estimates.
For each planting density and for each biomass component, age-dependent functions of BEF were defined with a stepwise regression. A power function provided the best fit for each planting density and for every BEF component (stem, crown and total tree). We used an F-test for parallelism (mathematical similarity) to compare the null hypothesis of a unique equation for all planting densities with the alternate hypothesis of six equations with different coefficients. In all cases, the null hypothesis was rejected.
Data analysis was carried out using the statistical software R version 2.3.0 ([40]).
Results
Evaluation of biomass allocation and partitioning
Tree mortality occurred in all plots during the years of survey. It was higher in high planting density stands (Tab. 1), as noticed by Menguzzato & Tabacchi ([34]) and Ciancio et al. ([8]). A high mortality rate (62% at the age of 40 years) was observed for the PL2500 plots. Plots belonging to PL2000, PL1667 and PL1250 were less subject to mortality (about 40%) and the lowest mortality rates were detected in plots of PL1000 and PL833 (about 20%). When the plantation was 40 years old, higher current density was detected in PL2000 (1280 trees ha-1).
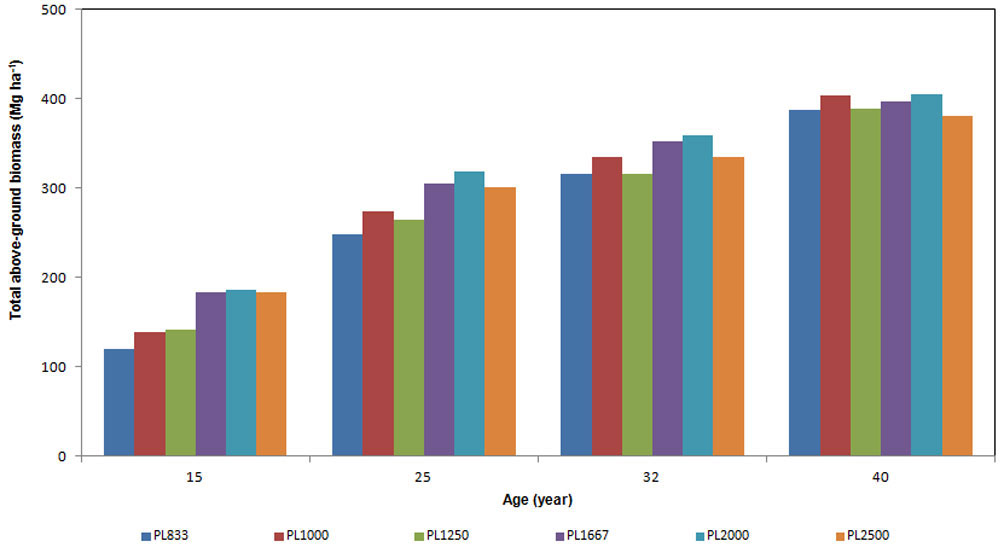
Total above-ground standing biomass at age 15 ranged from 120 to 186 Mg ha-1 (Fig. 1), and reached 400 Mg ha-1 at age 40. At the age of 15, total above-ground biomass per hectare increased with increasing density from 833 to 1667 trees ha-1 (Fig. 1); however, the higher biomass stock was detected in PL2000 plots rather than in PL2500 plots. At the age of 25, PL1000 plots showed higher above-ground biomass in comparison to PL1250 plots; at age 40, the plots with higher biomass stock were those in PL1000 and PL2000 (about 405 Mg ha-1), with no differences between them.
Fig. 1 - Above-ground biomass expressed in Mg ha-1, of stands with different planting density, for each age considered.
For all the stand ages total above-ground biomass was regressed against planting density (Fig. 2). At the age of 15 R2 was significant (0.788), but after 10 years (25 years) R2 was lower (0.527) though still significant. At 32 and 40 years of age, R2 was equal to 0.099 and 0.008, respectively, thus the statistic correlation was absent.
Fig. 2 - Regression lines between above-ground biomass and planting density. Each dot represents the estimated above-ground biomass in each plot.
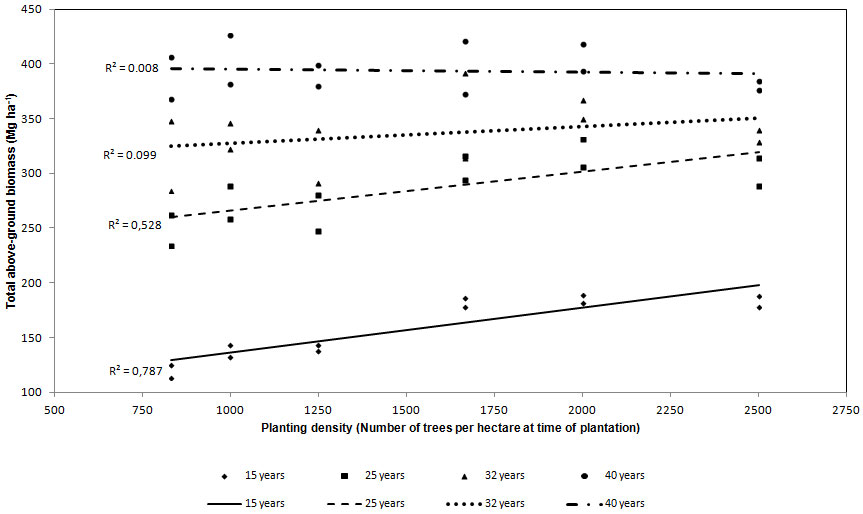
At age 25 years above-ground biomass was dependent upon tree density, whereas at older ages the proportionality tended to disappear, and at the age of 30 it was totally absent. When the plantation was 40 years old, the highest amount of total biomass was detected in PL2000 (about 405 Mg ha-1), while the lowest was in the PL2500 plots (about 381 Mg ha-1), the other plots showing values in the range 385-404 Mg ha-1.
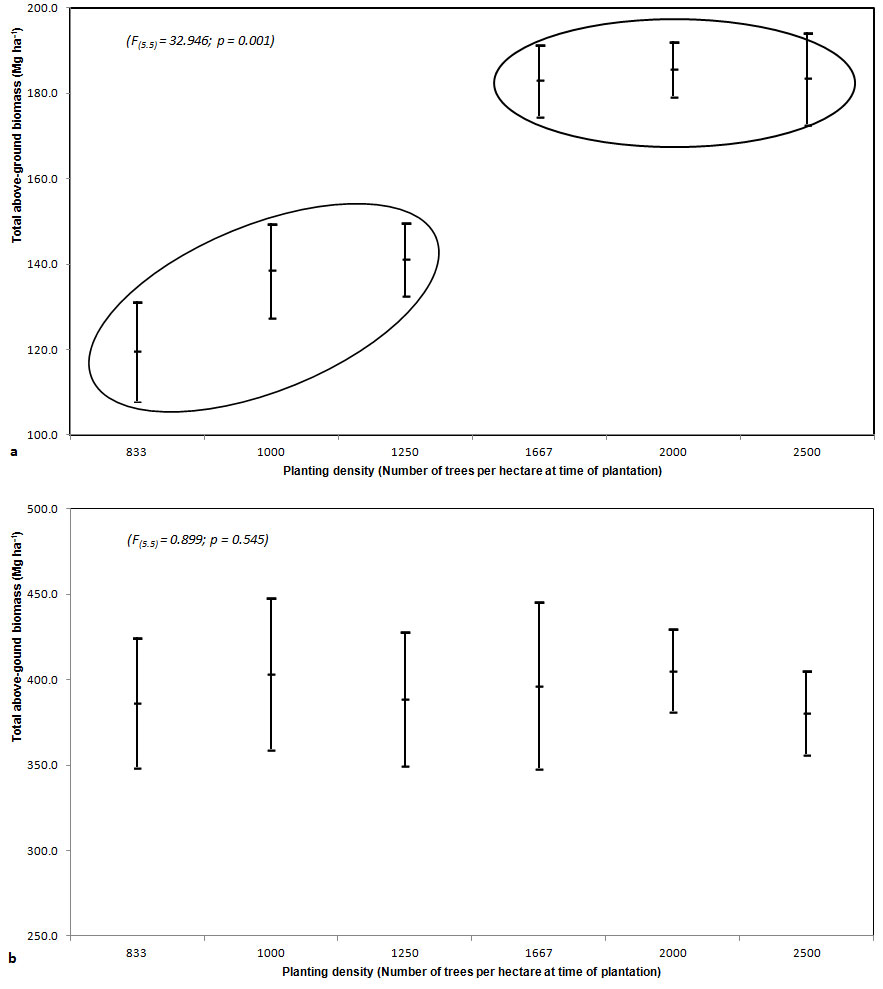
Analysis of variance (ANOVA) was carried out to test for differences between different density plots. Significant difference was found for ages 15 (Fig. 3a) and 25. No significant difference was found for ages 32 and 40 (Fig. 3b). At age 15 two groups significantly differed, but within each group no differences were detected (Fig. 3a). The first group showed higher values of above-ground biomass (on average, 184 Mg ha-1) and was made up of plots with higher tree density (1667 and 2500 trees ha-1); the second group showed a mean above-ground biomass of 133 Mg ha-1 and was made up of plots with lower tree density (833 and 1250 trees ha-1). Ten years later (1992) differences between the two groups were no more significant and with increasing age, differences tended to disappear (Fig. 3a).
Fig. 3 - Mean values of above-ground biomass per hectare with an approximate 95% confidence interval (± 2 Standard Error) at the age of 15 (a) and 40 (b).
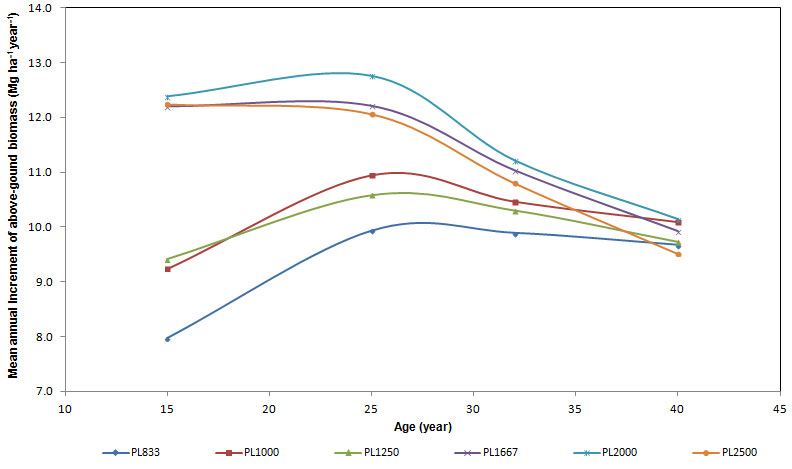
The mean annual increment (MAI) of total standing above-ground biomass at the age of 40 resulted high in all the plots considered (Fig. 4), reaching 9.8 Mg ha-1 year-1, with no significant difference between differing planting densities. Differences were significant at ages 15 and 25. Two groups could be distinguished: (i) the first was made up of plots with planting density from 833 to 1250 trees ha-1; (ii) the second was made up of plots from 1667 to 2500 trees ha-1. In the first group, at the ages of 15, 25 and 32, the mean annual increments of biomass were lower than those in the second group. Furthermore, at age 15 the differences between mean increments in plots with high planting density were null, whereas they were higher in plots with low density. The trend of mean annual increments increased in plots with planting density from 833 to 1250 trees ha-1 until the age of 25, and then it remained constant. In plots from 1667 to 2500 trees ha-1, the mean annual increment of biomass slightly slowed down. At the age of 32, mean annual increments resulted to be similar but yet two groups could be detected. At the age of 40 differences disappeared and the culmination of mean biomass increments occurred in low density plots, whereas in higher density plots culmination had been recorded before.
Fig. 4 - Variation of mean annual increment (MAI) of above-ground biomass with the age of stands.
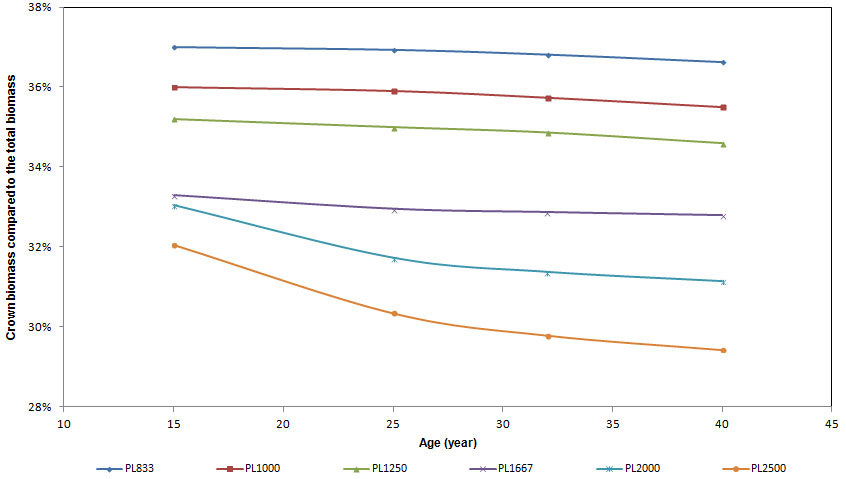
With regard to carbon partitioning to the tree compartments considered, mean crown biomass ranged from 32 to 37% of total above-ground biomass at age 15 (Fig. 5), with significant differences between plots and higher percentage values detected in low density plots. In these plots the percentage of biomass allocated to the crowns was almost constant over time (slightly decreasing), with no significant differences (Tab. 3). In plots with high density the relative share of biomass in the crown compartment had a decreasing trend over time, with no significant differences in PL1667 plots and with significant differences in PL2000 and PL2500 plots (Fig. 5 and Tab. 3). At the age of 40 crown biomass ranged from 29.5 to 37% of total biomass, with highly significant differences between plots.
Fig. 5 - The relative contribution (%) of crown biomass to total above-ground biomass for all the ages of stand.
Tab. 3 - Analysis of variance (ANOVA). Standing biomass by age for each planting density.
| Planting density |
Source of variation |
Sum of Squares |
df | Mean Square |
F | Prob. |
|---|---|---|---|---|---|---|
| 833 | Age | 0.554 | 3 | 0.185 | 2.916 | 0.201 |
| Error | 0.19 | 3 | 0.063 | |||
| 1000 | Age | 0.125 | 3 | 0.042 | 0.082 | 0.966 |
| Error | 1.53 | 3 | 0.51 | |||
| 1250 | Age | 0.06 | 3 | 0.02 | 0.333 | 0.804 |
| Error | 0.18 | 3 | 0.06 | |||
| 1667 | Age | 0.18 | 3 | 0.06 | 3 | 0.196 |
| Error | 0.06 | 3 | 0.02 | |||
| 2000 | Age | 3.364 | 3 | 1.121 | 140.167 | 0.001 |
| Error | 0.024 | 3 | 0.008 | |||
| 2500 | Age | 7.214 | 3 | 2.405 | 1803.5 | <0.001 |
| Error | 0.004 | 3 | 0.001 |
Comparison between methods
The main statistic parameters related to biomass values estimated with allometric equations ([34]) against constant BEF from inventory ([21]) are shown in Tab. 4. For ages 15 and 25 above-ground biomass estimated with the constant BEF was lower than biomass estimated with allometric equations. On the other hand, for ages 32 and 40 above-ground biomass estimated with BEF was higher than biomass estimated with allometric equations.
Tab. 4 - Main statistic parameters of total above-ground biomass estimated with allometric equations (Wt Allometric) and the constant BEF from the Italian National Forest Inventory (Wt BEF INFC).
| Age (year) |
Methods | N | Mean (Mg ha-1) |
Std. Dev. (Mg ha-1) |
Min (Mg ha-1) |
Max (Mg ha-1) |
|---|---|---|---|---|---|---|
| 15 | W t Allometric | 12 | 158.6 | 28 | 113.7 | 189 |
| W t BEF INFC | 12 | 136.5 | 25.4 | 96.4 | 169.4 | |
| 25 | W t Allometric | 12 | 285.3 | 29.7 | 234.4 | 331.3 |
| W t BEF INFC | 12 | 269.8 | 33.6 | 205.5 | 318.6 | |
| 32 | W t Allometric | 12 | 335.6 | 30 | 284.5 | 391.7 |
| W t BEF INFC | 12 | 370.4 | 31.8 | 314.3 | 421.7 | |
| 40 | W t Allometric | 12 | 393.8 | 20 | 367.8 | 425.9 |
| W t BEF INFC | 12 | 504.6 | 32.1 | 446.1 | 570.2 |
The significance of the biomass estimation differences between the allometric function and the BEF approaches resulted high for all the ages (Tab. 5), indicating that BEF underestimated biomass on average by 11% for ages 15 and 25 and overestimated biomass on average by 15.7% for older ages. The differences in biomass estimates using the paired-sample t test (T-test) and the Wilkoxon paired-sample test (Z-test) were significant for all the planting densities.
Tab. 5 - Significance of the biomass estimation differences between the allometric equation and the constant BEF from the Italian National Forest Inventory, assessed by the paired-sample t test (T) and the Wilkoxon paired-sample test (Z).
| Age | T | Prob. | Z | Prob. |
|---|---|---|---|---|
| 15 | 14.652 | <0.001 | -3.059 | 0.002 |
| 25 | 4.412 | 0.001 | -2.824 | 0.005 |
| 32 | -12.612 | <0.001 | -3.059 | 0.002 |
| 40 | -16.674 | <0.001 | -3.059 | 0.002 |
Variation of BEF according to planting density and age
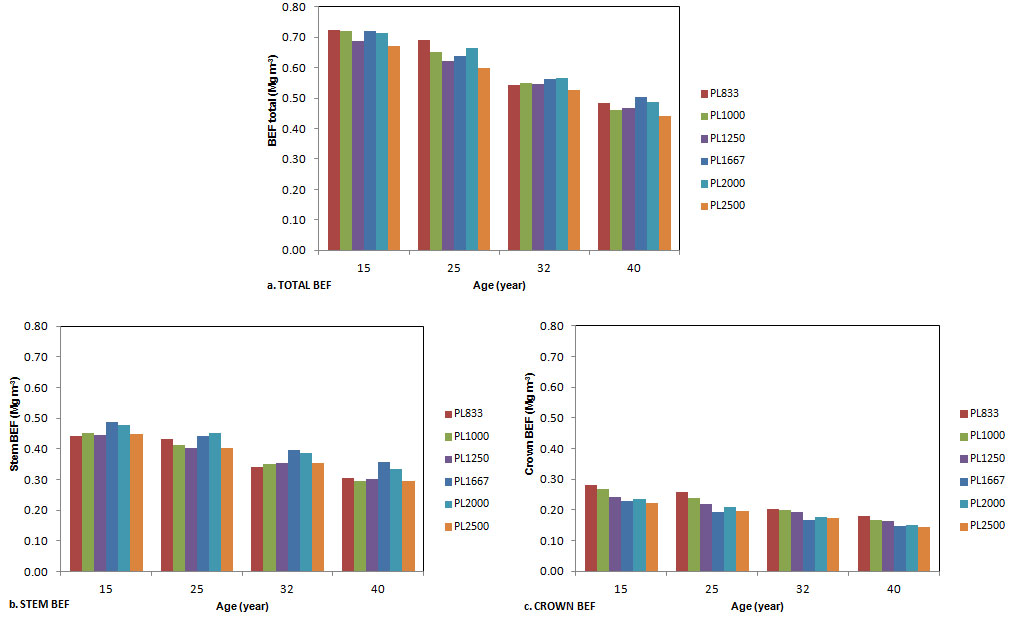
The variation of stand level BEFs, calculated as the ratio between biomass and stem volume, was analyzed for all the plots and ages (Fig. 6). BEFstotal ranged from 0.442 to 0.723 Mg m-3 (Fig. 6a), BEFsstem from 0.294 to 0.489 Mg m-3 (Fig. 6b) and BEFscrown from 0.145 to 0.283 Mg m-3 (Fig. 6c). At ages 15 and 25, BEFstotal showed a decreasing trend with increasing planting density, but the correlation between density and the relative BEFs was not significant. At older ages the trend completely disappeared. BEFsstem were higher in the three plots with higher density (Fig. 6b), with significant differences between the two groups. BEFscrown decreased with increasing density for all the ages considered. BEFscrown showed a larger decrease, of 49% from the age of 15 to the age of 40, whereas total and stem BEFs decreased by 40%.
Fig. 6 - Variation of total (a), stem (b) and crown (c) BEFs with the age of stands, for each planting density.
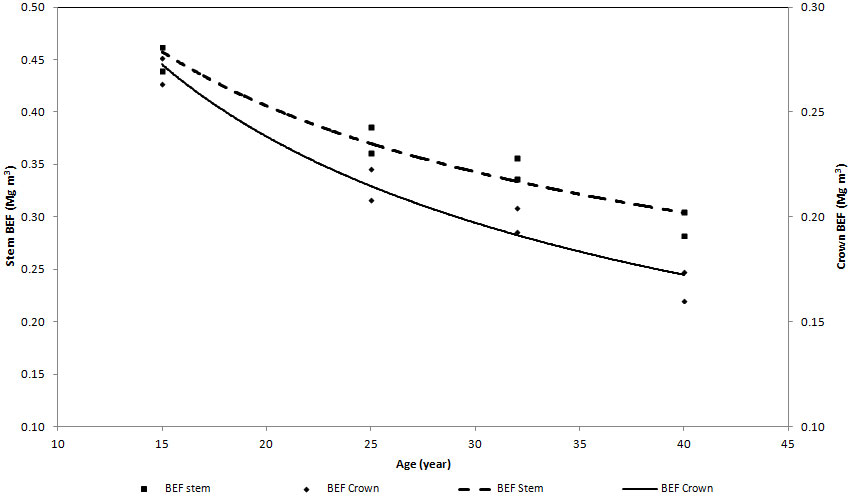
Component and total BEFs for all planting density were regressed against age (Tab. 6). All the models provided a reasonable predictive power with R2 values ranging between 0.834 (PL833 for BEFstotal) and 0.980 (PL1667 for BEFscrown). Regardless of the planting density, the trend of stem and crown BEFs over time decreased with increasing age (Fig. 7).
Tab. 6 - Age-dependent functions for total above-ground, crown and stem dry biomass. Equation form is BEFi = a (Age)b, where BEFi is the BEF of tree component (Mg m-3); Age is the independent variable (years); a is the equation constant; b is the equation parameter; R2 is the coefficient of determination; S.E.E. is standard error of estimation.
| Compartment | Planting density (Trees ha-1) |
a | b | R2 | S.E.E. | Prob. |
|---|---|---|---|---|---|---|
| BEF total | 833 | 2.352 | -0.417 | 0.834 | 0.078 | 0.002 |
| 1000 | 2.481 | -0.441 | 0.895 | 0.064 | <0.001 | |
| 1250 | 1.993 | -0.38 | 0.906 | 0.053 | <0.001 | |
| 1667 | 1.923 | -0.356 | 0.96 | 0.031 | <0.001 | |
| 2000 | 2.088 | -0.381 | 0.875 | 0.061 | <0.001 | |
| 2500 | 2.099 | -0.408 | 0.913 | 0.053 | <0.001 | |
| BEF crown | 833 | 1.055 | -0.47 | 0.882 | 0.072 | <0.001 |
| 1000 | 1.003 | -0.47 | 0.915 | 0.061 | <0.001 | |
| 1250 | 0.69 | -0.375 | 0.901 | 0.052 | <0.001 | |
| 1667 | 0.763 | -0.436 | 0.98 | 0.026 | <0.001 | |
| 2000 | 0.787 | -0.433 | 0.913 | 0.056 | <0.001 | |
| 2500 | 0.717 | -0.419 | 0.922 | 0.051 | <0.001 | |
| BEF stem | 833 | 1.305 | -0.381 | 0.796 | 0.081 | 0.003 |
| 1000 | 1.473 | -0.421 | 0.88 | 0.065 | <0.001 | |
| 1250 | 1.311 | -0.385 | 0.909 | 0.051 | <0.001 | |
| 1667 | 1.183 | -0.318 | 0.944 | 0.033 | <0.001 | |
| 2000 | 1.305 | -0.354 | 0.849 | 0.063 | <0.001 | |
| 2500 | 1.381 | -0.402 | 0.911 | 0.053 | <0.001 |
Fig. 7 - Age-dependent functions of crown and stem BEFs in plots with 1667 trees ha-1 at time of planting (the trend is the same for all the plots).
Discussion
Biomass stock
The Douglas-fir plantation has a total above-ground carbon stock of 197 Mg C ha-1 at the age of 40, and a mean annual CO2 sequestration of 18 Mg ha-1 y-1. Based on these estimations, we may consider the Douglas-fir plantation as a carbon sink.
Above-ground biomass was statistically correlated to planting density at young ages (up to 25 years), whereas at older ages the correlation disappeared. Therefore we infer that the total biomass production is not influenced by differing planting density over such a long period of time. Results should be interpreted in different ways if we consider the short-term and the long-term period. On a short term basis it seems that low planting densities lead to lower carbon stocks and lower carbon uptake than high planting densities. In lower density plots mean annual increments increased over time, and at the age of 40 stands with 833-1250 trees per hectare still produced high mean increments of biomass, while stands with higher tree density had already showed lower mean annual increments nearly five years earlier. Nevertheless, plots with 2000 trees ha-1, both at young and old ages, showed higher stand volume mean annual increments and higher biomass stock, along with 1000 trees ha-1 plots.
Studies on the growth of spruce stands of different initial density (e.g., [32]) report that the denser is the stand, the more intensive is self-thinning and differentiation of trees, and that the volume and its maximum increment with age is observed in thinner stands, since the denser is the stand, the earlier this culmination occurs. This is evident in plots with 2500 trees ha-1 analyzed in the present study, where at age 40 a mortality of 62% and a stand volume of 831 m3 ha-1 were detected, against plots with 1000 trees ha-1 where mortality at age 40 was recorded as 19% and stand volume resulted to be 855 m3 ha-1 (Tab. 1).
In the context of carbon stocking if the harvest is planned when the stand is 15-25 years old, high density plots can ensure high carbon stock in the short space of time considered, although this means that wood quality would be poorer. Such young plantations with high tree-density, over few years, both in rural and urban areas, greatly contribute to the creation of many environmental benefits, like CO2 sequestration ([33]) and the mitigation of air pollution ([17], [31]). Regardless the length of cutting cycles, planting density could be on average 2000 trees per hectare in order to ensure high biomass production rates, more CO2 sequestration and trees with good bio-mechanical characteristics, less susceptible to snow damages and rooting out. If cutting cycles are longer, 1000-1200 trees per hectare could also be a valid choice. Trees would be well formed and stable, with good wood quality ([8]) and carbon stock would not be influenced by planting density.
Biomass partitioning
According to the hierarchy priority theory of biomass partitioning, stem growth has a lower priority than foliage and fine root ([51], [38]). Stand density is a factor that has a significant influence on stand carbon allocation, since it is known to affect tree crown morphology, which in turn influences the carbon allocation among stems, foliage, and branches ([16]). These relations are complex because both stand structure and productivity are associated with differences in age and site quality ([1], [30]). As planting density increases, both aboveground and belowground intraspecific competition increases, potentially changing partitioning priorities ([3]), slowing individual tree DBH growth, leading to the live crown receding, which becomes smaller in relation to the stem volume. Light penetration, height growth, crown lifting, and inter-crown abrasion simultaneously influence the canopy structure ([12]). Canopy size (leaf biomass or leaf area) drives both radiation interception and photosynthetic surface area. Owing to more horizontal space availability in low density plots, trees develop wide crowns, partitioning a larger proportion of biomass into branch support because branches are longer, and more foliage is located further from the stem ([19]). Crown growth rates are further enhanced by a long growing season, favorable temperature regime and soil moisture conditions, and a lack of disease and insect problems. In low planting density plots biomass allocated to crown represents an important component of above-ground biomass for all the ages of the stand. In plots of 1000 trees ha-1, at age 40 the above-ground biomass stock is the same that in plots of 2000 trees ha-1, although the crown compartment in the latter contributes only to 31% of total biomass, whereas in 1000 trees ha-1 plots it contributes to nearly 37%. In high planting density plots, after the onset of competition at crown closure, biomass allocated to crown decreases, since foliage is driven to the top of the canopy as a result of the natural pruning of lower branches ([36]). Both the crown midpoint and the stem increase their height so that more carbon is needed to be allocated to stem to transport the same amount of water to the foliage, increasing the carbon sink strength of the stem ([13]). Even if the individual stems allocate more carbon, the loss due to self-thinning reduces this carbon sink potential so that, at older ages of plantations, differences in stem biomass increments between denser and sparser stands are no more significant.
Age-dependent BEFs
The quantification, reporting and verification of carbon sequestered by forests are frequently not as transparent as it should be, and this has major implications on policy decisions regarding forest conservation and management ([9]). Availing of the allometric equations built for the area under study is a big challenge for improving our knowledge of the carbon cycle in forest ecosystems. When no site/species or forest type specific allometric models are available, it is also possible to use biomass expansion factors, even if conversion from stem volumes into whole-tree biomass is one of the notable sources of error in forest carbon inventories ([45]). The aboveground biomass of forests is often estimated with constant BEFs based either on national studies or IPCC defaults ([22]), although it is well known that the relative proportions of canopy and stem in the total mass vary over the stand development ([44]). According to IPCC ([22]), the uncertainty involved in using generic BEF is approximately 30%, but few authors found errors up to 70% ([41]). Because trees demonstrate different biomass allocation patterns and adaptive strategies in response to abiotic factors such as temperature, water and nutrients, BEFs are hypothesized to vary with forest types and abiotic factors, although such variation has not been well examined to date ([50]). Major changes in silvicultural practices that might lead to changes in tree allometry, affecting diameter distributions and stocking density of the stands, could also influence BEF values. The results of this study showed that BEFs expressed as ratio of biomass to volume varied with age and with planting density at the same age, confirming that the adoption of constant BEFs is limiting and misleading. BEFs determined in this study differed from BEFs published for Douglas-fir by other authors. Levy et al. ([29]) report a mean value of above-ground BEF of 1.38, which is higher than that found in this study. However, no specific works on BEF have been carried out so far for Mediterranean Douglas-fir plantations or in similar conditions, so a comparison is unfeasible.
Variation of BEF also occurred in the compartment level. In all plots stem, crown and total above-ground BEFs decreased over years, but they resulted different between differing planting density plots. BEFscrown had higher values in thinner plots, whereas BEFsstem were higher in denser stands. As reported by other authors ([11]) BEFscrown decreased with increasing density, and BEFsstem increased with increasing density. Generally, BEF values are high at low stand growing stem volumes or biomass, and decrease to a constant BEF at a high stand growing stem biomass. The size-dependent pattern in BEF is generally expected to be similar to what happens for basic wood density. Such patterns have been reported by Lehtonen et al. ([28]) and Kauppi et al. ([24]). These results can be explained by the fact that trees grown in low-density stands usually contain relatively more biomass in branches and foliage than trees grown in high-density stands. When canopies become closed, the stems continue to accumulate dry matter, but as new branches and foliage are grown the oldest die and fall off ([24]). The decline in BEF may be associated with changes in biomass allocation in younger stands, such as a greater increment in stem wood, relative to non-woody biomass.
The differences in the variation of BEFsstem between differing planting densities can be also accounted for by the influence of stand density on wood basal density and tree rings width. The difference in wood density and its radial trends reflect growth strategy and biomechanical considerations. Such variations in wood basal density are not considered when constant BEFs from inventory are applied, but it varies among tree compartments and it largely depends both on density and on environmental conditions. Somogyi et al. ([47]) suggest adopting various correction factors to use the density of the appropriate components of tree to convert volume to biomass.
When selecting or developing BEF values, care should be taken that they are representative of the forest population to which they will be applied, with respect to the species and according to tree size. The relative share of biomass components (e.g., foliage and branches) varies during stand development, according to age ([28]), fertility ([52]) and stand density ([11]).
Conclusion
It is fundamental to assess the carbon stock in these Mediterranean exotic species plantations whose original purpose was to ensure a prompt forest cover on abandoned land. Over the years they also provided high carbon uptake and protection from hydrogeological risks. The results of this study may be helpful for devising forest management strategies. Regardless of economic considerations, when the priority is to ensure high carbon stock, the planting density becomes a primary issue only if cutting cycles are very short.
The variability of BEF with age found in this study demonstrates that the use of constant BEF from national inventories can be misleading. Diameter distributions, age and stocking density of the stand affect the variation of BEFs. Therefore, the use of the conversion factors from national inventories, often based on relatively few sites sampled in various ecosystem studies, may lead to biased estimates of forest carbon stocks. As a consequence, the age-dependent BEF equations presented here are applicable to stands with similar diameter distribution and tree allometry, i.e., they could be applied to Douglas-fir forests aged between 15 and 40, with differing tree-density and spacing and with an average stock of biomass of 400 Mg ha-1.
References
Gscholar
Gscholar
Gscholar
Gscholar
Gscholar
CrossRef | Gscholar
Gscholar
Gscholar
Gscholar
Gscholar
Gscholar
Gscholar
Gscholar
Gscholar
Gscholar
Gscholar
Gscholar
Gscholar
Gscholar
Gscholar
Gscholar
Gscholar
Gscholar
Gscholar
Gscholar
Gscholar
Gscholar
Gscholar
Gscholar
Gscholar
Authors’ Info
Authors’ Affiliation
Giuliano Menguzzato
Department of Agraria, Mediterranean University of Reggio Calabria, loc. Feo di Vito, I-89060 Reggio Calabria (Italy)
Gaetano Pellicone
Antonella Veltri
ISAFoM, Institute for Mediterranean Agriculture and Forest Systems, CNR - National Research Council, I-87037 Rende (CS, Italy)
Department of Chemical and Environmental Engineering, University of Calabria, Campus di Arcavacata, I-87037 Rende (CS, Italy)
Corresponding author
Paper Info
Citation
Marziliano PA, Coletta V, Menguzzato G, Nicolaci A, Pellicone G, Veltri A (2015). Effects of planting density on the distribution of biomass in a douglas-fir plantation in southern Italy. iForest 8: 368-376. - doi: 10.3832/ifor1078-007
Academic Editor
Emanuele Lingua
Paper history
Received: Jul 18, 2013
Accepted: Jun 05, 2014
First online: Sep 09, 2014
Publication Date: Jun 01, 2015
Publication Time: 3.20 months
Copyright Information
© SISEF - The Italian Society of Silviculture and Forest Ecology 2015
Open Access
This article is distributed under the terms of the Creative Commons Attribution-Non Commercial 4.0 International (https://creativecommons.org/licenses/by-nc/4.0/), which permits unrestricted use, distribution, and reproduction in any medium, provided you give appropriate credit to the original author(s) and the source, provide a link to the Creative Commons license, and indicate if changes were made.

Web Metrics
Breakdown by View Type
Article Usage
Total Article Views: 44638
(from publication date up to now)
Breakdown by View Type
HTML Page Views: 37803
Abstract Page Views: 2223
PDF Downloads: 3468
Citation/Reference Downloads: 25
XML Downloads: 1119
Web Metrics
Days since publication: 3511
Overall contacts: 44638
Avg. contacts per week: 89.00
Article Citations
Article citations are based on data periodically collected from the Clarivate Web of Science web site
(last update: Feb 2023)
Total number of cites (since 2015): 20
Average cites per year: 2.22
Publication Metrics
by Dimensions ©
Articles citing this article
List of the papers citing this article based on CrossRef Cited-by.
Related Contents
iForest Similar Articles
Research Articles
Allometric relationships for volume and biomass for stone pine (Pinus pinea L.) in Italian coastal stands
vol. 6, pp. 331-335 (online: 29 August 2013)
Research Articles
Allometric equations to estimate above-ground biomass of small-diameter mixed tree species in secondary tropical forests
vol. 13, pp. 165-174 (online: 02 May 2020)
Research Articles
Allometric equations to assess biomass, carbon and nitrogen content of black pine and red pine trees in southern Korea
vol. 10, pp. 483-490 (online: 12 April 2017)
Technical Reports
Biomass equations for European beech growing on dry sites
vol. 9, pp. 751-757 (online: 17 June 2016)
Research Articles
Equations for estimating belowground biomass of Silver Birch, Oak and Scots Pine in Germany
vol. 12, pp. 166-172 (online: 15 March 2019)
Technical Reports
Allometric biomass and carbon factors database
vol. 1, pp. 107-113 (online: 09 July 2008)
Research Articles
Allometric models for estimating biomass, carbon and nutrient stock in the Sal zone of Bangladesh
vol. 12, pp. 69-75 (online: 24 January 2019)
Technical Reports
GlobAllomeTree: international platform for tree allometric equations to support volume, biomass and carbon assessment
vol. 6, pp. 326-330 (online: 18 July 2013)
Research Articles
Methods for biomass stock estimation in Mediterranean maquis systems
vol. 10, pp. 108-114 (online: 21 August 2016)
Research Articles
Tree biomass and carbon density estimation in the tropical dry forest of Southern Western Ghats, India
vol. 11, pp. 534-541 (online: 01 August 2018)
iForest Database Search
Search By Author
Search By Keyword
Google Scholar Search
Citing Articles
Search By Author
Search By Keywords
PubMed Search
Search By Author
Search By Keyword


