Spectral reflectance properties of healthy and stressed coniferous trees
iForest - Biogeosciences and Forestry, Volume 6, Issue 1, Pages 30-36 (2013)
doi: https://doi.org/10.3832/ifor0709-006
Published: Jan 14, 2013 - Copyright © 2013 SISEF
Research Articles
Collection/Special Issue: IUFRO 7.01.00 - COST Action FP0903, Kaunas (Lithuania - 2012)
Biological Reactions of Forest to Climate Change and Air Pollution
Guest Editors: Elena Paoletti, Andrzej Bytnerowicz, Algirdas Augustaitis
Abstract
This study investigates the properties of hyperspectral reflectance of healthy and stressed coniferous trees. Two coniferous tree species which naturally grow in Lithuania, Scots pine (Pinus sylvestris L.) and Norway spruce (Picea abies (L.) Karst.), as well as an introduced species, Siberian pine (Pinus sibirica Du Tour), were selected for the study. Hyperspectral reflectance data were collected under laboratory conditions by scanning the needles of healthy (no foliar loss) and stressed Norway spruce (foliar loss 66-70%), Scots pine (foliar loss 71-75%) and Siberian pine (foliar loss 86-90%) trees using a Themis Vision Systems VNIR 400H hyperspectral imaging camera. The spectrometer of the camera covers the spectral range of 400-1000 nm with the sampling interval of 0.6 nm. Simultaneously, the chlorophyll a and b content in the needles was determined by spectrophotometrically measuring the needles’ absorbance of ethanol extracts. The statistical analyses included principal component analysis, analysis of variance and partial least squares regression techniques. Relatively large spectral differences between healthy and stressed trees were detected for Norway spruce needles: 884 out of 955 wavebands indicated a statistically different reflectance (p<0.05). The reflectance associated with the stress level was statistically different (p<0.05) in 767 and 698 out of 955 wavebands for Scots pine and Siberian pine, respectively. The most informative wavelengths for spectral separation between the needles taken from healthy and stressed trees were found in the following spectral ranges: 701.0-715.7 nm for Norway spruce, 706.1-718.2 nm for Scots pine, and 862.3-893.1 nm for Siberian pine. The relationship between the spectral reflectance properties of the needles and their chlorophyll content was also determined for each species. Waveband ranges (as well as single bands) most sensitive to changes in chlorophyll content were: 709.9-722.1 nm (715.6 nm) for Norway spruce; 709.3-721.4 nm (715.0 nm) for Scots pine; 710.6-722.7 nm (720.1 nm) for Siberian pine. In general, the study revealed that narrow-band based hyperspectral imaging has the potential for accurately detecting stress in coniferous trees.
Keywords
Conifers, Imaging Spectrometry, Hyperspectral Reflectance, Tree Stress, Waveband Selection
Introduction
Systematic forest health monitoring has been conducted in Europe for almost three decades. In 1985, the International Co-operative Programme on Assessment and Monitoring of Air Pollution Effects on Forests (ICP Forests) was launched under the Convention on Long-range Transboundary Air Pollution of the United Nations Economic Commission for Europe (UNECE) and standardized methods for forest monitoring were defined ([14]). Also, in 1998, Lithuania started a regular forest monitoring program using ICP methods and standards. Forest monitoring is performed using a network of observation plots scattered across the country. Crown defoliation is one of the principal indicators of tree health ([27]). Tree defoliation is visually assessed by comparing the foliage loss of an individual with a healthy reference tree of the same crown type in the vicinity using 5% units. The reference tree is based on a photograph of a local tree, representing a tree with full foliage, or a conceptual (imaginary) tree ([11]). Defoliation assessment, therefore, relies on the experience and skills of the observer and tends to have some level of subjectivity.
Instrumental measurements of tree crown defoliation would substantially reduce the intrinsic subjectivity of defoliation assessments ([2], [3], [24]). Numerous studies have investigated the potential application of ground-based, airborne or spaceborne remote sensing techniques to assess tree defoliation. One example of ground-based instrumental measuring of defoliation includes the use of semi-automatic image analysis systems to assess crown transparency from photographs based on fractal analysis ([26]). Satellite and airborne remote sensing can also provide an alternative to traditional ground-based assessments of forest health ([9], [32], [43]). However, assessing defoliation in this way may be difficult because of the associated costs of image acquisition, methodological issues in data processing, limited spatial, radiometric and temporal resolutions. Despite the numerous studies discussing the role of remote sensing in forest health assessment, very few examples of truly operational techniques are demonstrated. However, multispectral imaging, or more specifically, hyperspectral remote sensing, appears to have a strong potential for forest health assessment ([13], [33], [8]).
Research in the field of hyperspectral imaging for forestry applications has increased significantly during the last decade. Hyperspectral imaging is expected to prove very useful in the remote identification of forest tree species as well as in the evaluation of forest health. Furthermore, with the advent of a new generation of hyperspectral cameras, such as the VNIR400H used in this study, the potential use of hyperspectral imaging for forest health monitoring should be investigated.
Hyperspectral remote sensing, also called “hyperspectral imaging” or “imaging spectrometry”, is based on a combination of imaging and spectroscopy in a single scheme. Hyperspectral sensors are instruments that acquire images of an object in very many and very narrow (nanometre level) contiguous spectral bands. Depending on the construction, they can sense the electromagnetic waves in the ultraviolet, visible, near infrared, mid infrared and even thermal ranges of the electromagnetic spectrum. These instruments can collect from hundreds to more than a thousand bands of data for every pixel of an image. Hyperspectral sensing has the potential for precise identification, discrimination, and classification of various objects and their features. For example, an object in a hyperspectral image can be classified according to its physiological, chemical and other type of physical characteristic. Hyperspectral remote sensing involves hundreds of wavebands and very narrow spectral intervals, typically leading to large volumes of data. Furthermore, neighbouring wavebands have a high degree of correlation, resulting in informational redundancy ([35]) created by oversampling. Spectral signals are sampled at very small steps to allow for the discrimination of very narrow spectral features ([30]). Researchers dealing with hyperspectral data face new challenges such as the treatment of high-dimensional data and a requirement for extensive computation capacity and data storage ([37]).
Research related to the spectral reflectance properties of trees (at the leaf, crown or entire stand level) has been conducted for several decades. Numerous studies have shown that reflected electromagnetic radiation recorded in narrow spectral bands can provide informative data about the condition of plants and how plants change over time, and also enable a researcher to remotely analyze the plants’ physiological characteristics and chemical properties ([13], [18], [23], [8], [39]). Studies on the application of hyperspectral imaging can be divided roughly into two categories: (1) employment of airborne or spaceborne hyperspectral sensors - in this case the hyperspectral images are acquired for relatively large areas and the analyses focus on the various approaches to identification, discrimination or classification; (2) exploration of in situ acquired hyperspectral data collected under field or laboratory conditions. Here, the focus is on the spectral portion of the hyperspectral cubes, recorded for relatively small objects such as a single plant, branch or leaf, usually with the aim of investigating which portion of the spectrum or even which separate waveband or wavebands contribute most to the spectral separability of different plant species, their condition or chemical constituents. Studies focused on hyperspectral data at the single plant level show that field or laboratory acquired hyperspectral measurements can significantly contribute to determining a plant’s level of stress ([1], [31], [23], [39]). The spectra obtained in situ are fundamental in the building of spectral libraries, such as a set of laboratory spectra for various materials. Developing spectral libraries is fundamental to improving the full mapping potential of hyperspectral data ([45], [21], [25]).
Hyperspectral imaging techniques can identify the optical properties of forest decline and serve to explore the relationship between optical and spectral data to assist in the identification of properties related to the health assessment of a tree ([38], [36]). While foliar chlorophyll (as well as carotenoids) concentrations typically decrease when plant stress level increases, additional constituents accumulate within the leaves. Such changes affect leaf spectral properties and provide the possibility of remotely diagnosing a plant’s stress level ([29], [22], [10], [44], [20]). The reflected radiation of the visible and near infrared portions of the electromagnetic spectrum has proven to be the most important in detecting plant stress ([16]). Changes in leaf chlorophyll and water content significantly affect leaf reflectance. Chlorophyll is the most important factor, which affects leaf reflectance in the visible and near-infrared spectra ([6]). The reflectance increases in the 700-1300 nm range due to light scattering from the internal structure of leaves. The differences in reflectance properties between healthy and damaged plants are most observable in the green peak and red edge ([7], [16]). The red edge is where the reflectance curve increases at the margin between the chlorophyll absorption zone in red wavelengths and the light scattering zone in the near-infrared wavelengths. The position of the red edge is considered to be stable across different plant species and ranges from 680 nm to 750 nm ([17]).
In Lithuania, spectral measurements of forest trees in relation to their health status were conducted more than two decades ago using what is now considered an outdated spectral radiometer technology. Only an average reflectance curve for the object being sensed was possible at that time. The research mainly focused on the spectral measurements of needles and branches of Norway spruce (Picea abies Karst.) and Scots pine (Pinus sylvestris L.) with different levels of crown defoliation. The most effective spectral zones for defoliation assessment were determined and some methodological solutions for improving the process of spectral measurement were suggested ([28]). However, since then, no other research on spectral properties of forest trees has been conducted in Lithuania.
This paper describes the initial results of a study using hyperspectral imaging to acquire and use reflectance data at the plant level in Lithuania. The study focuses on the ability of hyperspectral data to discriminate between healthy and stressed Scots pine, Norway spruce and Siberian pine (Pinus sibirica Du Tour) trees. Scots pine and Norway spruce are the most common and commercially important tree species in Lithuania. Scots pine stands make up 35.3% and Norway spruce 20.8% of the total forest area ([34]). The introduced Siberian pine, used only in urban areas for landscape design, was also of interest. The objectives include:
- Verifying the significance of spectral differences between healthy and stressed Norway spruce, Scots pine and Siberian pine using hyperspectral imaging techniques.
- Determining the wavebands which best represent the spectral differences between Norway spruce, Scots pine and Siberian pine (stressed and healthy).
- Examining the relationships between the spectral reflectance properties of the needles of Norway spruce, Scots pine and Siberian pine and their chlorophyll content, and determining the wavebands that are most effective in discriminating between the chlorophyll content in the needles of stressed and healthy Norway spruce, Scots pine and Siberian pine.
Materials and Methods
Samples of healthy (no foliar loss or other visible symptoms of tree stress or disease) and stressed Norway spruce (yellowish green needles, foliar loss 66-70%) and Scots pine (yellowish green needles, foliar loss 71-75%) were collected in a 20-year-old mixed Norway spruce-Scots pine stand. A part of this healthy stand portion (~ 0.2 ha) suffered from temporal flooding which consequently resulted in heavily stressed trees with high levels of foliar loss. Samples of healthy (no foliar loss or other visible symptoms of tree stress or disease) and stressed (brownish- green needles, foliar loss 86-90%) Siberian pine of similar age were collected in urban environments since this species is exclusively used for landscape design and is not naturally found in Lithuanian forests.
The middle-upper part of the crown of each tree was easily accessible from the ground and therefore sample branches from the outer crown were cut using a telescopic cutter. Three trees for each species and for each condition were selected for sampling. Nine sample branches were cut from the southern side of the crown of each tree. A total of 27 samples were collected representing each tree species condition (healthy and stressed). Samples were taken in January 2012. Cut samples were packed into plastic bags with some added snow for sample preservation. Bags were labeled, put into portable cooler bags and transported to the laboratory for immediate spectral measurements.
The scanning process was conducted using a new generation Themis Vision Systems LLC hyperspectral camera VNIR400H (Bay St. Louis, MO, USA). This device was equipped with a highly sensitive VNIR spectrometer capable of covering the spectral range of 400-1000 nm with a sampling interval of 0.6 nm, producing 955 spectral bands. The spatial data of each scanned sample was recorded in a charged-coupled device (CCD) array with a 1392 × 1000 pixel resolution (pixel size was 6.45 μm × 6.45 μm). The camera, using a field of view of 30 degrees, was mounted on a copy stand and was oriented in the nadir position with the lens fixed at 33 cm above the sample. Two 100 W halogen lamps, which can provide stable electro-magnetic radiation in the 400-1000 nm range, were used for sample illumination. The halogen lamps were fixed symmetrically at both sides of the camera’s lens and illuminated the sample allowing their light beams to crisscross above the sample. The scanning room was darkened to avoid unrelated spectral signals from ambient light sources.
Hyperspectral image acquisition was executed by locating sample branches only on last year’s sprouts and harvesting every needle from them. The needles were then spread on top of a plate painted matt black so that the background plate was fully covered by needles. The spectral response of each needle sample was recorded four times. The background plate was rotated 90 degrees horizontally after every hyperspectral sample to correct for the bidirectional reflectance distribution. These steps were repeated for all samples resulting in raw hyperspectral images of needle samples (four for each separate sample).
Next, the radiance curve was converted to a reflectance curve for each image pixel. Completed target measurements were compared against the ones of a reference panel of known spectral reflectance (Avian Technologies LLC 99% white reference panel). The spectrometer internal current (dark current) was also corrected. The resulting spectra were then smoothed using the Savitzky-Golay filter function with a 4th-order polynomial fit and 25 data points. The steps above were repeated for each hyperspectral image that was then cropped (100 × 100 pixels).
Finally, four reflectance curves were derived from the four needle sample images and then averaged to construct a single reflectance curve for each sample. A total of 162 reflectance curves were constructed (54 for each species). Each reflectance curve was treated as a series of numbers (reflectance coefficients) and was used for statistical analyses.
Statistical Analyses
The distribution of the spectral responses at every spectral band was tested for normality using the Shapiro-Wilk test (α = 0.05) and the homogeneity of the variance was checked using Levene’s test (α = 0.05). The spectral data at every spectral band (p > α) and for all species investigated were homoscedastic and normally distributed.
Student’s t-test was applied to compare the spectral responses of both healthy and stressed trees of the same species to determine whether the reflection values of samples of stressed trees were statistically different from healthy trees at every spectral band. The null hypothesis H0: μhealthy = μstressed was compared to the alternative hypothesis H1: μhealthy ≠ μstressed, where μ was the mean reflectance value of the species compared. Then the hypothesis test was carried out using two sample t-tests for all 955 spectral bands (α = 0.05). The t-test was also used to select the spectral bands that helped distinguish between healthy and stressed trees of corresponding species (spectral bands with the lowest p-values are most separable). The ten bands with the lowest p-values were selected for having high separability power and the spectral band with the lowest p-value was selected for being the most effective at separating healthy and stressed trees.
Principal component analysis (PCA) was employed to search for trends in differences between the healthy and stressed tree needle samples for each tree species. The non-linear iterative partial least squares (NIPALS) algorithm was employed in calculations ([40], [41]). In this study, principal component analysis was used to compute the contribution of the reflectance coming from each wavelength to the principal components. Wavebands were treated as independent variables. The reflection data of all 54 samples (27 for healthy and 27 for stressed trees) of each tree species were analyzed. The data were pre-processed using unit variance scaling and mean-centering procedures. Component loadings represented the relative grade to which each variable (waveband) explained the relationship between the component and sampled stress level. If the component covers a significant portion of the overall data variance that is related to the differentiation of stress levels, then the wavebands with highest loadings on that component are well-suited for stress level differentiation. The 20 wavebands with the highest loadings to PC1 and PC2 were selected to display the spectral ranges.
The needle chlorophyll (a + b) content was spectrophotometrically determined in a laboratory by measuring the needle absorbance of ethanol (96.3%) extracts. A Student’s t-test was used to test for a statistical difference between the measured chlorophyll content of healthy and stressed needle samples (Tab. 1).
Tab. 1 - Measured average chlorophyll (a + b) content in the needle samples of healthy and stressed trees. (SD): standard deviation.
| Tree species | Chlorophyll content (mg/g fw, ± SD) |
Statistical difference (p value) |
|
|---|---|---|---|
| Healthy | Stressed | ||
| Norway spruce | 3.90 ± 0.06 | 2.73 ± 0.07 | 3.09 × 10- 09 |
| Scots pine | 2.77 ± 0.06 | 1.78 ± 0.04 | 1.40 × 10- 09 |
| Siberian pine | 2.19 ± 0.07 | 1.88 ± 0.04 | 0.01 |
The partial least squares regression (PLSR) was used to select the most informative wavelengths with regards to needle chlorophyll content. PLSR is well suited to analyze a large array of related predictor variables (i.e., not truly independent), with a sample size not large enough compared to the number of independent variables ([4], [42]). PLSR models were built independently for the three tree species. The values of one attribute (chlorophyll content of the 54 healthy or stressed needle samples) of the data set were used to represent the dependent variable (Y) and the wavelength reflectance values of the 54 healthy or stressed needle samples represented the independent variables or the predictors (X). The data were pre-processed using unit variance scaling and mean-centering procedures. The R2Y (multiple correlation coefficient), Q2 (leave-one-out cross-validation R2Y) and root mean square error of estimation (RMSEE) were calculated for each model to check the fit and the predictive ability of the models. All three models were also validated using external data sets created by randomly selecting 30 % of samples from initial data sets. The root mean square errors of prediction (RMSEP) were estimated to check the predictive power of the models. The wavebands with variable importance in the projection (VIP) scores > 1 were selected for construction of reduced PLSR models. These models employed the spectral responses of only these bands predictors (X). R2Y, Q2 and RMSEP for the reduced PLSR models were calculated following the same procedures as stated above.
After comparing both types of the models (involving full range of wavebands and reduced range of wavebands), the ones with higher values of Q2 and lower values of RMSEP were selected for identification of the wavelengths most sensitive to chlorophyll content. The wavelengths most closely related to chlorophyll content were identified by their VIP scores. The wavelengths that corresponded to the highest values of VIP scores were retained for each tree species. The first 20 bands with the highest VIP scores were retained for their sensitivity in detecting changes in chlorophyll content for each tree species.
Statistical analysis was performed using SPSS version 16.0 (SPSS Inc.) and Simca version 13.0 (Umetrics AB).
Results
Results from the Student’s t-tests indicated the means of reflectance values of healthy and stressed sample trees were statistically different for the majority of spectral bands. The largest relative spectral differences between healthy and stressed trees were observed for Norway spruce: the means of reflectance values were significantly different (p-values < 0.05) on 884 out of 955 (93%) wavebands, while 767 out of 955 (80%) for Scots pine and 698 out of 955 (73%) for Siberian pine were significantly different. Tab. 2 lists the ten most sensitive bands of the spectral range for separating healthy and stressed trees for each species.
Tab. 2 - Separability of healthy and stressed tree needles (Student’s t-test).
| Tree species | Number of spectrally different (p<0.05) spectral bands (total: 955) |
Most informative spectral range for tree stress identification |
Most informative wavelength for tree stress identification (smallest p-value) |
|---|---|---|---|
| Norway spruce | 884 | 709.9-715.7 nm | 713.1 nm |
| Scots pine | 767 | 708.6-714.4 nm | 711.2 nm |
| Siberian pine | 698 | 862.3-868.1 nm | 864.2 nm |
The PCA indicated that the first two principal components explained more than 90% of the variance in the samples of spectra investigated (Tab. 3). Therefore, only the first two principal components (PC1 and PC2) were selected for evaluating the contribution of wavelengths to the separation of healthy and stressed trees (Fig. 1).
Tab. 3 - Most informative spectral ranges and bands for separation between healthy and stressed tree needles (principal component analysis).
| Tree species | Percentage of variability explained by |
Spectral range with highest factor loadings to |
Wavelength with highest factor loading to |
|||
|---|---|---|---|---|---|---|
| PC1 | PC2 | PC1 | PC2 | PC1 | PC2 | |
| Norway spruce | 63 | 33 | 701.0-713.1 nm | 706.1-718.2 nm | 707.4 nm | 712.5 nm |
| Scots pine | 62 | 36 | 706.1-718.2 nm | 777.8-790.1 nm | 711.8 nm | 784.9 nm |
| Siberian pine | 93 | 6 | 880.9-893.1 nm | 706.1-718.2 nm | 884.8 nm | 712.5 nm |
Fig. 1 - Scores of principal component analysis for (a) Norway spruce; (b) Scots pine; (c) Siberian pine.
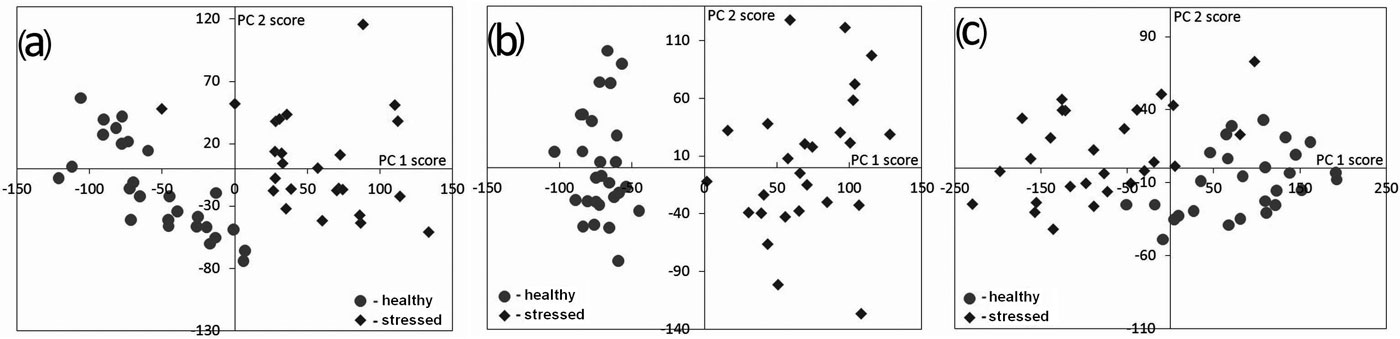
The selected spectral ranges and the spectral bands with the highest loadings to PC1 and PC2 are presented in Tab. 3. The principal component analysis was meant to support and validate the results of the Student’s t-test, but while the results were slightly different, they were not contradictory (Tab. 2 and Tab. 3). Norway spruce and Scots pine wavelengths in the red edge of the spectra were most closely correlated to both PC1 and PC2 (Tab. 3). However, the red edge was only a secondary factor in stress level separation (contributed to PC2 for Siberian pine). A portion of the near infrared spectrum was the primary detector of differences between healthy and stressed Siberian pine trees (largest loadings for PC1). Moreover, principal component analysis revealed a consistent range of wavelengths having the highest factor loadings either to PC1 or to PC2 for all tree species. The 706.1-718.2 nm spectral interval was strongly involved in the PC2 for Norway spruce and Siberian pine, but for Scots pine, in PC1 (Tab. 3).
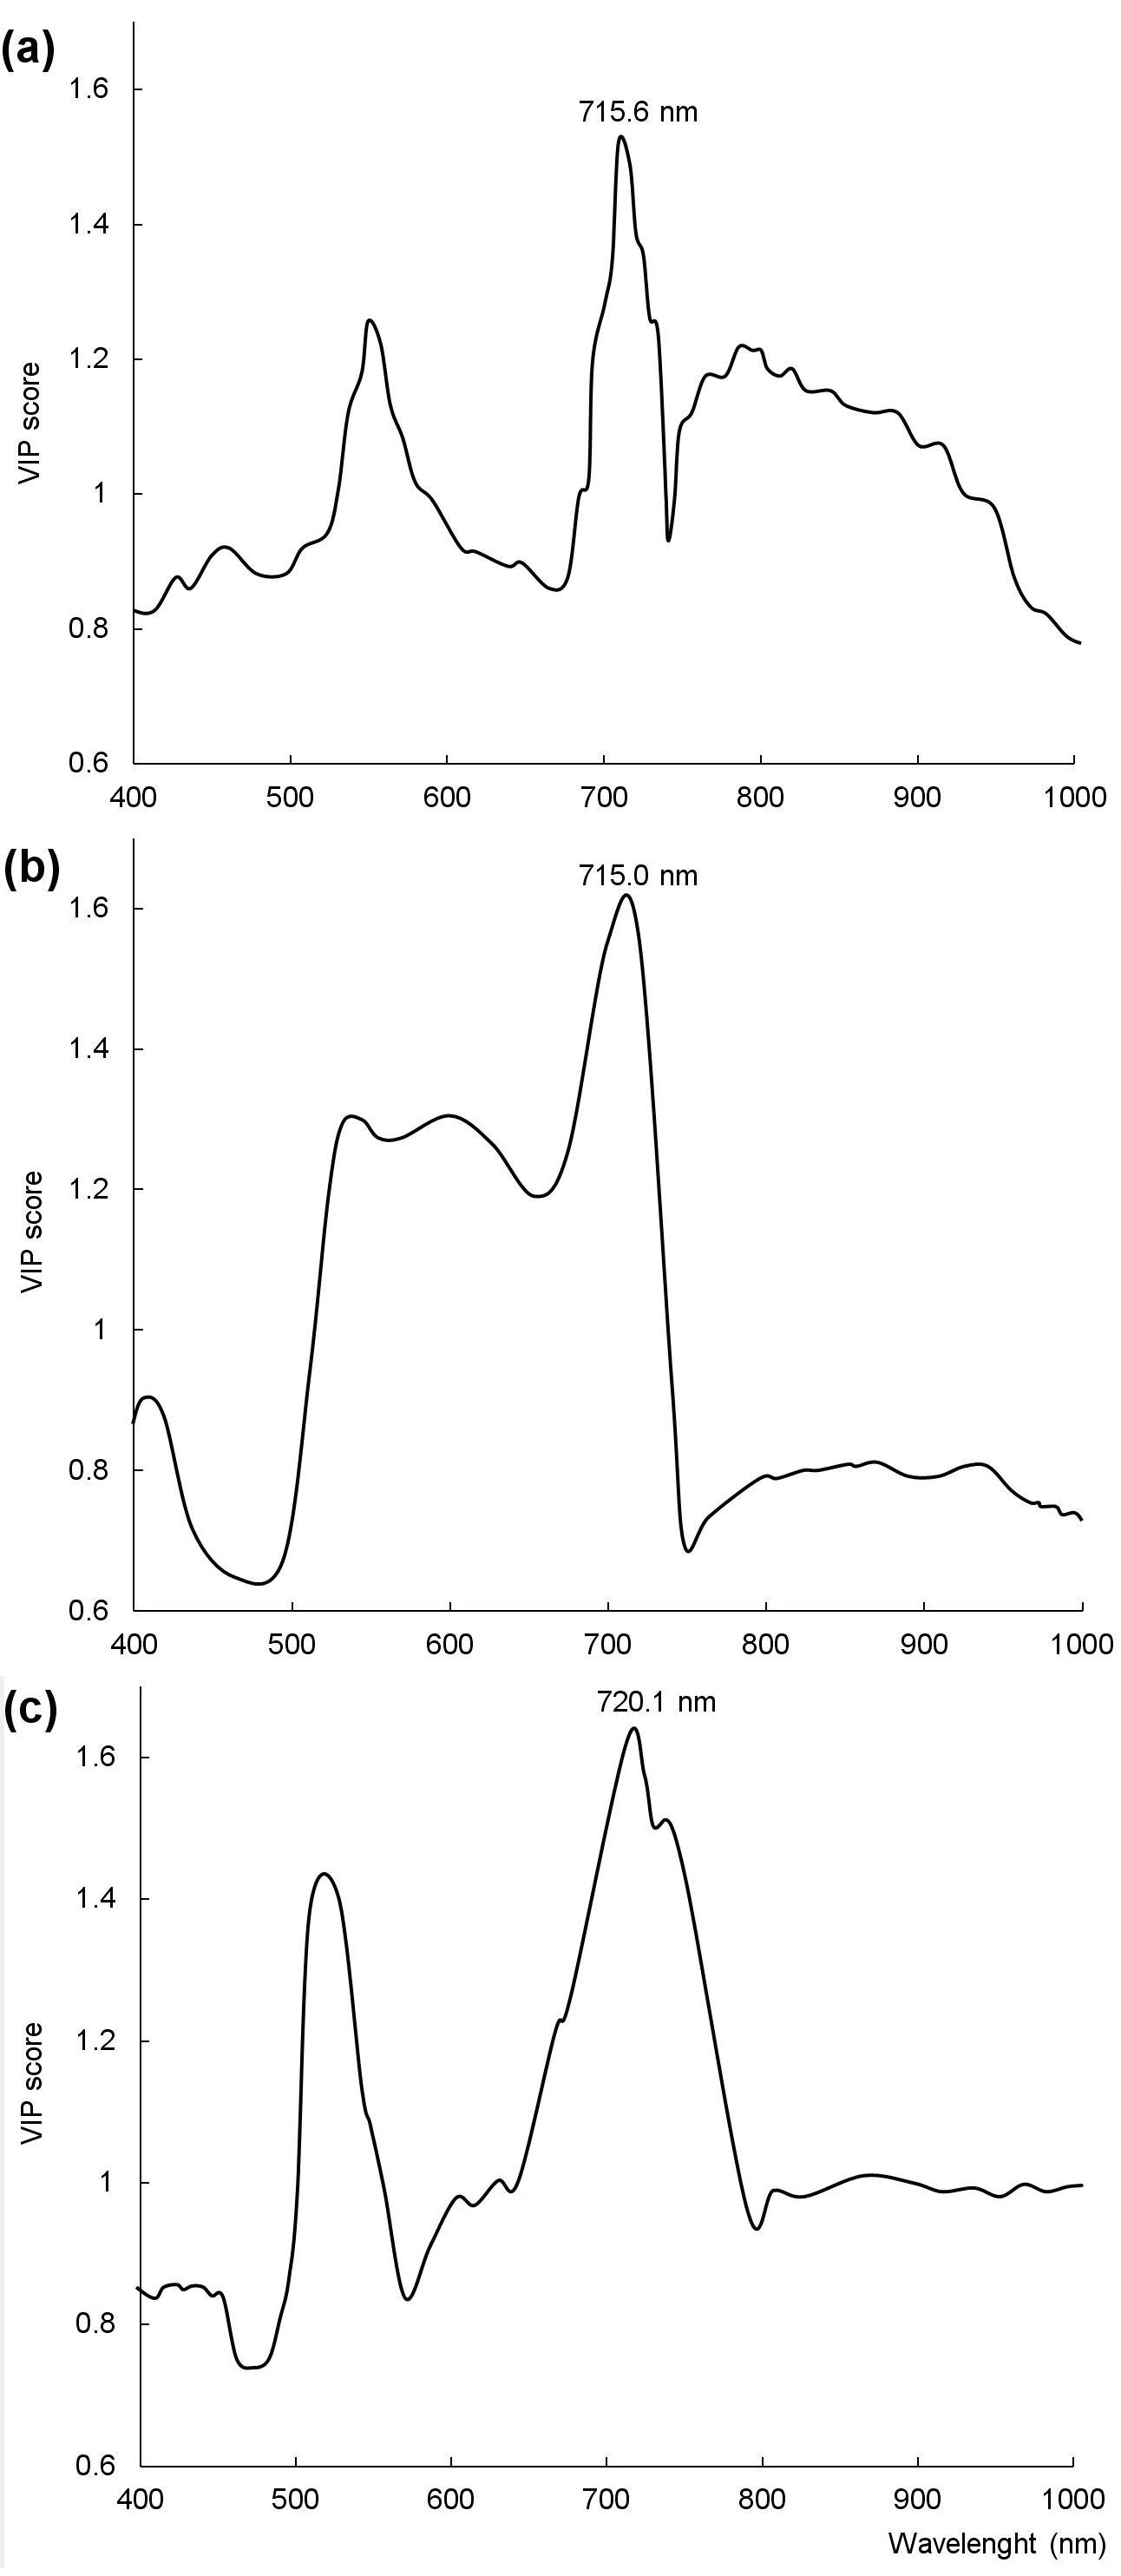
The PLSR models involving the full range of predictors indicated a strong potential accuracy to predict the chlorophyll content for Norway spruce and Scots pine, while moderate accuracy for Siberian pine (Tab. 4). VIP scores of these models discovered that 431, 378 and 459 bands out of 955 bands were the most important (VIP score >1) for chlorophyll content prediction for Norway spruce, Scots pine and Siberian pine, respectively. Reducing the number of wavebands did not improve the accuracy of the models (Tab. 4). PLSR models using the full range of wavebands for detecting which wavelengths are most tightly related to chlorophyll content were most successful. The wavelengths with the most discriminating power (the ones with the highest VIP scores) for distinguishing chlorophyll content in samples of healthy and stressed trees were 715.6, 715.0 and 720.1 nm for Norway spruce, Scots pine and Siberian pine, respectively (Fig. 2). The disparity of the most predictive wavelengths among all three species was less than 6 nm. The most sensitive spectral ranges to changes in chlorophyll content between healthy and stressed samples of each tree species were 709.9-722.1, 709.3-721.4 and 710.6-722.7 nm for Norway spruce, Scots pine and Siberian pine, respectively (Fig. 2). Waveband ranges that were most sensitive to changes in chlorophyll content were very similar for all three species and generally cover the range of 709.3-722.7 nm.
Tab. 4 - Characteristics of partial least squares regression modelling, including multiple correlation coefficient (R2Y), leave-one-out cross-validated multiple correlation coefficient (Q2), root mean square error of estimation (RMSEE), root mean square error of prediction (RMSEP), to predict the chlorophyll content in needles. For each table cell, upper figure refers to the full waveband model, lower figure refers to the reduced waveband model.
| Tree species | Number of observations |
Number of components |
Number of wavebands |
R2Y | Q2 | RMSEE | RMSEP |
|---|---|---|---|---|---|---|---|
| Norway spruce | 54 | 5 | 955 431 |
0.96 0.96 |
0.95 0.94 |
0.116 0.124 |
0.123 0.136 |
| Scots pine | 54 | 5 | 955 378 |
0.95 0.95 |
0.94 0.93 |
0.115 0.113 |
0.136 0.135 |
| Siberian pine | 54 | 5 | 955 459 |
0.75 0.73 |
0.55 0.58 |
0.067 0.069 |
0.083 0.088 |
Fig. 2 - Selection of wavelengths corresponding to the highest value of variable importance in the projection scores of partial least squares regression for: (a) Norway spruce; (b) Scots pine; (c) Siberian pine.
Discussion
We used the full range of data of all narrow wavebands recorded with a hyperspectral camera. In doing so, we avoided losing information that a single contiguous band might contain regarding the stress level of the studied objects. No effort was made to decrease data redundancy between adjacent bands.
This study revealed that most sensitive spectral ranges for tree stress identification are located at 701.0-715.7 nm for Norway spruce and 706.1-718.2 nm for Scots pine. Also, the partial least squares regression demonstrated that the red edge is the portion of the spectrum where wavelengths are most tightly related to the chlorophyll content. The wavelengths are located at 715.6 nm for Norway spruce, 715.0 nm for Scots pine and 720.1 nm for Siberian pine.
These results are reconcilable with other studies that found the red edge to be most informative in terms of its responsiveness to changes in chlorophyll content caused by plant stress. For example, Carter & Knapp ([5]) discovered that an increase in reflectance at 700 nm was the most consequential and most sensitive to plant stress. Their study involved the analysis of the impact of various stressors (such as diseases, insects, dehydration, competition, etc.) on the reflectance in the range of 400-850 nm for different species including loblolly pine (Pinus taeda L.), radiate pine (Pinus radiata D. Don), sweetgum (Liquidambar styraciflua L.), red maple (Acer rubrum L.), wild grape (Vitis rotundifolia Michx.), switchcane (Arundinaria gigantea (Walter) Muhl.) and longleaf pine (Pinus palustris Miller). Luther & Carroll ([19]) investigated foliar spectral reflectance of balsam fir (Abies balsamea (L.) Mill.) and found the reflectance in the red edge at 711 nm was most sensitive to stress. Eitel et al. ([12]) analyzed stress-induced variation in chlorophyll concentration for nursery-grown Scots pine seedlings. Accuracy of estimates improved after adding reflectance data in the red edge bands to the initially available spectral reflectance data. Entcheva-Campbell et al. ([13]) employed an airborne hyperspectral scanner and found the 673-724 nm range to be the most informative to initial damage of Norway spruce stands in the Czech Republic.
Nevertheless, the most sensitive wavelengths related to stress for Siberian pine were located in the near infrared zone spectra at 862.3-893.1 nm. The principal component analysis, however, proved that the 706.1-718.2 nm interval in the red edge was the second most important factor. This could suggest that changes in the reflectance of the near-infrared range of the spectra were caused by a significant alteration of the inner structures of the Siberian pine needles. This calls for a closer examination of the sample trees. As previously mentioned, sampled trees of stressed Norway spruce and Scots pine were sampled from a forested environment and their foliar loss was 66-70% and 71-75%, respectively. Stressed Siberian pines were sampled from an urban environment and, more importantly, their foliar loss was higher, 86-90%. The Siberian pine results demonstrate the importance of near infrared spectra in the detection of more heavily stressed plants.
In our particular case, the PLS regression results show that the wavelength ranges most sensitive to chlorophyll content were very similar for all three tree species and generally covered the range 709.3-722.7 nm. While most wavelengths detecting chlorophyll content differed depending on the particular species, the disparity was minimal (<6 nm). This complements the findings of Gitelson & Merzlyak ([15]) who identified the 700-710 nm range as most sensitive to leaf chlorophyll a concentration for horse chestnut (Aesculus hippocastanum L.) and Norway maple (Acer platanoides L.). Similarly, Datt ([10]) found maximum sensitivity of reflectance to variation in pigment content of leaves of various Eucalyptus species in the wavelength regions of 550 nm and 708 nm. Gitelson et al. ([16]) discovered that reciprocal reflectance in the spectral ranges of 520 to 550 nm and 695 to 705 nm related closely to the total chlorophyll content in leaves of Norway maple, horse chestnut, wild vine (Parthenocissus tricuspidata L.) and common beech (Fagus sylvatica L.). A spectral index developed by Malenovský et al. ([20]) was proposed to estimate the chlorophyll content of a Norway spruce crown. This index is based on the reflectance continuum removal of the chlorophyll absorption feature between the wavelengths 650-725 nm.
The results of this study suggest that refining the research capabilities of hyperspectral imaging for forest health monitoring in Lithuania could prove beneficial. While the elaboration of a diagnostic tool for remotely detecting stressed plants goes beyond the scope of this study, the technique employed here demonstrated the possibility of distinguishing extreme contrasts of plants stress levels. While this is a limiting factor in the treatment of the study results, the consistency of the results with regards to stress levels suggests that further studies are required to fully understand the relationships between tree stress (different levels of defoliation) and their reflectance properties. For example, more subtle spectral reflectance properties might be revealed when examining trees with lesser differences in stress level or ones with very similar defoliation but growing on different sites or of different age. With the advent of the new-generation hyperspectral cameras, this is a promising direction for future research.
Conclusions
The study revealed that a strong relationship exists between the spectral reflectance properties of Norway spruce, Scots pine and Siberian pine and their stress status. It also confirmed that the red edge is the most sensitive spectral zone for stress detection in two Lithuanian coniferous tree species, Norway spruce and Scots pine. The importance of near infrared spectra in the detection of heavily stressed coniferous trees should not be underestimated based on our findings for Siberian pine.
The 706.1-718.2 nm spectral interval was a consistently strong stress indicator wavelength for all tree species in this study, although it was of secondary importance in Norway spruce and Siberian pine.
The use of partial least squares regression models suggests that hyperspectral imaging is an effective remote sensing technique for predicting needle chlorophyll content because a strong relationship exists between the needle reflectance spectra of Norway spruce, Scots pine and Siberian pine and their chlorophyll content.
This study demonstrated the strong potential of narrow-band based hyperspectral imaging to detect the differences in reflectance properties of two categories of stress for Norway spruce, Scots pine and Siberian pine. It also set the direction for future research in the use of hyperspectral remote sensing to assess and monitor tree health.
Acknowledgments
The study was carried out within the framework of the national project No VP1-3.1-ŠMM-08-K-01-025 “Specific, genetic diversity and sustainable development of Scots pine forest to mitigate the negative effects of increased human pressure and climate change” supported by the EU Social Fund.
References
Gscholar
Gscholar
Gscholar
CrossRef | Gscholar
Gscholar
Gscholar
Gscholar
Gscholar
Gscholar
Gscholar
Gscholar
Gscholar
Gscholar
CrossRef | Gscholar
Gscholar
Gscholar
Gscholar
Gscholar
Authors’ Info
Authors’ Affiliation
G Mozgeris
Institute of Forest Management and Wood Science, Aleksandras Stulginskis University, Studentu str. 11, LT-53361 Akademija, Kaunas distr. (Lithuania)
Forest Monitoring Laboratory, Institute of Forest Management and Wood Science, Aleksandras Stulginskis University, Studentu str. 11, LT-53361 Akademija, Kaunas distr. (Lithuania)
Corresponding author
Paper Info
Citation
Masaitis G, Mozgeris G, Augustaitis A (2013). Spectral reflectance properties of healthy and stressed coniferous trees. iForest 6: 30-36. - doi: 10.3832/ifor0709-006
Academic Editor
Elena Paoletti
Paper history
Received: Jul 30, 2012
Accepted: Dec 19, 2012
First online: Jan 14, 2013
Publication Date: Feb 05, 2013
Publication Time: 0.87 months
Copyright Information
© SISEF - The Italian Society of Silviculture and Forest Ecology 2013
Open Access
This article is distributed under the terms of the Creative Commons Attribution-Non Commercial 4.0 International (https://creativecommons.org/licenses/by-nc/4.0/), which permits unrestricted use, distribution, and reproduction in any medium, provided you give appropriate credit to the original author(s) and the source, provide a link to the Creative Commons license, and indicate if changes were made.

Web Metrics
Breakdown by View Type
Article Usage
Total Article Views: 49874
(from publication date up to now)
Breakdown by View Type
HTML Page Views: 41814
Abstract Page Views: 2058
PDF Downloads: 4695
Citation/Reference Downloads: 38
XML Downloads: 1269
Web Metrics
Days since publication: 4113
Overall contacts: 49874
Avg. contacts per week: 84.88
Article Citations
Article citations are based on data periodically collected from the Clarivate Web of Science web site
(last update: Feb 2023)
Total number of cites (since 2013): 29
Average cites per year: 2.64
Publication Metrics
by Dimensions ©
Articles citing this article
List of the papers citing this article based on CrossRef Cited-by.
Related Contents
iForest Similar Articles
Review Papers
Accuracy of determining specific parameters of the urban forest using remote sensing
vol. 12, pp. 498-510 (online: 02 December 2019)
Technical Advances
Detecting mistletoe infestation on Silver fir using hyperspectral images
vol. 7, pp. 85-91 (online: 18 December 2013)
Review Papers
Remote sensing-supported vegetation parameters for regional climate models: a brief review
vol. 3, pp. 98-101 (online: 15 July 2010)
Technical Reports
Detecting tree water deficit by very low altitude remote sensing
vol. 10, pp. 215-219 (online: 11 February 2017)
Review Papers
Remote sensing of selective logging in tropical forests: current state and future directions
vol. 13, pp. 286-300 (online: 10 July 2020)
Research Articles
Assessing water quality by remote sensing in small lakes: the case study of Monticchio lakes in southern Italy
vol. 2, pp. 154-161 (online: 30 July 2009)
Review Papers
Remote sensing support for post fire forest management
vol. 1, pp. 6-12 (online: 28 February 2008)
Research Articles
Afforestation monitoring through automatic analysis of 36-years Landsat Best Available Composites
vol. 15, pp. 220-228 (online: 12 July 2022)
Technical Reports
Remote sensing of american maple in alluvial forests: a case study in an island complex of the Loire valley (France)
vol. 13, pp. 409-416 (online: 16 September 2020)
Research Articles
Development of monitoring methods for Hemlock Woolly Adelgid induced tree mortality within a Southern Appalachian landscape with inhibited access
vol. 9, pp. 178-186 (online: 02 January 2016)
iForest Database Search
Search By Author
Search By Keyword
Google Scholar Search
Citing Articles
Search By Author
Search By Keywords
PubMed Search
Search By Author
Search By Keyword


