Biodiversity and ecosystem functioning: exploring large-scale patterns in mainland China
iForest - Biogeosciences and Forestry, Volume 5, Issue 5, Pages 230-234 (2012)
doi: https://doi.org/10.3832/ifor0627-005
Published: Oct 02, 2012 - Copyright © 2012 SISEF
Short Communications
Abstract
Relationships between biodiversity and ecosystem functioning are vital to understand ecosystem properties, and have frequently been addressed in small-scale studies. However, interactions and changes differ at large scales, and should be similarly evaluated to monitor biodiversity and ecosystem functional alterations. In the present study, Mainland China was divided into 241 quadrats of 2° latitude by 2° longitude. Ecosystem function was comprehensively assessed using three indicator variables in each quadrat, primary productivity, bird species richness, and relative humidity. Relationships between each ecosystem function variable were regressed against seed plant species richness. All three indicators exhibited the same change model, a linear model when plant species richness was under 5.000 species, and a hump-back/quadratic model when seed plant richness was over 5.000 species, with an increase in seed plant species richness at a larger scale.
Keywords
Ecosystem function, Seed plants, Species richness, Model, China
Introduction
Ecosystem function is the capacity for natural processes and components integral to those processes to provide goods and services, which ultimately meet human needs, either directly or indirectly ([7]). Indirectly, these services provide refuge and reproductive habitat to wild plants and animals. Many studies have demonstrated the importance of biodiversity to ecosystem functioning, and primary productivity has been representative of ecosystem function ([31], [13]). Primary productivity is the rate at which plants and other photosynthetic organisms (e.g., phytoplankton, macroalgae) produce organic compounds i.e., biomass in an ecosystem.
A persistent debate continues regarding the relevance of studies that underlie the conclusions explaining biodiversity and functioning in mature natural ecosystems. Most experimental studies of constructed species assemblages determined that increasing diversity contributes to greater biomass production (e.g., [17], [29]). Alternatively, species reduction experiments in natural systems revealed biomass was resilient to decreased biodiversity ([28], [30]), while Foster et al. ([10]) demonstrated during species addition experiments that species pools or communities were integral to increased biomass. These experiments were comparatively small. For large-scale studies, the productivity gradient was very often associated with plant diversity. In most cases, a unimodal (also called “hump-back” or “humped-backed”) relationship emerged, which exhibited the highest productivity at intermediate diversity levels ([12], [21]). This approach rapidly gained enthusiastic popularity among ecologists, and was soon widely recognized as a general empirical relationship (e.g., [2]). Although later studies reported positive or negative response patterns, the unimodal relationship remains the most commonly reported in plants ([15], [33], [25], but see [11]).
In the present study, we explored the relationship between plant ecosystem biodiversity, and three potential ecosystem function indicators (primary productivity, bird species richness, and annual mean relative humidity) at a large scale in Mainland China.
Materials and methods
Mainland China was divided into 241 quadrats (including Hainan Island as one quadrat), each 2° latitude by 2° longitude (approximately 36 450 km2). If a quadrat had an area less than half a standard quadrat on national boundaries, it would be merged into its neighboring quadrat ([37]). A small geographic region such as a 2° latitude by 2° longitude quadrat would typically be characterized as a group of ecosystems ([37], [39]). However, ecosystems in the quadrats were similar in composition, structure, and inter- and intra-environments, and correspondingly similar in function ([38]). Therefore, for the purposes of this study, we assumed the relationship between biodiversity and ecosystem functions could be evaluated at the quadrat level. Seed plant and bird species occurring in each quadrat were counted based on available records (e.g., national flora and fauna, provincial flora, and local research literature, among other appropriate reference materials - [34], [35], [36], [6], [9], [26], [41]). Primary productivity of each quadrat was estimated by applying the following relationship (eqn. 1):
where E was obtained as follows (eqn. 2):
where L = 300 + 25T + 0.05T2, N is the annual precipitation, L is the annual maximum evaporation, and T the annual mean temperature in each quadrat (see [23], [22]). This equation was the best fit with least error in simulating primary productivity based on observed and remotely sensed data in China ([22]). For each quadrat, annual mean relative humidity, and climatic variables were obtained from 30-year records representing 830 county meteorological stations. Average values were used if more than one meteorological station was located in a quadrat; if no meteorological stations were present in a quadrat, data from the nearest station in its neighbor quadrat was selected.
Regression analysis was chosen to assess the relationships between plant species richness and ecosystem function indicators, and analyzed using the SPSS statistical package (SPSS Inc., Chicago, Illinois, USA). AIC (Akaike’s Information Criteria) was applied to compare different regression models as follows: AIC = 2k - 2 ln(L), where k is the parameter number, and L is the maximized value of the likelihood function in the regression model ([1]).
Results
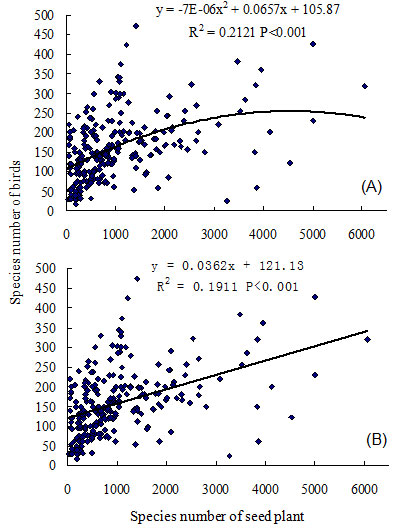
Linear and quadratic models were compared in an analysis of the following relationships: ecosystem primary productivity, bird species richness, and relative humidity, each against plant species richness. Results indicated quadratic models were more robust (with smaller AIC) when all quadrat data were used, but linear models were better (with smaller AIC) when the three highest quadrats were excluded from the analysis (Tab. 1). A linear model could be chosen when plant species richness is less than 5000 species, and the quadratic model could be applied when plant species richness exceeds 5000 species (Tab. 1). Ecosystem primary productivity was significantly associated with plant species richness; and a hump-back model relationship between primary productivity and seed plant species richness was evident (R2 = 0.6671, P < 0.001, n = 241 - Fig. 1). Primary productivity exhibited steep increases within the first 2000 seed plants, and continued to increase until reaching a maximum biomass of 2100 g m-2 at 3500 species (Fig. 1). Productivity decreased when the number of seed plants was over 4000 species. Bird species richness was also significantly correlated with plant species richness in mainland China (R2 = 0.2121, P < 0.001, n = 241 - Fig. 2). The number of bird species increased rapidly as seed plant species richness reached 1000 species; and subsequent slow increases occurred until reaching the maximum number of plant species (i.e., 5000). The relationship between bird and plant species richness also followed a loosely defined hump-back model.
Tab. 1 - Comparison of regression results of linear and quadratic models in the analysis of relations between primary productivity of ecosystem, species richness of bird and relative humidity with species richness of seed plant with and without the three highest quadrats in the mainland of China. (x): refers to species richness of seed plant; (Y): refers to primary productivity of ecosystem, species richness of bird and relative humidity respectively; (AIC): 2k - 2 ln(L), where k is the number of parameters in the regression model, and L is the maximized value of the likelihood function for the regression model.
| Variables | The 3 highest quadrats |
Model | Regression equation | R 2 | P | AIC | F | P |
|---|---|---|---|---|---|---|---|---|
| Primary productivity |
With | Linear model | Y = 0.4123x + 447.95 | 0.4995 | < 0.001 | 12.225 | 8.982 | 0.000 |
| Quadratic model | Y = -0.0001x2 + 0.9998x + 144.01 | 0.667 | < 0.001 | 12.065 | 10.437 | 0.000 | ||
| Without | Linear model | Y = 0.4909x + 385.46 | 0.5515 | < 0.001 | 11.405 | 8.78 | 0.000 | |
| Quadratic model | Y = -0.0002x2 + 1.1049x + 101.77 | 0.669 | < 0.001 | 12.032 | 10.302 | 0.000 | ||
| Species richness of bird |
With | Linear model | Y = 0.0362x + 121.3 | 0.1911 | < 0.001 | 10.563 | 8.523 | 0.000 |
| Quadratic model | Y = -7E-06x2 + 0.0657x + 105.87 | 0.2121 | < 0.001 | 9.887 | 8.987 | 0.000 | ||
| Without | Linear model | Y = 0.0356x + 121.54 | 0.1507 | < 0.001 | 9.538 | 8.736 | 0.000 | |
| Quadratic model | Y = -0.005x2 + 0.0934x + 94.844 | 0.2046 | < 0.001 | 10.203 | 9.02 | 0.000 | ||
| Relative humidity |
With | Linear model | Y = 0.0079x + 52.686 | 0.3453 | < 0.001 | 8.683 | 9.868 | 0.000 |
| Quadratic model | Y = -3E-06x2 + 0.0198x + 46.547 | 0.4727 | < 0.001 | 8.657 | 7.986 | 0.000 | ||
| Without | Linear model | Y = 0.0095x + 51.454 | 0.3819 | < 0.001 | 8.23 | 9.431 | 0.000 | |
| Quadratic model | Y = -0.0006x2 + 0.0219x + 45.723 | 0.4709 | < 0.001 | 8.509 | 7.505 | 0.000 |
Fig. 1 - Regression analysis between primary productivity of ecosystem and species richness of seed plant in the mainland of China. (A): quadratic model; (B): linear model.
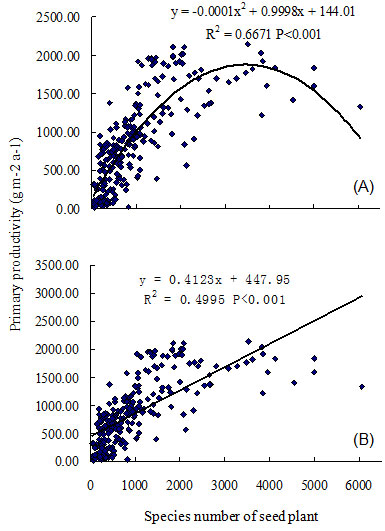
Fig. 2 - Regression analysis between species richness of bird and species richness of seed plant in the mainland of China. (A): quadratic model; (B): linear model.
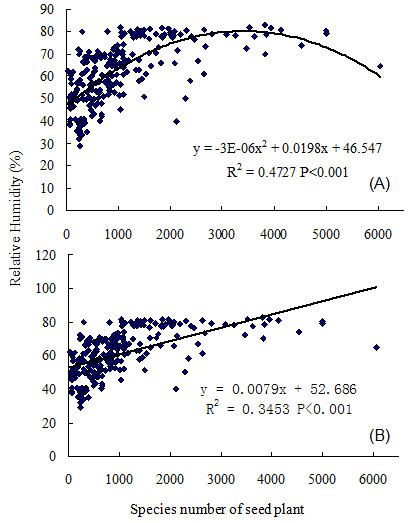
Results depicted a close relationship between relative humidity and the number of seed plant species in mainland China (R2 = 0.4727, P < 0.001, n = 241 - Fig. 3). The number of seed plant species increased with a rise in relative humidity, which reached a plateau at 80% relative humidity within 2000 species, and reached a maximum at 3500 seed plant species. Gradually, seed plant species richness over 4000 species was associated with lower relative humidity (Fig. 3). Therefore, the relationship between ecosystem relative humidity, and seed plant species richness was quadratic (hump-back).
Fig. 3 - Regression analysis between annual mean relative humidity of ecosystem and species richness of seed plant in the mainland of China. (A): quadratic model; (B): linear model.
Discussion
Primary productivity is the fundamental indicator of ecosystem function, and is at the base of ecosystem function ([8], [19], [27], [40]). Animal species richness is typically associated with food plant availability, and the diversity of vegetation habitats in an ecosystem ([24], [14]). Therefore, animal species richness can be used as an indicator of ecosystem functioning, and bird species richness is particularly suitable to this purpose, as bird species diversity is dependent on species composition in a given ecosystem, horizontal and vertical habitat structure, patch mosaic structure, and ecosystem area ([41], [18]). Relative humidity is a climatic index, which is related to some but not all climatic factors, including precipitation, wind, and temperature. However, humidity is also related to the ecosystem function, as it is related to ecosystem type, structure, and distribution area ([20], [32], [39]). In low and medium precipitation regions, the humidity on sunny days depends largely on evaporation and transpiration ([22], [17]), therefore it is suitable to consider it as a proxy for ecosystem functioning. All three ecosystem function indicators on a large scale generated the same model; a linear model when plant species richness was under 5000 taxa, and quadratic model when plant species richness was over 5000. The regression analysis comparisons of the relationships between plant species richness and relative humidity, bird species richness, and primary productivity using linear and quadratic models with and without the three highest quadrats demonstrated that both models produced reasonable results (Tab. 1). This may suggest a rule for the relationship between biodiversity and ecosystem functioning at a large scale ([11]).
The linear and hump-back relationships have been supported by several empirical studies, but showed variability at the small scale. Indeed, positive and negative curve patterns of biodiversity and ecosystem functions have previously been reported ([15], [33], [11]). This may be due to the problems of scale ([25], [5]), and the species richness gradient length. Experiments addressing a few species, monocultures, and mixtures are not comparable to the complexity of a natural ecosystem ([16]). Tilman et al. ([32]) suggested the biological features of selected experimental species might exhibit one or more important influences on results. Another factor affecting results is species removal from study under natural conditions, mainly where the species is limited in number. In addition, grasses or herbaceous species are frequently used in these experiments, but woody species are excluded due to difficulties in cultivating woody taxa under greenhouse conditions. Most experiments at the small scale are carried out within one- or two-year time frame, and therefore historical and evolutionary effects are not evaluated. Large-scale biodiversity and ecosystem functioning studies are vital, and cannot be substituted by small scale experimental research ([4], [5]).
Moreover, productivity is one indicator frequently assessed for ecosystem function in empirical studies. It is a viable parameter because productivity is the primary result of ecosystem function ([13], [27]). However, it emphasizes the goods generated by ecosystems, but neglects to ascertain habitat functions yielded by wild plants and animals, and is not a comprehensive ecosystem measure. In our study, we used three ecosystem indicators, primary productivity, bird species richness, and relative humidity to comprehensively reflect ecosystem function ([24]). Primary productivity evaluates an ecosystem’s capacity to produce biomass, bird species richness emphasizes the effects of ecosystem structure and the overall species pool on bird biodiversity, and relative humidity is an indicator of ecosystem capacity for balancing habitat conditions, stability, and service functions ([40], [3]). Former studies suggest these three indicators characterize ecosystem function better than any single index. A similar response model for the three indicators to seed plant richness in mainland China ensured that the relationship of biodiversity and ecosystem functions was linear when the biodiversity gradient was comparatively short, and a hump-back model when the biodiversity gradient was at a larger scale.
Acknowledgements
The study was financially supported by the National Natural Science Foundation of China (Grants No. 31170494 and No. 30870399).
References
Gscholar
Gscholar
Gscholar
Gscholar
Gscholar
Gscholar
Gscholar
Gscholar
Gscholar
Gscholar
Gscholar
Authors’ Info
Paper Info
Citation
Zhang J-T, Wang C (2012). Biodiversity and ecosystem functioning: exploring large-scale patterns in mainland China. iForest 5: 230-234. - doi: 10.3832/ifor0627-005
Academic Editor
Marco Borghetti
Paper history
Received: Apr 14, 2012
Accepted: Jul 20, 2012
First online: Oct 02, 2012
Publication Date: Oct 30, 2012
Publication Time: 2.47 months
Copyright Information
© SISEF - The Italian Society of Silviculture and Forest Ecology 2012
Open Access
This article is distributed under the terms of the Creative Commons Attribution-Non Commercial 4.0 International (https://creativecommons.org/licenses/by-nc/4.0/), which permits unrestricted use, distribution, and reproduction in any medium, provided you give appropriate credit to the original author(s) and the source, provide a link to the Creative Commons license, and indicate if changes were made.

Web Metrics
Breakdown by View Type
Article Usage
Total Article Views: 59504
(from publication date up to now)
Breakdown by View Type
HTML Page Views: 49415
Abstract Page Views: 4192
PDF Downloads: 4290
Citation/Reference Downloads: 41
XML Downloads: 1566
Web Metrics
Days since publication: 5039
Overall contacts: 59504
Avg. contacts per week: 82.66
Article Citations
Article citations are based on data periodically collected from the Clarivate Web of Science web site
(last update: Mar 2025)
Total number of cites (since 2012): 8
Average cites per year: 0.57
Publication Metrics
by Dimensions ©
Articles citing this article
List of the papers citing this article based on CrossRef Cited-by.
Related Contents
iForest Similar Articles
Research Articles
The effect of seed size on seed fate in a subtropical forest, southwest of China
vol. 9, pp. 652-657 (online: 04 April 2016)
Research Articles
Seed trait and rodent species determine seed dispersal and predation: evidences from semi-natural enclosures
vol. 8, pp. 207-213 (online: 28 August 2014)
Research Articles
Vascular plants diversity in short rotation coppices: a reliable source of ecosystem services or farmland dead loss?
vol. 13, pp. 345-350 (online: 17 August 2020)
Short Communications
Evidence of Alectoris chukar (Aves, Galliformes) as seed dispersal and germinating agent for Pistacia khinjuk in Balochistan, Pakistan
vol. 14, pp. 378-382 (online: 22 August 2021)
Short Communications
An approach to measuring biodiversity and its use in analysing the effect of nitrogen deposition on woodland butterfly populations in the Netherlands
vol. 2, pp. 46-48 (online: 21 January 2009)
Research Articles
Seed germination traits of Pinus heldreichii in two Greek populations and implications for conservation
vol. 15, pp. 331-338 (online: 24 August 2022)
Research Articles
The maternal environment of European beech (Fagus sylvatica L.) affects intrapopulation variability in seed traits and germination
vol. 19, pp. 114-121 (online: 10 April 2026)
Research Articles
The effectiveness of short-term microwave irradiation on the process of seed extraction from Scots pine cones (Pinus sylvestris L.)
vol. 13, pp. 73-79 (online: 13 February 2020)
Research Articles
Effects of functional traits on the spatial distribution and hyperdominance of tree species in the Cerrado biome
vol. 15, pp. 339-348 (online: 01 September 2022)
Review Papers
Soil seed banks of pioneer tree species in European temperate forests: a review
vol. 11, pp. 48-57 (online: 25 January 2018)
iForest Database Search
Search By Author
Search By Keyword
Google Scholar Search
Citing Articles
Search By Author
Search By Keywords
PubMed Search
Search By Author
Search By Keyword


