A new database for time-series monitoring data: the NitroEurope approach
iForest - Biogeosciences and Forestry, Volume 4, Issue 5, Pages 226-232 (2011)
doi: https://doi.org/10.3832/ifor0595-004
Published: Nov 03, 2011 - Copyright © 2011 SISEF
Technical Reports
Collection/Special Issue: COST Action FP0903 (2010) - Rome (Italy)
Research, monitoring and modelling in the study of climate change and air pollution impacts on forest ecosystems
Guest Editors: E Paoletti, J-P Tuovinen, N Clarke, G Matteucci, R Matyssek, G Wieser, R Fischer, P Cudlin, N Potocic
Abstract
The NitroEurope Integrated Project (2006-2011) aimed to gain a better understanding of the nitrogen cycle and its impacts on the European greenhouse gas balance. Over sixty project partners collected large volumes of data from sites all over Europe. There are currently more than 15 forest sites in 11 countries, including beech, oak, spruce and mixed forests. The collected data are at different temporal resolutions, from one-off measurements to 30-minute time-series data. Around 500 variables (plus attributes) are measured, including soil and plant data, details of cultivation management for natural and manipulated sites, long-term datasets of flux and concentrations of greenhouse gas and pollutants and their precursors, and micrometeorology data. The NitroEurope research community therefore needed a database to provide easy upload and extraction of data for analysis, interpretation and modelling. A bespoke database with a web-based graphical user interface (GUI) in a user-friendly and attractive online environment was produced by the NitroEurope ([7]) database development team. The software provides a flexible interface between Microsoft Excel workbooks and an Oracle database. The database “Form Manager” enables construction of database forms which reflect the project’s Excel data workbook templates. The software locates data according to Excel worksheet and cell references. The database “Uploader” extracts the specified data from completed Excel templates and uploads data directly to the Oracle relational database tables through the web front-end. Data are run through a series of automatic checks on upload which can be verified using an online graphing tool. Data are then validated and made available to the NitroEurope community for downloading. The database “Reporting” tools enable data from different sites and activities to be brought together and datasets can be previewed and graphed before they are downloaded. The database has almost 300 users and currently contains over eight million rows of data. The data will be made available to the wider scientific community two years after the project ends (Spring 2013). The database structure is extremely flexible and has been used for the storage and reporting of other time-series project data at our institute.
Keywords
Forest data, Greenhouse gas flux, Environmental data, Climate change, User-friendly on-line database
Introduction
It is well-known that the Nitrogen cycle is complex and that it impacts on the emissions of greenhouse gases ([12]). The NitroEurope (NEU) Integrated Project (2006-2011 - ⇒ http://www.nitroeurope.eu/) addresses the questions “What is the effect of reactive nitrogen (Nr) on the direction and magnitude of net greenhouse gas budgets for Europe?” and “To what extent would a more-integrated management of the N-cycle and its interactions with the C-cycle have the potential to reduce greenhouse gas and Nr emissions simultaneously?” ([10], [2]). NitroEurope science is managed in six separate but well linked and integrated components. “Component 1” establishes robust datasets of nitrogen (N) fluxes and net greenhouse-gas exchange in relation to C-N cycling of representative European ecosystems and generates a large volume of field monitoring measurements. “Component 2” quantifies the effects of past and present global changes on C-N cycling and net greenhouse gas exchange, and also generates a large volume of data from manipulated site measurements. “Component 3” is a modelling effort, simulating fluxes of nitrogen and greenhouse gases observed in the field, their interactions and responses to global change and land-management decisions, through refinement of plot-scale models. At a larger spatial scale, “Component 4” quantifies multiple N and C fluxes for contrasting European landscapes using field measurements and modelling techniques, while “Component 5” is another modelling component, scaling up reactive nitrogen (Nr) and net greenhouse gas fluxes for terrestrial ecosystems to regional and European levels. Finally, “Component 6” is concerned with verification of European N2O and CH4 inventories and refinement of the approaches of the International Panel on Climate Change (IPCC).
Because of the wide diversity of data generated by the NitroEurope project, none of the approaches already available for the handling and storage of datasets (e.g., simple Microsoft Access, the CarboEurope database, the British Atmospheric Data Centre) were able to satisfy the requirements for management of the NitroEurope Data. The solution to this challenge was to manage the data within three different data centres which can be accessed from the same page on the NitroEurope web portal (⇒ http://www.nitroeurope.eu/). The three data centres are the Centre for Ecology and Hydrology (CEH). UK; French National Institute for Agricultural Research (INRA), France, and the Joint Research Centre (JRC), Italy. Each centre operates a database: the “Component 1-3 database” at CEH for the field and manipulated plot measurements as well as the plot scale model output, the “Component 4 database” at INRA for landscape spatial and model data, and the “Components 5-6 database” at JRC for European scale modelling and validation data. The web portal is accessible to the public, but registration is required to view all the pages. Separate registration is also required for the three data centres to protect the Intellectual Property Rights (IPR) of scientists who have uploaded unpublished data. All data will be freely available in April 2013 (two years after the end of the project). As mentioned already, each component generates large volumes of many different types of data for four different ecosystem groups - Arable, Grassland, Forest and Wetlands and Shrublands. For example, field and manipulated plot measurements include one-off type data (including measuring site location and details), and data measured annually (such as vegetation cover, leaf area index (LAI) and above ground biomass). These activities also generate data which are collected at infrequent intervals (e.g., some greenhouse gas flux, land management practices), and several types of data are collected at up the 30 minute intervals (including meteorological data, gas fluxes and concentrations). The plot-scale modelling component simulates the measurements made at field sites. All these data are stored on the NitroEurope “Component 1-3” database. The data management committee (DMC) manages the collection, storage and retrieval of data. The DMC comprises a chair-person and a data manager for each of the six science components. Three of these data managers are also managers of the data centres. In addition, an external software contractor developed the software for datacentre C1-C3, and information expertise and IT support have been provided by the three data centres. It is was the Data Management Committee’s responsibility to devise a Data Management Policy, a Data Management Plan which included data access and intellectual property rights issues, and to implement the software for the databases for storage and retrieval. This paper describes the data management for the NitroEurope science components dealing with field measurements, manipulated site measurements and plot scale modelling) and the database which was specifically designed for uploading and reporting these data.
Materials and methods
All NitroEurope science components involve the collection and/or processing of large quantities of data, particularly those tasked with flux measurements, manipulation experiments and plot scale modelling which cover the highly time-resolved flux data, and the modelled simulations of plot fluxes.
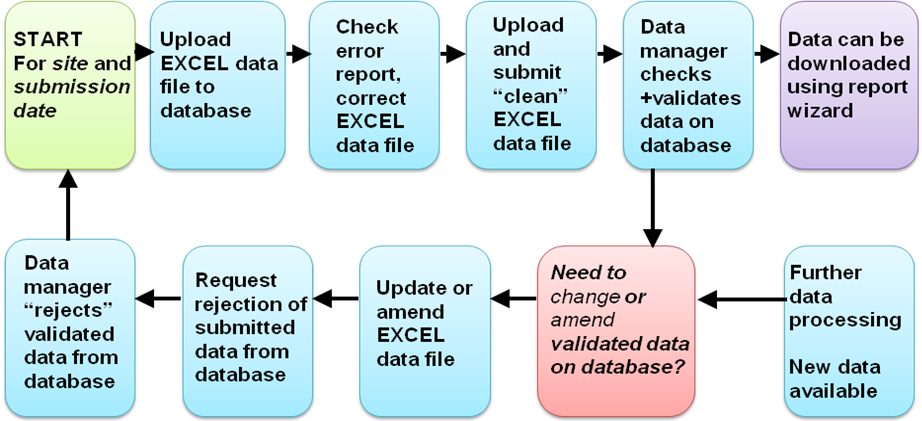
A workflow was defined for the collection and uploading of data, which needed to account for the initial collection of data into Excel workbook templates at each of the study sites (Fig. 1). On the basis of this workflow, the Data Management Committee devised a protocol and technical specification for bespoke software to provide a user-friendly interface between the user and the Excel data templates, and an Oracle database. This software will be described in detail in a future publication (Owen et al. “A flexible new database system with easy storage and reporting of any time series data: the NitroEurope project application” - in preparation), and a brief overview is given here.
Fig. 1 - Workflow for uploading, amending and accessing data on the NitroEurope C1-C3 Database
The database needed to handle the Microsoft Excel data templates which each site manager completes for uploading. The data are collected from more than 200 scientists working at more than 80 sites across Europe. There are 50 “Level 1” inferential sites allowing the interpretation of measured CO2 fluxes in relation to inferential estimates of N supply and key soil variables, and nine “Level 2” regional sites using low-cost N flux methods as a basis to establish a future long-term flux monitoring capability at CO2 flux sites. Data for around 100 and 500 variables and attributes are collected at Level 1 and Level 2 sites, respectively (Tab. 1, Tab. SM1 in Supplementary material). There are also thirteen “Level 3” Super Sites, with detailed investigation of N budgets/fluxes and interactions with carbon-cycling, supported by detailed plant and soil inventorying and process studies, where data for more than 500 variables and associated attributes (e.g., standard deviation, gap-filling flags) are collected (Tab. SM2 in Supplementary material). In addition, there are 22 core manipulation sites and fourteen associated manipulation sites (drought, fertilization etc), where data for around 350 variables are collected (Tab. SM3 in Supplementary material). Some data fields are mandatory, and others are optional. For each variable, its symbol, units, method, and frequency are defined to ensure consistency across sites, essential for bringing together data from different sites for analysis. However, although there is consistency for each data field across different sites, there are occasional discrepancies in units between component datasets (database “forms”). Because all downloaded data is headed by data field names and units, users are always aware of the units that have been used for the storage of any particular data field.
Tab. 1 - Data field categories for “Level 1” Inferential sites.
| Category of data | Examples of data fields | Units |
|---|---|---|
| Metadata | Site id | text |
| Analysis Lab id | text | |
| Month | text | |
| Date/Time start and end of exposure | text | |
| Volume sampled | m3 | |
| Flow rate of sampling | L min-1 | |
| NO3- raw data | Lab blank, Denuder concs and capture efficiency for NO3- | μg NO3-, % |
| HNO3 gaseous concentrations |
Results 1.2.3 for calculating HNO3 | μg HNO3 m-3 |
| NO2- raw data | Lab blank, Denuder concs and capture efficiency for NO2- | μg NO2-, % |
| HONO gaseous concentrations |
Results 1.2.3 for calculating HONO | μg HONO m-3 |
| SO4= raw data | Lab blank, Denuder concs and capture efficiency for SO4= | μg SO4=, % |
| SO2 gaseous concentrations |
Results 1.2.3 for calculating SO2 | μg SO2 m-3 |
| Cl- raw data | Lab blank, Denuder concs and capture efficiency for Cl- | μg Cl-, % |
| HCl gaseous concentrations |
Results 1.2.3 for calculating HCl | μg HCl m-3 |
| NH4+ raw data | Lab blank, Denuder concs and capture efficiency for NH4+ | μg NH4+, % |
| NH3 gaseous concentrations |
Results 1.2.3 for calculating NH3 | μg NH3 m-3 |
| Denuder data flag | Denuder data flag | - |
| Aerosol | calculated and corrected NO3-, NO2-, SO4=, Cl-, NH4+ | μg NO3- (2-, SO4=, Cl-, NH4+) m-3 |
| Basic cations | Ca, Mg, Na | μg m-3 |
| Aerosol data flag | Aerosol data flag | - |
| Comments | Comments | - |
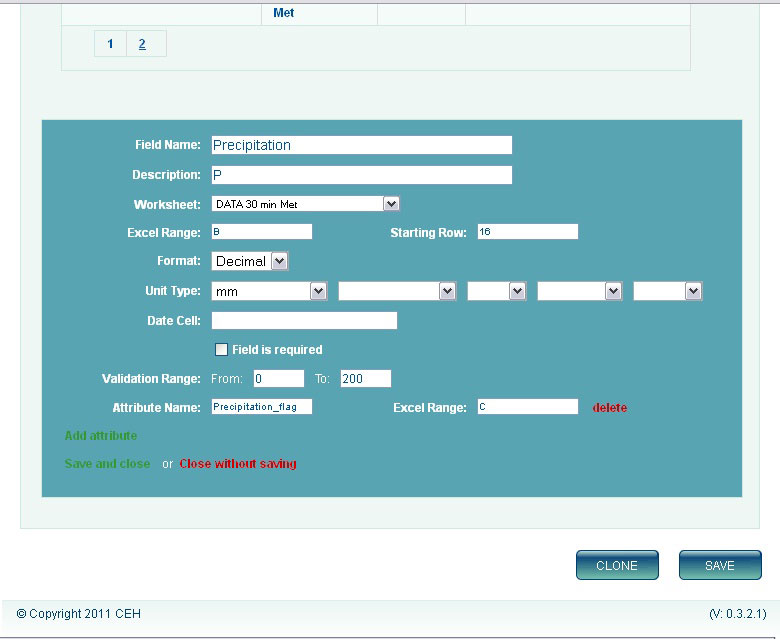
The database software was designed to accommodate different types of “users” with different roles: Form Manager, Data Uploader, Data Downloader (Owen et al., in preparation). The Form Manager role can use the Form Designer part of the web-based application to design the database Forms (Fig. 2). The software translates the form to construct the Oracle database table where the data are stored. The database Forms are based on the Excel workbook sheets of the data templates that the site managers complete. The structure of the database tables and the field names are thus completely recognisable to the user. The Database Form recognises the Excel workbook location of cell or column, and defines field format, unit type, if required, validation range, and any data attributes (Fig. 3). Date and time of measurement is a key field for all data. For Component 2 manipulation site data, the key field consists of a concatenation of date/ time, treatment, block and replicate. For some data types there are other key fields which additionally concatenate to generate the unique key identifier. The database design software allows unlimited numbers of fields and key fields (within the Oracle Database system limitations).
Fig. 2 - Screen-shots of Form-Designer for the NitroEurope C1-C3 Database.
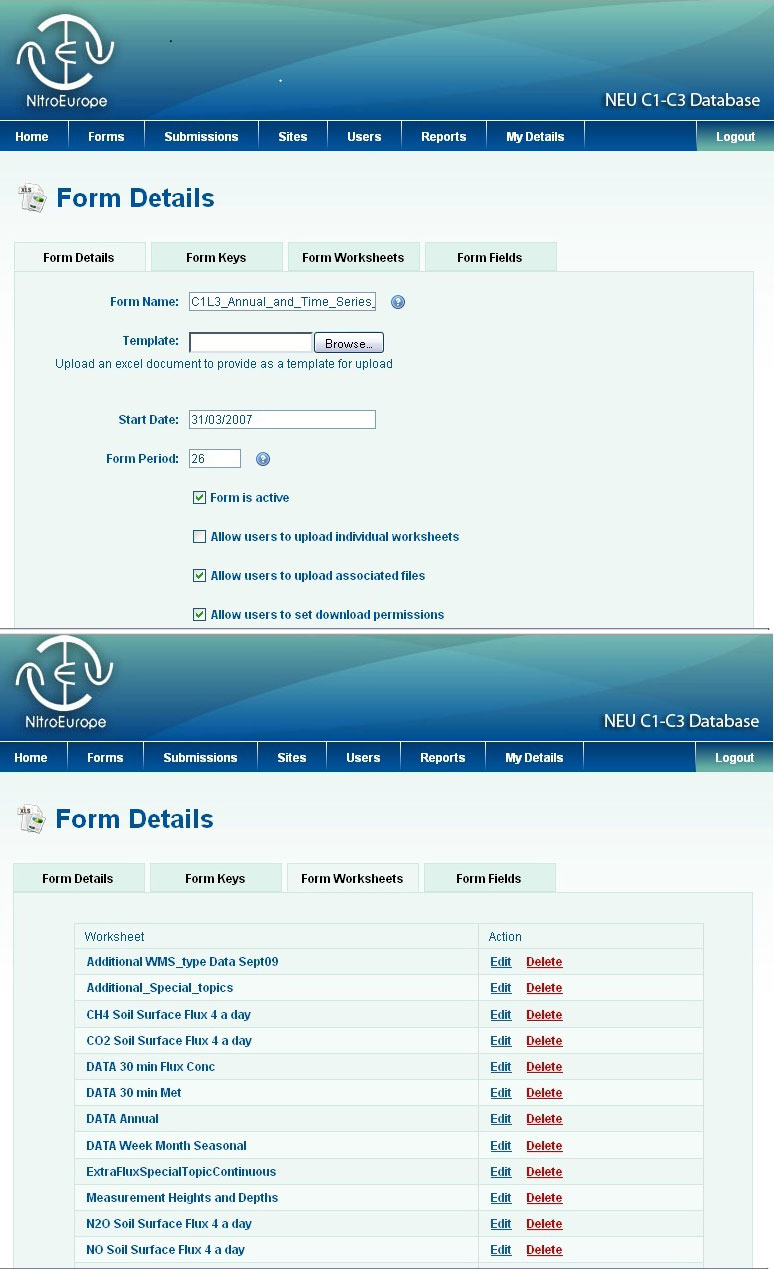
Fig. 3 - Defining a data field in Form-Designer for the NitroEurope C1-C3 database.
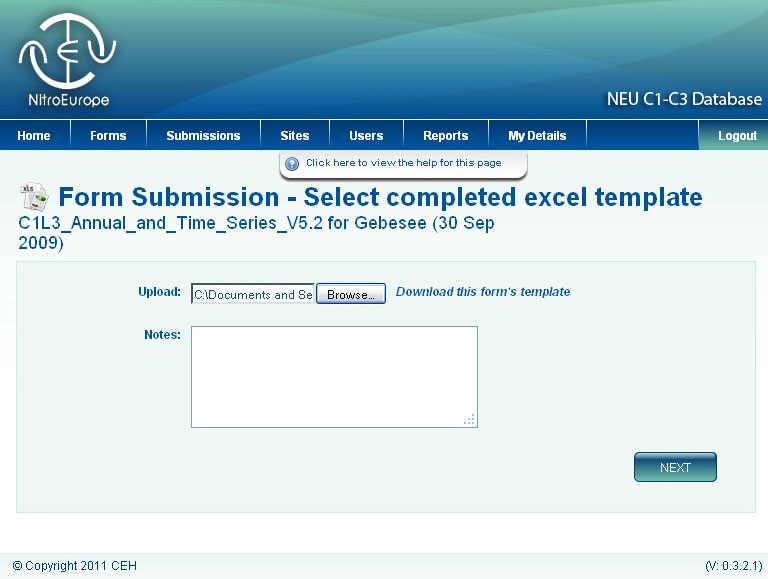
Data are submitted to the database by uploading the completed Excel workbooks, in predefined date ranges (Fig. 4). The uploaded Excel data workbook is also stored on the fileserver. Each submission date range can be defined by the Form Manager, for example, a 6-month block of data was a convenient amount of data to collect and upload at one time for Level 3 sites, and so submission date deadlines were set every six months. Data are submitted by site by submission date deadline (e.g., twice a year). Any number of associated files can be uploaded with each submission, so that images, maps, model code etc. can be associated with the uploaded and reportable data.
Fig. 4 - Uploading an Excel workbook.
The software performs automatic upload checks, for example some fields are “Required” and missing values are flagged, range of values expected for different fields (which can help indicate if the data are in the correct units), data type (e.g., text, numeric) and duplicate key-field value checks. The database generates a downloadable on-screen error report of problems detected in the dataset being uploaded. Data that need correcting or amending can be re-uploaded to the database. As with any database software, automatic checks cannot capture all data problems.
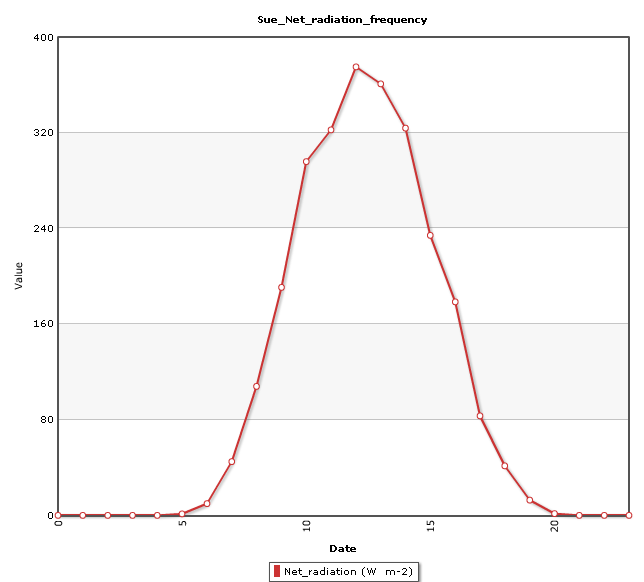
The software also provides a Report Wizard for user-friendly downloading of data. It is possible to select fields and attributes from any of the dataset forms. Data from different NitroEurope components can be combined. To run a report, it is necessary to select the required date range, the key field filters, the sites or ecosystem type. Results are displayed on screen, and data can be downloaded to Excel or CSV format (Fig. 5). There is an averaging feature which allows, e.g., 30 minute data to be averaged to hourly data, and then hourly data can be averaged to produce an average diurnal cycle (e.g., Fig. 6). In general, the “Frequency” reporting function can average, sum, or select min/max values over a given time period. The “Grouping” reporting function can then display diurnal cycles and seasonal cycles. Automatic messaging informs data owners when and who downloaded their data. A user who has downloaded data that has been rejected and re-submitted, will receive an email suggesting that they re-download the data as it may have changed.
Fig. 5 - Example of tabular report output, downloadable to Excel or CSV.
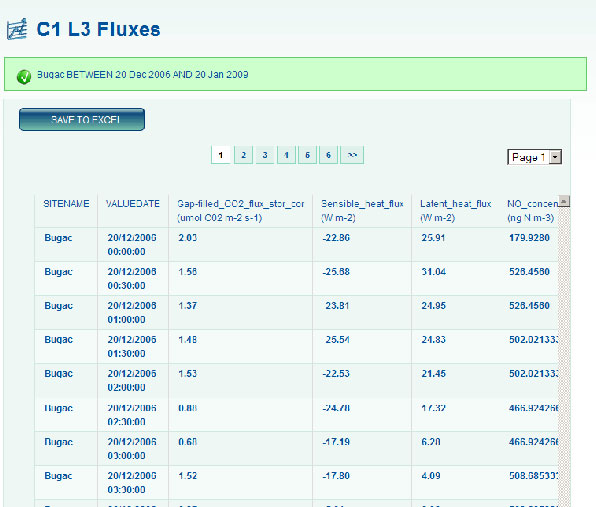
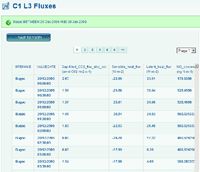
Fig. 6 - Example of graphical report output, showing grouping and frequency to produce an average diurnal cycle.
Results
A web-based, user-friendly database user interface with highly flexible uploading and reporting facilities has been developed which provides an easy interface between Excel data workbooks containing field and model data, and an Oracle database. The software was developed for NitroEurope Science components 1, 2 and 3 and currently holds time series data for arable, grassland, forest, wetland and shrubland ecosystems. The forest sites which have data already uploaded to the database, or that will be uploaded before summer 2011, are listed in Tab. 2.
Tab. 2 - NitroEurope forest sites which have uploaded data (Dec 2010 - C1L2 = regional sites contributing to Component 1 field measurements; C1L3 = supersites contributing to Component 1 field measurements; C2 = manipulated sites contributing to Component 2 measurements).
| Site name | Label | Country | Forest Site | Age (years) |
Location |
|---|---|---|---|---|---|
| Soroe | C1L3 | Denmark | Beech dominated deciduous | 2500 | 55° 28’ N 11° 37’ E |
| Hyytiala | C1L3 | Finland | Managed Scots Pine | 44 | 61° 51’ N 24° 17’ E |
| Hoglwald | C1L3, C2 | Germany | Managed Norway Spruce | 110 | 48° 30’ N 11° 10’ E |
| Speulder | C1L3 | Netherlands | Managed Douglas Fir | 46 | 52° 13’ N 5° 39’ E |
| Klausenleopoldsdorf | C2 | Austria | Beech | ~60 | 48° 07’ N 16° 02’ E |
| Achenkirchen | C2 | Austria | Spruce/Beech | ~130 | 47° 34’ N 11° 39’ E |
| Alptal | C2 | Switzerland | Norway spruce/Silver Fir | ~250 | 47° 03’N 8° 43’ E |
| Klosterhede | C2 | Denmark | Oak, former Apple | ~30 | 56° 29’ N 8° 24’ E |
| Stroedam | C2 | Denmark | Beech/Birch | >200 | 55° 57’ N 12° 17’ E |
| Tolfa | C2 | Italy | Mediterranean evergreen - Arbutus unedo | - | 42° 10’ N 11° 55’ E |
| Gårdsjön | C2 | Sweden | Norway spruce with some Scots Pine | ~120 | 58° 04’ N 12° 01’ E |
| Skogaryd | C2 | Sweden | Norway spruce | ~60 | 58° 23′ N 12° 09′ E |
| Fyodorovskoe | C1L2 | Russia | Picea abies 87%; Betula pendula 13% | 181 | 56° 27’ N 32° 55’ E |
| Vestskoven | C2 | Denmark | Oak, former Apple | ~30 | 55° 41’ N 12° 21’ E |
| Falköping | C2 | Denmark | Betula pendula | ~50 | 58° 20´ N 13° 30´ E |
| Herdada de Mitra | C2 | Portugal | Quercus suber, Quercus rotundifolia | - | 38° 32´N 7° 54´ W |
| Griffin | C1L2 | UK | Sitka Spruce | 20 | 56° 37’ N 3° 47’ W |
With more than 80 measurement sites overall, more than 1000 data fields (variables + attributes) and high frequency of measurements for many of those variables, around 8 million rows of data have already generated in the database. At the time of writing, no data have yet been uploaded for the ~50 Level 1 inferential sites, but this is intended before the end of the NitroEurope project (April 2011). Data have been uploaded for some of the Level 2 regional sites, and this will be complete during the early months of 2011. Most of the 13 “supersites” have uploaded time series data from Aug 2006 - Dec 2010, specifically the forest sites Soroe (Denmark), Hyytiala (Finland), Hoeglwald (Germany), Speulder (Netherlands). Most manipulated sites have also uploaded long-term data (“C2” sites - Tab. 2).
Because automatic data checks cannot capture all potential problems associated with huge datasets, NitroEurope organised two Data Quality exercises for Component 1, Level 3 supersite data. Different groups of data were checked across site by participating scientists. This exercise revealed gaps in data, wrong units which had not been detected by the value range checks, and a series of other problems within the large data sets that are inevitable in a project of this size. Each site then corrected their Excel data templates and re-uploaded to the database.
Discussion and conclusions
Long-term storage and easy retrieval of field data at different spatial and temporal resolutions pose a challenge. The NitroEurope project is a large one, involving a community of nearly 300 scientists making measurements which generate data for more than 1000 database fields. Microsoft Excel templates, although they have some intrinsic problems which are discussed below, are perhaps the most accessible format which most scientists are familiar with Excel templates were therefore used for initial data collection, and the database software was designed to use Excel templates as input, though the software is flexible enough to have the potential to accept other formats in future developments. The advantages of using Excel templates as input are familiarity, flexibility, no special software is needed to create the input worksheets, and full information and metadata can be provided within an Excel workbook. There are two main problems that have been encountered in the use of Excel as the input medium for the NitroEurope database. Firstly, there are some anomalies with date handling in Excel. The displayed date may be different to the real, stored date. Secondly, invalid characters are allowed to occur in numeric columns. Each of these problems are likely to be captured on upload, but duplicate date errors which can be generated from date storage anomalies in Excel can be hard to detect, especially as there can be problems with upward compatibility of workbook macros in new versions of Excel.
Because automatic upload checks cannot detect all problems associated with large time series datasets, it is necessary to perform further data quality analyses of different groups of data residing on the database. Excellent examples are provided by the CarboEurope project (e.g., [5], [6]). This type of analysis is outside the scope of the work presented here, but is addressed in ongoing and future data management and data quality activities in the NitroEurope project.
Data are available to all NitroEurope Community members for the duration of the project. Members must agree to the conditions of use for the data before downloading data. Site Principal Investigators (PIs) are notified by email when a user has downloaded data from their site. The downloader receives an email with a reminder of the conditions of use and the names and email addresses of the PIs of the data downloaded to encourage communication with the PI. The IPR agreement reminds data downloaders that the data were generated or collected within the framework of the NitroEurope Integrated Project (IP) and that the user agrees (i) to restrict the use of the data to the context of the research topic specified at the time of the application, when this application was made to access data still restricted from the public domain; (ii) not to disclose the data to other parties; (iii) not to use the data for commercial purposes; (iv) that the Intellectual Property Right remains with the Data Originator; (v) to contact the Data Originator prior to any use of the data; (vi) to offer the Data Originator(s) co-authorship of any publication or communication based on NitroEurope IP data; in the event that the offer is declined or when the Data Originators cannot be contacted, Data Originators must be duly acknowledged.
The NitroEurope project has already generated a number of publications, some of which are gathered into special issues (e.g., Agriculture, Ecosystems and Environment 133 (3-4) - 2009, European Journal of Soil Science 61(5) - 2010). Many of these publications are case studies, or preliminary syntheses. For example, Skiba et al. ([9]) compared high resolution fluxes across ecosystems of N2O, NO (also CH4, CO2) fluxes, wet and dry N deposition, leaching of N and C and N transformations in plant, litter and soil for the first 11 months of the project (1/8/2006 to 30/6/2007), and concluded that of the four ecosystems (grassland, arable, forest and wetland/shrubland), grasslands are the largest source of N2O, forests are the largest source of NO and sink of CH4 and that N deposition rates influence NO and N2O fluxes in non-agricultural ecosystems. Ammann et al. ([1]) focussed on a longer time-series of data from CarboEurope and the early NitroEurope measurements, studying greenhouse gas budgets by measuring C and N exchange on the field scale at the grassland site Oensingen over a 6-year period (2002-2007). Analysing Component 1 Level 1 site measurements (Tab. 1) for the first year of NitroEurope, Tang et al. ([11]) reported an intercomparison of the European scale DELTA low-cost equipment by six participating laboratories at four test sites, demonstrating good agreement between different climatic conditions. The first year of measurements showed substantial spatial variability in atmospheric Nr concentrations, illustrating the major local (NH3) and regional (HNO3, NO3-, and NH4+) differences in Nr concentrations, providing a basis to develop future estimates of site-based Nr dry deposition fluxes across Europe, and highlighting the role of agricultural NH3 as the largest single Nr constituent dominating dry Nr fluxes at most sites. Schaufler et al. ([8]) reported a laboratory study to estimate potential greenhouse gas (nitrous oxide N2O, nitric oxide NO, carbon dioxide CO2 and methane CH4) flux rates from soils under different land use and climate, assessing the effect of soil temperature and soil moisture. They found a non-linear increase of N2O, NO and CO2 emissions with increasing temperature, positive correlation of nitrous oxide emissions with soil moisture, and negative correlation of NO emission and CH4 oxidation rates with soil moisture. They showed that nitrous oxide and CO2 emissions were highest in grassland soils, while NO emissions were highest in forest soils. These reports are a small sample of the type of study already published from the NitroEurope project. The project ends in Spring 2011 and therefore it is anticipated that a large number of synthesis papers will be written and published. Analyses and interpretation can now be extended to make use of the full 4.5 years of NitroEurope data, within and between sites and ecosystems. The data can also contribute to model input and validation, for example, Flechard et al. ([4]) used NitroEurope data in their recently published a comparison of inferential models predicting dry deposition across Europe. The NitroEurope C1-C3 database will facilitate this effort across the board, by providing a central repository of all the field data, and a user-friendly reporting tool for accessing the data across components and work packages.
The database will be maintained beyond the end of NitroEurope and data will be made publically available two years after NitroEurope has ended. Certain datasets can still be restricted to certain groups of users if required, but permission can be sought (via the database software) to gain access to restricted datasets. Data reporting is essentially simple, based on a report wizard. However, when the database is released to the general science community, non-NitroEurope scientists will need to refer to the reporting manual to identify which data fields of the hundreds available, might be of interest to them. This will be downloadable from the NitroEurope web site ⇒ http://www.nitroeurope.eu/.
The flexibility of database structure enables the database to be used for most time-series data and two other projects within CEH are already using the database software. There are plans to link the NitroEurope database to other European databases to further increase access to high-quality climate change-related data. These plans will be realised in the CEH project “Environment and Climate interactions - Observations and Responses in Ecosystems” (ENCORE) which started in 2011.
Acknowledgements
We gratefully acknowledge the contribution of the EU and national funding sources to the NitroEurope Integrated Project. We thank the NitroEurope Research Community, especially field scientists and site managers for the hard work and collaborative effort in preparing and uploading their field data. We thank Mark Sutton (the NitroEurope Project Leader), and the NitroEurope Secretariat for managing the project. It has been a privilege to be involved.
References
CrossRef | Gscholar
CrossRef | Gscholar
CrossRef | Gscholar
CrossRef | Gscholar
Authors’ Info
Paper Info
Citation
Owen SM, Leaver DS, Bealey WJ, Wilson R, Reis S, Sutton M (2011). A new database for time-series monitoring data: the NitroEurope approach. iForest 4: 226-232. - doi: 10.3832/ifor0595-004
Paper history
Received: Jan 11, 2011
Accepted: Aug 12, 2011
First online: Nov 03, 2011
Publication Date: Nov 03, 2011
Publication Time: 2.77 months
Copyright Information
© SISEF - The Italian Society of Silviculture and Forest Ecology 2011
Open Access
This article is distributed under the terms of the Creative Commons Attribution-Non Commercial 4.0 International (https://creativecommons.org/licenses/by-nc/4.0/), which permits unrestricted use, distribution, and reproduction in any medium, provided you give appropriate credit to the original author(s) and the source, provide a link to the Creative Commons license, and indicate if changes were made.

Web Metrics
Breakdown by View Type
Article Usage
Total Article Views: 53437
(from publication date up to now)
Breakdown by View Type
HTML Page Views: 43418
Abstract Page Views: 3057
PDF Downloads: 5601
Citation/Reference Downloads: 42
XML Downloads: 1319
Web Metrics
Days since publication: 4556
Overall contacts: 53437
Avg. contacts per week: 82.10
Article Citations
Article citations are based on data periodically collected from the Clarivate Web of Science web site
(last update: Feb 2023)
Total number of cites (since 2011): 4
Average cites per year: 0.31
Publication Metrics
by Dimensions ©
Articles citing this article
List of the papers citing this article based on CrossRef Cited-by.
Related Contents
iForest Similar Articles
Technical Reports
Allometric biomass and carbon factors database
vol. 1, pp. 107-113 (online: 09 July 2008)
Technical Advances
A meta-database comparison from various European Research and Monitoring Networks dedicated to forest sites
vol. 6, pp. 1-9 (online: 14 January 2013)
Research Articles
Seeing, believing, acting: climate change attitudes and adaptation of Hungarian forest managers
vol. 15, pp. 509-518 (online: 14 December 2022)
Research Articles
Impacts of stump harvesting on carbon dioxide, methane and nitrous oxide fluxes
vol. 15, pp. 148-162 (online: 07 May 2022)
Research Articles
Potential impacts of regional climate change on site productivity of Larix olgensis plantations in northeast China
vol. 8, pp. 642-651 (online: 02 March 2015)
Editorials
Change is in the air: future challenges for applied forest research
vol. 2, pp. 56-58 (online: 18 March 2009)
Research Articles
Role of forest cover, land use change and climate change on water resources in Marmara basin of Turkey
vol. 8, pp. 480-486 (online: 31 October 2014)
Research Articles
Predicting the effect of climate change on tree species abundance and distribution at a regional scale
vol. 1, pp. 132-139 (online: 27 August 2008)
Review Papers
Shaping the multifunctional tree: the use of Salicaceae in environmental restoration
vol. 6, pp. 37-47 (online: 21 January 2013)
Research Articles
Fluctuation of the ecological niche of Moringa peregrina (Forssk.) Fiori with topoclimatic heterogeneity in southern Iran
vol. 16, pp. 53-61 (online: 16 February 2023)
iForest Database Search
Search By Author
Search By Keyword
Google Scholar Search
Citing Articles
Search By Author
Search By Keywords
PubMed Search
Search By Author
Search By Keyword


