Diversity pattern of vegetation in and around proposed Kotlibhel hydroelectric project along the Alaknanda River in Garhwal Himalaya (India)
iForest - Biogeosciences and Forestry, Volume 4, Issue 1, Pages 38-43 (2011)
doi: https://doi.org/10.3832/ifor0557-004
Published: Jan 27, 2011 - Copyright © 2011 SISEF
Technical Reports
Abstract
The study made an assessment of the floral status of the project site of Kotlibhel hydrolectric project (Stage 1B) at Alaknanda valley in the Ganga river system (India). Study area included two broad zones: Influence (IZ) and Submergence zone (SZ). Influence zone showed higher species richness in all vegetation strata. In the upper layer, there were 26 tree species, middle layer consisted of 32 shrub species and ground layer (understory) contained 41 species. Maximum density in the tree layer (36.4 plants/ha) was found for Haldinia cordifolia in the Influence zone. On the other hand, shrub and herb species showed highest density in the Submergence zone. Highest density of shrubs species was recorded for Ficus hederacea (844.0 plants/ha), while highest density of herbs for Desmodium triflorum (5540.1 plants/ha). Significant differences in Shannon diversity were found between Influence and Submergence zones for shrub and herb species (P<0.001), but not for trees. Simpson diversity was not significantly different for tree, shrub and herb species in both zones. Differences in Margalef species richness were found (P<0.001) for all vegetation layers in both zones. Distribution pattern of the species showed contagious patterns for both Submergence and Influence zone. Maximum Shannon diversity (3.561) was recorded in the Influence zone for herb species, followed by shrubs species (3.184) and tree species (2.593). Submergence zone showed lower Shannon diversity than the Influence zone, where a higher Shannon diversity (3.480) was recorded for herb species. Pinus roxburghii showed the highest IVI in the Influence zone (71.88) and Mangifera indica in Submergence zone (58.77).
Keywords
Introduction
Forests are being degraded and fragmented rapidly in the Indian subcontinent. The human influences on biodiversity and ecosystem are rapid and large, leading to frequent changes in land and resource use, increased frequency of biotic invasions, reduction in species number, creation of stresses and the potential for changes in the climate system ([9]). The loss of biodiversity actually hampers and contrasts economic development ([8]). The depletion of biodiversity is an alarming problem of the world. The rate of extinction has been enhanced by human-related habi-tat loss and climate change ([19]). Land and water resources are limited and their wide utilization is increasing, especially for countries like India, where population pressure is continuously increasing ([21]). The implications of these are remarkable, as will lose crucial life-supporting systems through the loss of important habitats, undermining rural livelihoods because of the degradation of natural resources on which people depend. It shall also diminish economic opportunities, as options for developing medicines and foods will reduce and the natural resource base for tourism will be damaged. Transfer of forest and agricultural lands to industries, hydroelectricity and thermal electricity projects, etc. are current investments. But what do we do to compensate the loss of the agriculture and forest? This is important in a context where the 70% of the country population lives in villages and depends on agriculture and forest for his livelihood. In addition, social and environmental aspects also need attention. Everybody knows why and to what extent forest resources are essential to protect life on earth. Therefore, documentation on current habitat structure and resource distribution and richness is necessary to estimate their loss. Biodiversity is also being depleted because of legal and illegal trade in economically and medicinally important species ([19]). Keeping in view the necessity of documentation on flora degradation before now, a study was conducted in the project area of Kotlibhel hydroelectric power project 1B (KHEP-1B) in Uttarakhand. The project is likely to submerge about 502.35 ha of land, classified as “Submergence zone”. Some of the areas around the reservoir are also going to be disturbed due to different project related activity and was classified as “Influence zone” The present study deals with the diversity pattern and vegetation characters of the Influence and Submergence zone of the KHEP-1B.
Methodology
To analyze plant diversity, a study was conducted in the area of about 350 km2 along rivers Alaknanda and Ganga between Srinagar and Devprayag. The area covers a stretch of about 30 km long and 7 km wide.
The vegetational analysis was conducted since June 2005 to Feb 2006. The study area was divided into two subareas: “Influence zone” (IZ) and “Submergence zone” (SZ) along the reservoir, as proposed by the Dam authority. The area subjected to submersion up to full reservoir level (FRL - approx. 325 m a.s.l.) was considered as submergence zone and the area along the reservoir up to 7 km radius around the reservoir was considered as influence zone. Some 8 transects were analyzed in the entire study area: Supana-Sundari, Switpul-Swit, Bhallagaun-Hakgaun, Bagwan-Golta, Mullagaun-Kothi, Gunkhal-Semi, Dhanchera-Pali and Saud- Sariyakhal. Each transect was 1500 m long, from the river water level along an increasing altitudinal gradient (Fig. 1). Transects were spatially distributed so as to minimize the autocorrelation among the vegetation. Along each transect, six circular plots (each of 10 m radius) at 200 m intervals were sampled. Circular plots were used for sampling due to undulating surface of the study area. Trees in circular plots were enumerated.
Fig. 1 - The study area.
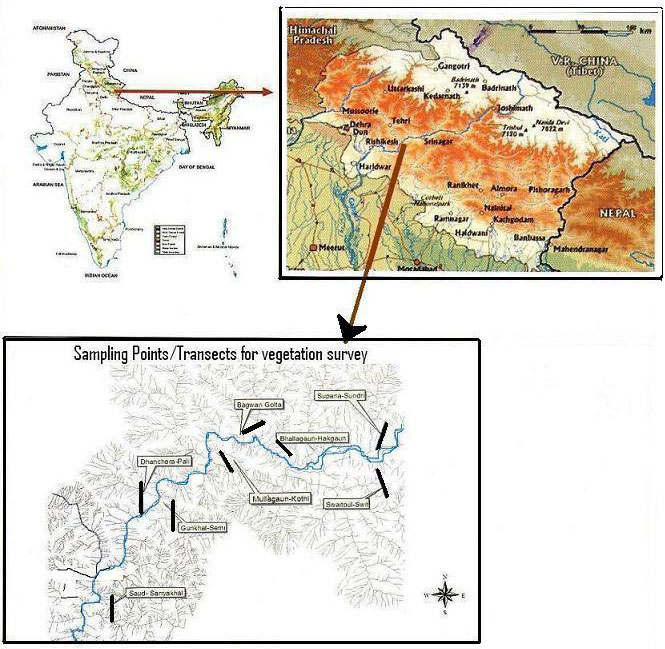
Within each 10 m radius plot, a nested circular plot of 5 m radius was sampled for recording shrubs, whereas four nested circular plots of 1 m radius were established for herbs analisys. Herbs were recorded by point-intercept method for their proportional representation in the area. In order to prepare a checklist and best represent the species from the area, an intensive search was made by re-tracing belt transects in three different seasons.
Species characterized by short stature, including annual or biennial herbs, and by spiny structures (thorns and spines) were classified as shrubs. Herbs included shade- loving, annual, biennial or perennial, herbaceous species. Trees with cbh (circumference at breast height, i.e., 1.37 m above the ground) > 31.5 cm were individually counted in the 10 m radius plot. Herbarium sheets of species which could not be identified in the field were prepared, and identified later at the Department of Botany, HNB Garhwal University. Taxa names were assigned after the nomenclature proposed by Bentham & Hooker ([2]).
Frequency, density, abundance and their relative values for each species were obtained using the equations reported below ([11]). The Important Value Index (IVI) for different species was calculated as sum of relative frequency (RF), relative density (RD) and relative abundance (A) of each species as follows (eqn. 1):
AF ratio for different species was determined for eliciting the distribution pattern in terms of regular (AF<0.025), random (AF=0.025-0.05) and contagious (AF>0.05), as follows ([4] - eqn. 2):
The Shannon’s ([17]) H’ and Simpson’s ([18]) D diversity indices were independently obtained as follows (eqn. 3, eqn. 4):
where pi represents the proportional abundance of i-th species in any given transect.
Species richness (SR) was calculated (eqn. 5) following Margalef ([12]):
where S is the number of species and N the total number of individuals of all species.
Results
Vegetation analysis
In tree layer of IZ, maximum density (36.4 plants/ha) and frequency (95.8 %) was observed for Haldinia cordifolia followed by Pinus roxburghii (density: 33.1 plants/ha; frequency: 89.6 %) and Holoptelea integrifolia (density: 29.2 plants/ha; frequency: 77.1 %). The IVI of different species ranged between 1.43 to 71.88 in IZ. Within SZ highest density (33.8 plants/ha) was recorded for Lannea coromendelica and lowest density (1.3 plants/ha) was recorded for Celtis australis, Ougenia ooginansis and Terminalia chebula. In this zone maximum frequency (31.3 %) was also found for Lannea coromendelica followed by Pinus roxburghii (29.2 %) and Holoptelea integrifolia (27.1). The IVI values of different species within SZ were between 1.73 to 58.77 (Tab. 1).
Tab. 1 - Vegetational characteristics of tree species in the Influence and Submergence zones of the study area. (NR): species present but not recorded within sampled quadrate; (Abs): absent. For the list of additional species found outside the sample plots, see Tab. SM1 in Supplementary Material.
| Species | Influence zone | Submergence zone | ||||||||
|---|---|---|---|---|---|---|---|---|---|---|
| Den | Abu | Fre | IVI | A/F | Den | Abu | Fre | IVI | A/F | |
| Acacia catechu | 7.3 | 1.83 | 12.5 | 9.25 | 0.15 | 22.5 | 2.33 | 18.8 | 29.31 | 0.1 |
| Aegle marmalos | 9.3 | 2 | 14.6 | 10.05 | 0.14 | 13.9 | 2.62 | 27.1 | 14.24 | 0.12 |
| Albizia lebbek | 4 | 2 | 6.3 | 3.53 | 0.32 | 2 | 1 | 6.3 | 3.71 | 0.16 |
| Bauhinia variegata | 2.7 | 1.33 | 6.3 | 3.67 | 0.21 | Abs | ||||
| Bombex cieba | 4 | 1.5 | 8.3 | 9.65 | 0.18 | 9.3 | 2 | 14.6 | 10.64 | 0.14 |
| Carica papaya | 1.3 | 1 | 4.2 | 1.63 | 0.24 | NR | ||||
| Cassia fistula | 2 | 1.5 | 4.2 | 2.61 | 0.36 | 6.6 | 3.33 | 6.3 | 6.46 | 0.53 |
| Celtis australis | NR | 1.3 | 2 | 2.1 | 1.73 | 0.96 | ||||
| Dalbergia sissoo | 2 | 1 | 6.3 | 4.07 | 0.16 | 2 | 1.5 | 4.2 | 3.45 | 0.36 |
| Delonix regia | 0.7 | 1 | 2.1 | 1.74 | 0.48 | Abs | ||||
| Eucalyptus camaldulensis | Abs | 4.6 | 7 | 2.1 | 11.14 | 3.36 | ||||
| Ficus religiosa | NR | 3.3 | 2.5 | 4.2 | 3.55 | 0.6 | ||||
| Grevillia robusta | NR | 2.7 | 4 | 2.1 | 3.76 | 1.92 | ||||
| Haldinia cordifolia | 36.4 | 1.2 | 95.8 | 46.99 | 0.01 | 8 | 4 | 6.3 | 8.73 | 0.64 |
| Holoptelea integrifolia | 29.2 | 1.19 | 77.1 | 37.55 | 0.02 | 26.5 | 3.08 | 27.1 | 23.87 | 0.11 |
| Juglans regia | 1.3 | 2 | 2.1 | 1.43 | 0.96 | Abs | ||||
| Lannea coromendelica | 3.3 | 1.25 | 8.3 | 7.06 | 0.15 | 33.8 | 3.4 | 31.3 | 31.71 | 0.11 |
| Leucaena leucocephala | 4 | 2 | 6.3 | 4.38 | 0.32 | 9.3 | 2.8 | 10.4 | 8.68 | 0.27 |
| Mallotus philippensis | 27.8 | 1.2 | 72.9 | 33.57 | 0.02 | 25.8 | 2.6 | 31.3 | 26.14 | 0.08 |
| Mangifera indica | 6.6 | 2.5 | 8.3 | 23.6 | 0.3 | 12.6 | 2.71 | 14.6 | 58.77 | 0.19 |
| Melia azedarach | 4 | 2 | 6.3 | 4.34 | 0.32 | 6 | 3 | 6.3 | 5.55 | 0.48 |
| Morus alba | 4 | 3 | 4.2 | 4.29 | 0.72 | NR | ||||
| Musa paradisca | 2.7 | 2 | 4.2 | 2.29 | 0.48 | Abs | ||||
| Ougenia ooginansis | NR | 1.3 | 1 | 4.2 | 6.71 | 0.24 | ||||
| Phyllanthus emblica | 2 | 1.5 | 4.2 | 2.05 | 0.36 | Abs | ||||
| Pinus roxburghii | 33.1 | 1.16 | 89.6 | 71.88 | 0.01 | 32.5 | 3.5 | 29.2 | 38.96 | 0.12 |
| Pyrus phasia | 1.3 | 1 | 4.2 | 1.64 | 0.24 | Abs | ||||
| Syzygium cumini | 4.6 | 2.33 | 6.3 | 4.52 | 0.37 | NR | ||||
| Tectona grandis | 1.3 | 1 | 4.2 | 2.24 | 0.24 | Abs | ||||
| Terminalia chebula | 1.3 | 2 | 2.1 | 2.11 | 0.96 | 1.3 | 2 | 2.1 | 2.91 | 0.96 |
| Toona hexandra | 3.3 | 1.25 | 8.3 | 3.84 | 0.15 | NR | ||||
| Total | 199.4 | - | - | 300 | - | 225.3 | - | - | 300 | - |
In the IZ shrub layer, Murrya koenigii was the dominant species with maximum frequency (100%), density (589.2 plants/ha) and IVI (14.5), while in the SZ Ficus hederacea was the dominant shrub with highest frequency (89.6 %), density (844.0 plants/ ha) and IVI (35.14). Minimum density (8.0 plants/ha) was observed for Eupatorium adenophorum and Rhus parviflora. Lowest frequency (4.2 %) was also observed for Eupatorium adenophorum, Rhus parviflora and Urtica dioica (Tab. 2).
Tab. 2 - Vegetational characteristics of shrub species in the Influence and Submergence zones of the study area. (NR): species present but not recorded within sampled quadrate; (Abs): absent. For the list of additional species found outside the sample plots, see Tab. SM2 in Supplementary Material.
| Species | Influence zone | Submergence zone | ||||||||
|---|---|---|---|---|---|---|---|---|---|---|
| Den | Abu | Fre | IVI | A/F | Den | Abu | Fre | IVI | A/F | |
| Adathoda zeylanica | 299.9 | 2.8 | 83.3 | 9.3 | 0.03 | 146 | 1.49 | 77.1 | 15.12 | 0.02 |
| Aerva sanquinolenta | 66.4 | 1.5 | 35.4 | 3.1 | 0.04 | 53.1 | 3.33 | 12.5 | 3.23 | 0.27 |
| Agave fastigata | 108.8 | 2.4 | 35.4 | 3.7 | 0.07 | 45.1 | 3.4 | 10.4 | 2.72 | 0.33 |
| Artemisia roxburghiana | 400.8 | 3.4 | 93.8 | 11.4 | 0.04 | 47.8 | 3.6 | 10.4 | 2.79 | 0.35 |
| Asparagus adscendens | 100.9 | 5.4 | 14.6 | 2.3 | 0.37 | NR | ||||
| Bambusa arundinaceae | 74.3 | 3.5 | 16.7 | 2.1 | 0.21 | 106.2 | 3.33 | 25 | 6.46 | 0.13 |
| Barleria cristata | 467.1 | 3.7 | 100 | 12.7 | 0.04 | 42.5 | 2 | 16.7 | 3.56 | 0.12 |
| Cajanus mollis | 98.2 | 3.4 | 22.9 | 2.8 | 0.15 | 61 | 2.09 | 22.9 | 4.96 | 0.09 |
| Cannavis sativa | 456.5 | 4 | 89.6 | 11.9 | 0.05 | NR | ||||
| Carrisa opeca | 355.7 | 2.8 | 100 | 11.1 | 0.03 | 506.9 | 4.66 | 85.4 | 25.9 | 0.06 |
| Cassia tora | 169.9 | 1.8 | 72.9 | 6.8 | 0.03 | 124.7 | 3.13 | 31.3 | 7.87 | 0.1 |
| Colebrookia oppositifolia | 164.6 | 4.1 | 31.3 | 4.2 | 0.13 | 39.8 | 2.14 | 14.6 | 3.18 | 0.15 |
| Cotinus coggygria | 55.7 | 4.2 | 10.4 | 1.4 | 0.4 | 90.2 | 4.25 | 16.7 | 4.82 | 0.26 |
| Debregeasia longifolia | 47.8 | 3 | 12.5 | 1.4 | 0.24 | 18.6 | 2.33 | 6.3 | 1.4 | 0.37 |
| Eupatorium adenophorum | 292 | 2.8 | 83.3 | 9.2 | 0.03 | 8 | 1.5 | 4.2 | 0.82 | 0.36 |
| Euphorbia royleana | 63.7 | 2.7 | 18.8 | 2 | 0.14 | 18.6 | 2.33 | 6.3 | 1.4 | 0.37 |
| Ficus hederacea | 103.5 | 2.6 | 31.3 | 3.4 | 0.08 | 844 | 7.57 | 89.6 | 35.14 | 0.09 |
| Lantana camara | 453.9 | 3.6 | 100 | 12.5 | 0.04 | 499 | 4.7 | 83.3 | 25.39 | 0.06 |
| Murrya koenigii | 589.2 | 4.6 | 100 | 14.5 | 0.05 | 29.2 | 2.2 | 10.4 | 2.29 | 0.21 |
| Nyctanthes arbo-tritis | 84.9 | 3.6 | 18.8 | 2.3 | 0.19 | 100.9 | 4.75 | 16.7 | 5.11 | 0.29 |
| Pueraria tuberosa | 63.7 | 4 | 12.5 | 1.7 | 0.32 | 809.5 | 7.09 | 87.5 | 34.53 | 0.08 |
| Pupalia lapaca | 61 | 1.9 | 25 | 2.4 | 0.08 | NR | ||||
| Reinwardtia indica | 90.2 | 1.7 | 41.7 | 3.8 | 0.04 | NR | ||||
| Rhus parviflora | 445.9 | 3.7 | 93.8 | 12 | 0.04 | 8 | 1.5 | 4.2 | 0.82 | 0.36 |
| Ricinus communsis | 483.1 | 3.8 | 100 | 12.9 | 0.04 | NR | ||||
| Rubus ellipticus | 464.5 | 3.8 | 95.8 | 12.4 | 0.04 | Abs | ||||
| Sida cordifolia | 98.2 | 1.4 | 54.2 | 4.7 | 0.03 | NR | ||||
| Tephrosia candida | 236.2 | 3.7 | 50 | 6.4 | 0.07 | 50.4 | 4.75 | 8.3 | 2.55 | 0.57 |
| Urtica dioica | 50.4 | 2.4 | 16.7 | 1.7 | 0.14 | 10.6 | 2 | 4.2 | 0.89 | 0.48 |
| Woodfordia fruiticosa | 172.5 | 2.6 | 52.1 | 5.6 | 0.05 | 21.2 | 2 | 8.3 | 1.78 | 0.24 |
| Xanthium indicum | 90.2 | 3.4 | 20.8 | 2.5 | 0.16 | NR | ||||
| Ziziphus oxyphylla | 252.1 | 5.6 | 35.4 | 5.7 | 0.16 | 90.2 | 2.13 | 33.3 | 7.26 | 0.06 |
| Total | 6961.9 | - | - | 200 | - | 3771.6 | - | - | 200 | - |
In the IZ herb layer, Chrysopogon aciculatus showed highest density (5506.9 plants/ha) followed by Cynadon dactylon (3781.8 plants/ha) and Evolvulus alsinoides (3416.9 plants/ha). These species have also maximum frequency (100 %) among all herb species. The observed IVI for herb species was between 1.59 to 16.52 in this zone. On the other hand, in the SZ highest density (5540.1 plants/ha) was calculated for Desmodium triflorum followed by Heteropogon melanocarpus (5490.3 plants/ha) and Heteropogon controtus (5457.1 plants/ha), whereas maximum frequency (96.4 %) was recorded for Heteropogon melanocarpus and lowest frequency (13.5 %) for Digitaria ciliaris. The observed IVI value in this zone ranged between 2.87 to 14.25 (Tab. 3).
Tab. 3 - Vegetational characteristics of herb species in the Influence and Submergence zones of the study area. (NR): species present but not recorded within sampled quadrate; (Abs): absent. For the list of additional species found outside the sample plots, see Tab. SM3 in Supplementary Material.
| Species | Influence zone | Submergence zone | ||||||||
|---|---|---|---|---|---|---|---|---|---|---|
| Den | Abu | Fre | IVI | A/F | Den | Abu | Fre | IVI | A/F | |
| Ajuga bracteosa | 1791.4 | 0.97 | 44.3 | 6.3 | 0.03 | 1161.1 | 2.05 | 19.8 | 2.97 | 0.09 |
| Alysicarpus bupleurifolius | 2023.6 | 1.07 | 43.2 | 6.58 | 0.03 | 2023.6 | 1.83 | 29.7 | 4.82 | 0.07 |
| Anaphalis adnata | 1227.4 | 1.73 | 29.7 | 4.27 | 0.04 | Abs | ||||
| Artimissia capalaris | 879.1 | 2.43 | 14.1 | 2.49 | 0.14 | 1857.7 | 1.3 | 29.7 | 4.6 | 0.07 |
| Arundinella nepalensis | 1061.6 | 1.54 | 15.1 | 2.86 | 0.15 | NR | ||||
| Bidens pilosa | 1940.7 | 2 | 42.7 | 6.41 | 0.03 | Abs | ||||
| Brachiaria ramosa | 597.1 | 1.96 | 8.9 | 1.63 | 0.24 | 1459.7 | 2 | 16.7 | 3.12 | 0.17 |
| Cassia absus | 1210.8 | 1.51 | 15.6 | 3.13 | 0.16 | 3715.5 | 1.43 | 58.3 | 9.13 | 0.03 |
| Celosia argentea | 1327 | 1.79 | 27.6 | 4.26 | 0.06 | 2537.8 | 1.37 | 37.5 | 6.06 | 0.06 |
| Chrysopogon aciculatus | 5506.9 | 1.45 | 100 | 16.52 | 0.02 | 1310.4 | 1.96 | 30.2 | 3.94 | 0.05 |
| Chrysopogon fulvus | 2040.2 | 1.66 | 51 | 7.22 | 0.03 | 1808 | 2.13 | 31.3 | 4.66 | 0.06 |
| Crotolaria medicagina | 663.5 | 1.47 | 13.5 | 2.11 | 0.11 | 1426.5 | 1.48 | 31.3 | 4.17 | 0.05 |
| Cynadon dactylon | 3781.8 | 1.76 | 100 | 13.81 | 0.01 | 4362.4 | 1.22 | 43.2 | 8.83 | 0.07 |
| Cynoglosum glochidiatum | 2703.7 | 2.75 | 49 | 8.1 | 0.04 | 928.9 | 1.45 | 22.4 | 2.87 | 0.06 |
| Cyperus comprsssus | 829.3 | 2.16 | 12 | 2.25 | 0.18 | 2040.2 | 2.14 | 42.7 | 5.81 | 0.04 |
| Datura innoxia | 1409.9 | 1.56 | 18.8 | 3.69 | 0.13 | 1973.9 | 2.87 | 24 | 4.32 | 0.11 |
| Desmodium triflorum | 3018.8 | 2.04 | 97.4 | 12.41 | 0.01 | 5540.1 | 2.08 | 84.9 | 13.45 | 0.02 |
| Digitaria ciliaris | 1575.8 | 1.43 | 19.8 | 4.03 | 0.13 | 1625.5 | 2.07 | 13.5 | 3.1 | 0.28 |
| Eragrostis minor | 1310.4 | 1.43 | 14.1 | 3.16 | 0.21 | 1443.1 | 1.32 | 24.5 | 3.68 | 0.08 |
| Euphorbia hirta | 1244 | 1.43 | 25 | 3.92 | 0.06 | 1360.1 | 1.94 | 32.3 | 4.16 | 0.04 |
| Evolvulus alsinoides | 3416.9 | 1.8 | 100 | 13.24 | 0.01 | 1758.2 | 1.84 | 30.2 | 4.51 | 0.06 |
| Fumaria indica | 879.1 | 1.76 | 13.5 | 2.45 | 0.15 | 1111.3 | 1.82 | 21.4 | 3.02 | 0.08 |
| Galium aprine | 978.6 | 2.36 | 14.6 | 2.69 | 0.14 | 1824.6 | 1.67 | 46.9 | 5.85 | 0.03 |
| Geranium ocelatum | 564 | 1.46 | 9.9 | 1.66 | 0.18 | 2007 | 2.59 | 42.7 | 5.77 | 0.04 |
| Heteropogon controtus | 1459.7 | 1.3 | 18.2 | 3.73 | 0.14 | 5457.1 | 2.05 | 89.6 | 13.7 | 0.02 |
| Heteropogon melanocarpus | NR | 5490.3 | 2.09 | 96.4 | 14.25 | 0.02 | ||||
| Ipomoea hederifolia | 514.2 | 2.23 | 9.9 | 1.59 | 0.17 | 1575.8 | 1.42 | 27.6 | 4.09 | 0.07 |
| Leucas cephalotes | 547.4 | 1.68 | 6.3 | 1.35 | 0.44 | 1277.2 | 1.82 | 19.3 | 3.08 | 0.11 |
| Leucas lanata | 1210.8 | 1.27 | 22.9 | 3.71 | 0.07 | 2471.5 | 1.85 | 53.6 | 7.18 | 0.03 |
| Malva sylvestris | 1327 | 1.73 | 19.3 | 3.6 | 0.11 | 1509.4 | 1.36 | 22.9 | 3.65 | 0.09 |
| Micromaria biflora | 2189.5 | 2.93 | 39.1 | 6.51 | 0.05 | 1426.5 | 1.91 | 15.6 | 3 | 0.18 |
| Nepeta hindostana | 1443.1 | 1.26 | 20.3 | 3.87 | 0.11 | 1210.8 | 1.79 | 18.2 | 2.92 | 0.11 |
| Nicotiana plumbaginifolia | 1161.1 | 2.51 | 25 | 3.79 | 0.06 | 1327 | 3.17 | 20.3 | 3.22 | 0.1 |
| Origanum vulgare | 1725 | 1.19 | 30.7 | 5.13 | 0.06 | Abs | ||||
| Oxalis corniculata | 912.3 | 2.17 | 14.1 | 2.54 | 0.15 | 1608.9 | 1.5 | 26 | 4.01 | 0.07 |
| Physalis divaricata | 1177.7 | 2.21 | 25.5 | 3.86 | 0.06 | 2703.7 | 2.75 | 69.8 | 8.69 | 0.02 |
| Rumx hastatus | 1874.3 | 2.12 | 41.1 | 6.18 | 0.04 | 1874.3 | 3.77 | 32.3 | 4.82 | 0.06 |
| Scutellaria scandems | 1310.4 | 2.5 | 24.5 | 3.99 | 0.07 | 1741.6 | 1.22 | 38.5 | 5.12 | 0.04 |
| Sedum multicaule | 1127.9 | 2.11 | 17.7 | 3.17 | 0.11 | 2156.3 | 1.79 | 49.5 | 6.47 | 0.03 |
| Sida rhombifolia | 1111.3 | 1.63 | 22.9 | 3.55 | 0.07 | 1575.8 | 1.63 | 18.8 | 3.42 | 0.14 |
| Sida cordata | 1327 | 2.04 | 29.2 | 4.38 | 0.05 | NR | ||||
| Viola canescens | 1310.4 | 1.52 | 22.9 | 3.86 | 0.08 | 1327 | 2.64 | 25 | 3.57 | 0.07 |
| Total | 63710.6 | - | - | 200 | - | 78008.6 | - | - | 200 | - |
Distribution pattern
The abundance/frequency ratios (A/F) obtained showed that most of species were contagiously distributed in both IZ and SZ. In the tree layer, 84.5 % species were found in contagious pattern within IZ and 15.4% were randomly distributed. For shrubs in the IZ, 50% species were in contagious and 50% in random distribution, while in SZ 95.8% species were in contagious distribution and 4.2 % were in regular distribution pattern (Tab. 1, Tab. 2, Tab. 3).
Diversity
Among all vegetation layer of IZ and SZ, the maximum number of species was encountered for the herb layer of IZ (41) and the minimum (20) for the tree layer in the SZ. Shannon diversity (H’) was highest for the herb layer of IZ (3.561) and minimum for shrub layer of the SZ (2.370). The Simpson diversity was ranging between 0.034 to 0.138. Margalef index showed maximum value for the herb layer in the IZ (4.8) and minimum (3.2) for shrub layer in the SZ (Tab. 4).
Tab. 4 - Diversity indices and species richness in the both zone of study area. IZ: Influence Zone; SZ: Submergence Zone
| Diversity indices | Tree | Shrub | Herb | |||
|---|---|---|---|---|---|---|
| IZ | SZ | IZ | SZ | IZ | SZ | |
| Species Richness | 26 | 20 | 32 | 24 | 41 | 37 |
| Shannon index (H) | 2.430 | 2.643 | 3.184 | 2.37 | 3.561 | 3.48 |
| Simpson index (CD) | 0.134 | 0.086 | 0.050 | 0.138 | 0.034 | 0.036 |
| Margalef index (SR) | 4.6 | 4.0 | 3.9 | 3.2 | 4.8 | 4.3 |
Shannon and Simpson diversity indices for tree layer did not show significant differences between IZ and SZ after t-test. On the other hand, Margalef index for trees showed significant difference between these two zones (P<0.001, df. 13). Shannon diversity and Margalef indices for shrubs were significantly different bewteen IZ and SZ (P<0.001, df 12), while no significant differences were detected for Simpson diversity index. Herbs also showed the similar trend as shrubs of IZ and SZ.
Discussion
Disturbance has become a widespread feature in most of the forest all over the Himalaya ([20]). Knowledge on ecological process and biotic pressure may help in understanding the persistence of long-lived plant communities. Tree density observed in this study is lower than that recorded for mid-elevational forests in Central Himalaya ([7]), but similar to those reported (5 to 325 plants/ha) by Sanjeev et al. ([15]) in a micro watershed area of Mussoorie in Garhwal Himalaya. Similarly, shrub densities in this study are lower than those reported by Hussain et al. ([5]) but similar to what observed by Khera et al. ([7]). Furthermore, Negi et al. ([13]) reported herb density in Garhwal Himalaya similar to that found in the present study.
The changes in the dispersion patterns may reflect the reactions of species to disturbance, as well as to changes in the habitat conditions ([14]). The analysis of species’ distribution pattern based on the A/F ratio indicated that most of the species of both zones were distributed in contagious pattern. Joshi & Tiwari ([6]) and Bhandari et al. ([3]) also reported a fairly similar distribution pattern of woody vegetation in different parts of Garhwal Himalaya.
Shannon species diversity (H′) and concentration of dominance (cd) of the present study sites are more or less similar to the values reported by Kunwar & Sharma ([10]) in a comparative study between two community forests in Dolpa district of mid-west Nepal. These values were comparable with those reported for the Chir pine forest in Garhwal Himalaya ([3]). The low diversity oberved in this investigation may be interpreted as due to greater anthropogenic pressure.
Species richness in out study showed higher values for ground vegetation (herbs), followed by shrubs and trees. Khera et al. ([7]) also found the same pattern of species richness. Hussain et al. ([5]) also found overall 63 tree, 56 shrub, 90 herb and 21 grass species in Kumaon Himalaya. In a comparative study between Panchayat and Reserve forest in Garhwal Himalaya, Negi et al. ([13]) reported a similar richness trend (Herb>Tree>Shrub). Saxena & Singh ([16]) have also recorded high species richness (4 to 22) and diversity (0.74 to 3.10) for shrub layer in Kumaun Himalaya. Influence zone showed a higher species richness in our study, while Adhikari et al. ([1]) found higher richness in the Submergence zone of the Tehri hydroelectric dam in Uttarakhand.
Conclusion
The vegetation of the study area is important for sustaining the livelihood of local people. The present study suggests that the influence zone has the maximum species diversity and richness. Diversity was high where the dominance of canopy species was major and low near agricultural fields or on disturbed sites. The vegetation composition of both zones was found almost in similar pattern, though species richness was larger in the Influence zone. Hence, it may be hypothesized that after construction of proposed hydropower project there may be negligible effect on the species richness of the surrounding vegetation, but definitely a significant portion of the vegetation is going to be lost for ever. The change in landuse of riverine belt might also change the micro habitat requirement of many species. This of course require detailed investigation in order to conclude species specific impact of the proposed hydropower project.
References
Gscholar
Gscholar
Gscholar
Gscholar
Gscholar
Gscholar
Gscholar
Gscholar
Gscholar
Gscholar
Gscholar
Gscholar
Authors’ Info
Authors’ Affiliation
S Dasgupta
V Jhaldiyal
DS Chauhan
NP Todaria
Department of Forestry, HNB Gharwal University Campus, Srinagar, Garhwal, Uttarakhand (India)
Corresponding author
Paper Info
Citation
Singh V, Dasgupta S, Jhaldiyal V, Chauhan DS, Todaria NP (2011). Diversity pattern of vegetation in and around proposed Kotlibhel hydroelectric project along the Alaknanda River in Garhwal Himalaya (India). iForest 4: 38-43. - doi: 10.3832/ifor0557-004
Paper history
Received: Sep 10, 2010
Accepted: Dec 13, 2010
First online: Jan 27, 2011
Publication Date: Jan 27, 2011
Publication Time: 1.50 months
Copyright Information
© SISEF - The Italian Society of Silviculture and Forest Ecology 2011
Open Access
This article is distributed under the terms of the Creative Commons Attribution-Non Commercial 4.0 International (https://creativecommons.org/licenses/by-nc/4.0/), which permits unrestricted use, distribution, and reproduction in any medium, provided you give appropriate credit to the original author(s) and the source, provide a link to the Creative Commons license, and indicate if changes were made.

Web Metrics
Breakdown by View Type
Article Usage
Total Article Views: 60005
(from publication date up to now)
Breakdown by View Type
HTML Page Views: 47642
Abstract Page Views: 4202
PDF Downloads: 6489
Citation/Reference Downloads: 21
XML Downloads: 1651
Web Metrics
Days since publication: 5588
Overall contacts: 60005
Avg. contacts per week: 75.17
Article Citations
Article citations are based on data periodically collected from the Clarivate Web of Science web site
(last update: Mar 2025)
Total number of cites (since 2011): 6
Average cites per year: 0.40
Publication Metrics
by Dimensions ©
Articles citing this article
List of the papers citing this article based on CrossRef Cited-by.
Related Contents
iForest Similar Articles
Research Articles
Towards a functional phytosociology: the functional ecology of woody diagnostic species and their vegetation classes in Northern Italy
vol. 14, pp. 522-530 (online: 22 November 2021)
Research Articles
Influences of mature Pinus nigra plantations on the floristic-vegetational composition along an altitudinal gradient in the central Apennines, Italy
vol. 13, pp. 279-285 (online: 03 July 2020)
Commentaries & Perspectives
The role of plant sociology in the study and management of European forest ecosystems
vol. 6, pp. 55-58 (online: 21 January 2013)
Research Articles
Improving the harvester functionality by optimizing the manipulator kinematic scheme
vol. 18, pp. 227-233 (online: 26 August 2025)
Short Communications
Biodiversity inventory of trees in a neotropical secondary forest after abandonment of shaded coffee plantation
vol. 10, pp. 303-308 (online: 23 February 2017)
Research Articles
Allometric models for estimating biomass, carbon and nutrient stock in the Sal zone of Bangladesh
vol. 12, pp. 69-75 (online: 24 January 2019)
Technical Advances
Forest stand height determination from low point density airborne laser scanning data in Roznava Forest enterprise zone (Slovakia)
vol. 6, pp. 48-54 (online: 21 January 2013)
Research Articles
Distribution of the major forest tree species in Turkey within spatially interpolated plant heat and hardiness zone maps
vol. 5, pp. 83-92 (online: 30 April 2012)
Research Articles
Growing at the forest edges: how natural regeneration develops under fragmentation
vol. 15, pp. 248-255 (online: 19 July 2022)
Research Articles
Typology and synecology of aspen woodlands in the central-southern Apennines (Italy): new findings and synthesis
vol. 13, pp. 202-208 (online: 19 May 2020)
iForest Database Search
Search By Author
Search By Keyword
Google Scholar Search
Citing Articles
Search By Author
Search By Keywords
PubMed Search
Search By Author
Search By Keyword


