
Fine root production and distribution in the tropical rainforests of south-western Cameroon: effects of soil type and selective logging
iForest - Biogeosciences and Forestry, Volume 3, Issue 5, Pages 130-136 (2010)
doi: https://doi.org/10.3832/ifor0549-003
Published: Sep 27, 2010 - Copyright © 2010 SISEF
Research Articles
Abstract
Little information on fine roots that play an important role in nutrient cycling was available in tropical rainforests. Distribution of fine root production and effects of selective logging on root biomass and nutrient content change were studied in the tropical rainforests of south-western Cameroon. Twenty five root samples were excavated in each of two soil depths (0-10 and 10-25 cm) and in each of three undisturbed forests (Ebom, Ebimimbang and Nyangong) and one disturbed forest by logging, using a square metallic frame of 25 x 25 cm and 30 cm high. Root samples were categorized in three diameter classes: fine (<2 mm), small (2-5 mm) and medium roots (5-20 mm). Root biomass of three diameter classes and nutrients (N, Ca, Mg, K, Na and P) of the two first diameter classes were determined. Results have shown that total root biomass varied from 9.62 (Ebom) to 29.88 t ha-1 (Ebimimbang); those of fine roots decreased from Nyangong (7.43 t ha-1) to Ebom (1.74 t ha-1). In the top soil, the fine root biomass was 2 to 4 time lower in Ebom (1.43 t ha-1) than in other undisturbed forests (3.28 and 5.87 t ha-1). From 70 to 80% of fine root biomass were produced in the first 10 centimeters of soil depth. Nutrient amount in fine root biomass were also lower in Ebom than in Ebimimbang and Nyangong, except the P amount (kg ha-1) which remained high in Ebom. On the contrary, no pattern of nutrient content (g kg-1) changes among forest were found, except N and P that decreased from Ebom to Nyangong. Six years after logging, its effects on root biomass and nutrient changes were not significant and during this period, root production of disturbed forest was high due to rapid regeneration of forest particularly heliophilous tree species.
Keywords
Fine roots, Root biomass, Nutrients, Logging, Tropical rainforest, Cameroon
Introduction
The tropical rainforests of southern Cameroon as African rainforests are subjected to deforestation due to shifting cultivation, commercial timber and forest exploitation ([2]). This is stimulated by demographic and economic crisis forces. To counteract this process, the Cameroonian government has decided to develop, through the Tropenbos Cameroon Programme (TCP), methods and strategies for sustainable management of his rainforests ([5]). Fine roots are one of the factors to take into consideration in sustainable forest management, because of their critical role in nutrient cycling and tree regeneration ([28]). No information on roots is currently available for the tropical rainforests of southern Cameroon, especially on their changes among forest types and the rate of their recovery after selective logging.
Because of their high nutrient absorption capacity and quick turnover, fine roots (0.5 to 2 mm diameter) play a key role in nutrient cycles ([3]). These roots tend to concentrate in the upper layers of the soil containing most of the nutrients released from decomposing litter. It is therefore a nutrient conservation mechanism in forests ([13]). Fine roots which are dynamic components of below-ground biomass represent about 30% of the above-ground biomass ([22]) and between 40 and 85% of the net primary production according to the soil type ([10]). The mortality and decomposition of fine roots contribute substantially to the carbon and nutrients stock in the soil. This contribution is equivalent (or even higher) to that of litterfall that returns carbon and nutrients from canopy to the soil ([8]).
Most of the research on fine roots has been carried out in the temperate region ([35]). However, available information on tropical forests, even though insufficient, show that fine root biomass is higher in tropical forests (4.5 - 92.5 t ha-1) than in the temperate ones (0.5 - 13.0 t ha-1 - [21]). Root biomass assessments as well as the study of root distribution in forest were very studious processes ([9]) because of the difficulty involved in sampling and extraction ([21], [10]). Moreover, contrary to the situation in temperate forests, where the period of dead vegetation material including roots and turnover are asynchronous, the production and mortality of fine root occur simultaneously, making it difficult to distinguish between living and dead roots.
The aim of the present work is to assess the change of fine root biomass and their nutrient content in three undisturbed forests, developed on different soil types according to soil Taxonomy-USDA and differed also by soil chemical characteristic as K, Mg and Ca amount (t ha-1) and available P and water content ([33]). The rate of fine root and their nutrient recovery after selective logging are also examined.
Material and methods
Study area
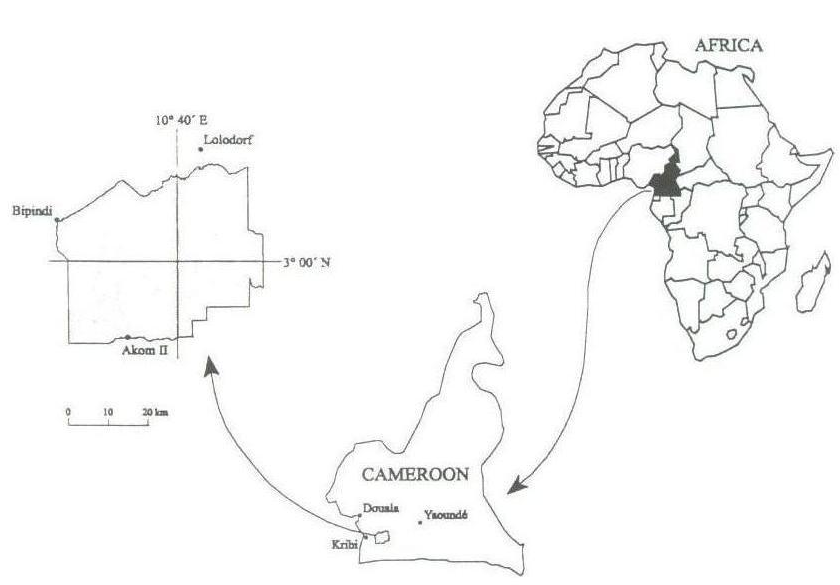
Study sites are situated in the TCP (Tropenbos Cameroon Programme) research area, located in the western part of the Biafran Atlantic forest of south Cameroon ([19]). This part of forests covers an area of about 2000 km2 and is bordered by the villages of Lolodorf, Akom II and Bipindi (Fig. 1). The bed rock is composed of Precambrian metamorphic as well as old volcanic rocks ([6]). The soil characteristics vary with altitude. Between 50 and 350 m a.s.l, soil is a mixture of sand and clay and moderately acidic, whereas around 500 m a.s.l., it is highly clayey and strongly acidic ([33]). The climate is the humid tropical type with four seasons; a long (from mid- november to mid-march) and a short dry season (from mid-may to mid-august); a short (from mid-march to mid may) and a long rainy season (from mid-august to mid-november). Rainfall decreases progressively from the west to the east of the study area with an annual average of 2836 mm at Kribi, 2096 mm at Lolodorf and 1719 mm at Ebolowa, and annual average temperature ranges from 26.4°C at Kribi, 24.6 at Lolodorf and 24.0 °C at Ebolowa ([25]).
Fig. 1 - Location of TCP research area in southwest Cameroon.
The vegetation of the TCP research area is part of this rainforest. The western and central portions of this area, with an altitude of slightly less than 700 m a.s.l., are covered by a evergreen forest characterised by tall trees that reach heights of about 60 m as well as by the presence of Calpocalyx dinklagei, Hymenostegia afzeillii and Saccoglottis gabonensis ([33]). The first two one are medium-sized tree (MT) with DBH (diameter of breast height) ranges from 20 to 60 cm and height from 15 to 40 m. The last is large tree (LT) with DBH > 60 cm and total height > 40 m. The Eastern part is mountainous and covered by a submontane forest, with a canopy that varies between 15 and 20 m high. Characteristic species are Anisophyllea polyneura (LT), Maranthes glabra (MT) and Scorodophloeus zenkeri (LT). The forest has been logged in recent years especially in the eastern part, with the exception of the mountainous parts, by national and international companies, principally the Netherlands Company, WIJMA - Douala SARL (GWZ - [33]). The logging rate was low; averaging 10 m3 ha-1, say 0.7 tree ha-1 the last exploitation ([33]). Only trees with DBH ≥ 80 cm and straight boles of at least six meters were felled. Damages caused by this felling and extraction of the logs from the stand affected less than 8% of the forest area ([11], [4]). At some places in the forest Bantou people practice shifting agriculture with short fallows of Chromolaena odorata (Asteraceae - [23]), while Banyeli Pygmee live from gathering and hunting. Many non timber forest products are harvested ([31]).
Site selection
In the TCP research area, three experimental sites were chosen, at Ebimimbang, Ebom and Nyangong, corresponding respectively to low (100 m a.s.l.), median (about 440 m) and high altitude (> 600 m) forest zones. Moreover, these forests differ in soil types (Ultisols in Ebimimbang, Oxisols/Ultisols in Ebom and Oxisols in Nyangong) as well as in soil nutrient content like available P ([33]). Their geographical location and the climatic, geomorphological, and pedological characteristics are presented in Tab. 1. These three sites are also equally characterized by the absence of any recent natural or anthropogenic disturbance, excepted in the part of Ebom forest, and located near the hydrological experimental sites ([24]).
Tab. 1 - Location and geomorphologic, pedologic and climate characteristics of study sites. (*): mean annual rainfall from 1996 to 2000; (**): soil depth: 0-10 cm. Source: van Gemerden & Hazeu ([33]).
| Characteristics | Ebimimbang (B) | Ebom (A1) | Nyangong (N) |
|---|---|---|---|
| Location | 3°03’N, 10°28’E | 3°05’N, 10°41’E | 2°58’N, 10°45’E |
| Altitude (m a.s.l.) | 100 | 440 | > 600 |
| Rainfall (mm) * | 1817 | 2115 | 1983 |
| Relief intensity (m km-1) | low (< 30) | moderate (30-80) | high (120-250) |
| River density | high | moderate | low |
| Vegetation | lowland forest | lowland forest | sub-montan forest |
| Land uses | high logging and agriculture |
low logging and agriculture |
logging absent and low agriculture |
| Soil types | ultisols | ultisols/oxisols | oxisols |
| Clay (0-20 cm - %) | 0-25 | 20-50 | 35-70 |
| Clay (20-60 cm) | 20-45 | 35-60 | 50-80 |
| Sandy (%)** | 60-90 | 40-60 | 10-40 |
| pH (water) | 6.1 | 4.7 | 4.3 |
| Carbon (%)** | 2 - 3.5 | 4 - 8 | 4 - 9 |
| Nitrogen (%)** | 0.15 - 0.35 | 0.25 - 0.50 | 0.25 - 0.40 |
In each of the three sites, five plots of 100 m2 were chosen at random. To evaluate the impact of logging on the variation of fine root biomass, five other plots of 100 m2 were chosen in a part of the Ebom forest logged 6 years before. In each plot, five sub-plots of 1 m2 were selected, 1 at the 4 corners and other one in the middle of the plot ([17]).
Root Sampling
Root sampling was carried out during the long dry season of 2001 (january - early march). All the sub-plots were carefully cleared manually of grass and litter, taking care not to damage the superficial roots. A root pre-sampling was carried out in another part of the forest and it showed that most of the fine roots are located in the upper 10 cm of the soil. In each of the 100 sub-plots of 1 m2, a block of soil was excavated in the middle at two different depths (0-10 and 10 - 25 cm) using a metal frame of a 25 cm side and 30 cm high, making a total of 200 samples. The soil blocks (cores) containing these roots were transported to the river and washed over a sieve with a 0.5 mm mesh. These roots samples were then collected by hand and stored in labelled paper bags and transported to the laboratory at Kribi, where they were dried in the oven at 60°C for 48h. They were then separated according to diameter classes in keeping with the model of Vogt & Persson ([36]): fine roots (< 2 mm), small roots (2-5 mm) and medium roots (5-20 mm). The biomass of each root category, expressed in dry mass tonnes per hectare (t ha-1) was determined by weighing after drying in the oven at 60°C for 24 h to eliminate residual humidity.
Chemical analysis
The 25 samples of each of the first two diameter class (fine and small roots) by each depth of each forest type were lumped in three main replicates. This gave 12 samples (3 replicates x 2 diameter classes x 2 depths) to chemical analyse per forest type. The medium category (5 - 20 mm diameter) was not included in the chemical analysis because only very few roots were collected here. Powder samples, obtained after grounding in a Micro Hammer Mill Culatti grounder equipped with a 1 mm link filter, were analysed. The samples were first mineralized by passing the plant powder through an oven at 550°C for 40 minutes. The ashes were diluted with a HNO3 solution for nutrient analysing: K and Na were analysed by flame spectrophotometer, P by vanado - molybdate colorimeter and Ca and Mg by atomic absorption spectrophotometer. N was assessed by the Kjeldhal method (titration by sulphuric acid at 0.01N).
Statistical analysis
Before performing any statistical analysis, all variables were tested for normality and if necessary transformed. The comparison among undisturbed forests for the root biomass and the nutrient quantity was carried out by using ANOVA, followed by Scheffe’s test at 5% if ANOVA is significant. A Student’s test was used to compare soil depths, root diameter classes as well as the disturbed and undisturbed parts of the Ebom forest. These tests were conducted using SX statistical software (version 4.0, Analytical software 1992).
Results
Root biomass
Variation among three undisturbed forests
The root biomass did not differ significantly between diameter classes, except at Nyangong, at overall depth of 0-25 cm, and at Ebimimbang, at depth of 0-10 cm and 0-25 cm (Tab. 2). For these two depths, the means comparison through the Scheffer’s test shows that the small and fine roots do not differ significantly in their biomass. This biomass tends to decrease with depth in these three forest types (for example, for fine roots from 1.4 to 0.3 at Ebom, from 3.3 to 1.4 at Ebimimbang and from 5.9 to 1.6 t ha-1 at Nyangong). Only at Ebom, small roots increase with depth (from 1.2 to 3.4 t ha-1).
Tab. 2 - Mean root biomass (standard errors in parenthesis) in t ha-1 of dry mass in the three undisturbed forest types and a disturbed forest of southern Cameroon. Different letters indicate that the values are significantly different. a et b for comparison of diameter classes of the roots (vertical) and α and β for comparison of three forest types: A1, B and N (horizontal). Student tA1A2 for comparison between undisturbed (A1) and disturbed (A2) forests. (ns): no significant; (*): P < 0.05; (**): P < 0.01; (***): P < 0.001.
| Soil depths (cm) | Diameter classes of roots (mm) | Undisturbed forests | Disturbed Forests | ||||
|---|---|---|---|---|---|---|---|
| FBNA1 | Ebimimbang (B) | Nyangong (N) | Ebom (A1) | Ebom (A2) | Student tA1A2 | ||
| 0-10 | <2 | 4.23* | 3.28 (1.62)b αβ | 5.87 (3.31) β | 1.43 (1.22) α | 2.78 (0.69) | 1.93ns |
| 2 - 5 | 3.29ns | 3.13 (0.97)b | 3.47 (2.04) | 1.15 (0.83) | 1.51 (0.49) | 0.75ns | |
| 5-20 | 3.71* | 16.38 (10.34)a β | 9.55 (7.96) αβ | 1.95 (1.31)α | 1.94 (1.70) | 0.01ns | |
| - | F | 7.86** | 1.80ns | 0.51ns | 1.39ns | - | |
| 10-25 | <2 | 2.89ns | 1.42 (0.91) | 1.56 (1.02) | 0.31 (0.30) | 0.61 (0.17) | 1.74ns |
| 2 - 5 | 0.81ns | 1.08 (0.92) | 0.78 (0.29) | 3.42 (6.26) | 3.49 (6.21) | 0.02ns | |
| 5-20 | 1.46ns | 4.60 (3.08) | 3.88 (3.48) | 1.36 (1.63) | 0.73 (0.20) | 0.76ns | |
| - | F | 5.09 ns | 2.95ns | 0.71ns | 0.82ns | - | |
| Total (0-25) | <2 | 5.25* | 4.70 (1.98)b α β | 7.43 (3.79)ab β | 1.74 (0.95)α | 3.39 (0.85) | 2.59* |
| 2 - 5 | 0.01 | 4.20 (1.25)b | 4.25 (1.99)b | 4.57 (6.65) | 5.00 (6.24) | 0.10ns | |
| 5-20 | 6.82* | 20.98 (8.58)a β | 13.43 (7.90)a αβ | 3.31 (2.23) α | 2.67 (1.61) | 0.47ns | |
| - | F | 17.26*** | 4.04* | 0.48ns | 0.40ns | - | |
| Total general | - | - | 29.88 | 25.11 | 9.62 | 11.06 | - |
Root biomass varies among forest types for each diameter classes and soil depth (Tab. 2). In general, root biomass difference is significant only for the fine and medium roots at depths of 0-10 cm and at the overall considered soil depth (0-25 cm). Fine root biomass decreases significantly from Nyangong (5.87 and 7.43 t ha-1) to Ebom (1.43 and 1.74 ha-1); medium root biomass decreases from Ebimimbang (16.38 and 20.98 ha-1) to Ebom (1.95 and 3.31 ha-1). On the other hand, there is no significant difference among forests for small root biomass, no matter the depth.
Variation between undisturbed and disturbed forests at Ebom
Due to the large variation per site (high S.E.), root biomass is not significant different between the disturbed and undisturbed forest, except the total amount of the fine root biomass, which is significantly higher in the disturbed than undisturbed forest (Tab. 2). In disturbed as well as undisturbed forests, small root biomass tends to increase with depth, while that of fine roots tends to decrease.
Nutrients
Variation among three undisturbed forests
Nutrient contents (g kg-1) of fine and small roots at two soil depths of three forests are given in Tab. 3. They vary according to the forest, depth, diameter class and nutrient considered. The variations of N and P contents among forests are similar. They tend to decrease from Ebom (N: 20.8; 17.2; 21.7 and P: 1.4; 1.4; 1.8 g kg-1) to Ebimimbang (N: 8.8; 7.4; 6.7 and P: 0.4; 0.4; 0.4 g kg-1) respectively for the small roots at the two depth and for fine roots at a depth of 10-20 cm (Tab. 3). In topsoil, these two nutrients tend to decrease from Ebom (N: 18.7 and P: 2.0 g kg-1) to Nyangong (N: 11.6 and P: 0.5 g kg-1) for fine roots. Mg content decreases from Nyangong (0.8; 0.5 and 0.9 g kg-1) to Ebimimbang (0.5; 0.3 and 0.3 g kg-1) respectively for the two first diameter classes at a depth of 0-10 cm and small roots at a depth of 10-25 cm. On the other hand, for fine root at a depth of 10-25 cm, a decrease in Mg content is witnessed from Ebom (0.5 g kg-1) to Ebimimbang (0.2 g kg-1). For the other nutrient contents, no clear trend of variation was noticed among the three forests.
Tab. 3 - Nutrient contents (g kg-1) of the fine and small roots of three undisturbed forests and disturbed forest in southern Cameroon. Soil depth (cm); RDC: root diameter classes (mm).
| Forest: | Ebimimbang forest (B) | Nyangong forest (N) | Undisturbed Ebom forest (A1) | Disturbed Ebom forest (A2) | ||||||||||||
|---|---|---|---|---|---|---|---|---|---|---|---|---|---|---|---|---|
| Depth: | 0 - 10 | 10 - 25 | 0 - 10 | 10 - 25 | 0 - 10 | 10 - 25 | 0 - 10 | 10 - 25 | ||||||||
| RDC: | <2 | 2-5 | <2 | 2-5 | <2 | 2-5 | <2 | 2-5 | <2 | 2-5 | <2 | 2-5 | <2 | 2-5 | <2 | 2-5 |
| N | 13.65 | 8.75 | 7.35 | 6.65 | 11.62 | 13.09 | 12.25 | 13.30 | 18.73 | 20.83 | 17.15 | 21.70 | 14.35 | 18.25 | 15.75 | 16.80 |
| P | 0.66 | 0.39 | 0.39 | 0.39 | 0.53 | 0.53 | 0.66 | 0.66 | 1.95 | 1.37 | 1.37 | 1.80 | 1.82 | 1.68 | 1.41 | 1.41 |
| K | 4.36 | 1.33 | 0.80 | 1.15 | 3.72 | 2.94 | 3.04 | 1.05 | 1.59 | 1.06 | 0.99 | 1.21 | 0.79 | 1.27 | 0.99 | 1.04 |
| Ca | 4.93 | 1.13 | 2.63 | 7.51 | 4.83 | 7.17 | 5.89 | 6.23 | 1.08 | 1.64 | 2.28 | 2.30 | 0.36 | 1.01 | 2.26 | 2.21 |
| Mg | 0.48 | 0.25 | 0.24 | 0.30 | 0.78 | 0.50 | 0.46 | 0.90 | 0.53 | 0.29 | 0.49 | 0.78 | 0.74 | 0.25 | 0.63 | 0.63 |
| Na | 0.01 | 0.06 | 0.07 | 0.02 | 0.04 | 0.02 | 0.02 | 0.04 | 0.03 | 0.02 | 0.02 | 0.03 | 0.04 | 0.02 | 0.02 | 0.02 |
There is a significant difference in the total nutrient amounts (kg ha-1) between the three forests (Tab. 4). Contrary to the situation at Ebom where only P, K and Na amounts of fine roots decrease significantly with soil depth, generally in Ebimimbang and Nyangong, all the nutrients decrease significantly with depth, except Na in fine roots at Ebimimbang, and Mg and Na in small roots at Nyangong (Tab. 4). The nutrient amounts in small roots at a depth of 10-25 cm do not differ significantly among forest. For N and P, there is no significant difference among forests with any diameter class and soil depth, while the amounts of Ca and Na differ significantly in these three forest types, with the exception of the small roots at a depth of 10-25 cm (Tab. 4). For Mg, it is at the top soil that the quantity in roots (fine and small) varies significantly among the forests. In most of the case, the nutrient amounts decrease from Nyangong to Ebom, with some exceptions like the quantities of Ca and Na at Ebimimbang.
Tab. 4 - Comparisons of nutrient amounts (kg ha-1) of roots between soil depths (0-10 and 10-25 cm), among three undisturbed forests (B, N and A1) and between undisturbed (A1) and disturbed (A2) Ebom forests of southern Cameroon. Standard error in parentheses. FBNA1 : Comparisons among three undisturbed forests (B, N and A1); Student t1: Comparison between soil depths (0-10 and 10-25 cm); Student t2: Comparison between undisturbed (A1) and disturbed (A2) Ebom forests. Different letters indicate that significant difference among different forest types. (ns): non significant; (*): P<0.05; (**): P<0.01; (***): P<0.001.
| Kind | Nutrients | Depth (cm) | Undisturbed forests | Disturbed forest | ||||
|---|---|---|---|---|---|---|---|---|
| FBNA1 | Ebimimang (B) | Nyangong (N) | Ebom (A1) | Ebom (A2) | Student t2 | |||
| Fine Roots | N | 0-10 | 1.4ns | 44.72 (22.18) | 68.27 (38.42) | 35.66 (17.51) | 39.91(9.87) | 0.4ns |
| 10-25 | 1.93ns | 10.47 (6.68) | 19.11 (12.50) | 6.99 (4.66) | 9.54 (2.68) | 0.9ns | ||
| Student t1 | 3.31* | 2.72* | 2.74ns | 5.94** | - | |||
| P | 0-10 | 1.06ns | 2.16 (1.07) | 3.09 (1.74) | 3.72 (1.83) | 5.06 (1.25) | 1.2ns | |
| 10-25 | 1.29ns | 0.56 (0.36) | 1.03 (0.67) | 0.56 (0.37) | 0.85 (0.24) | 1.3ns | ||
| - | Student t1 | 3.16* | 2.48* | 2.94* | 6.60*** | - | ||
| K | 0-10 | 4.10ns | 14.29 (7.09) | 21.86 (12.30) | 3.03 (1.49) | 2.21 (0.55) | 1.1ns | |
| 10-25 | 5.80* | 1.14 (0.73)b | 4.74 (3.10)a | 0.40 (0.27)b | 0.60 (0.17) | 1.2ns | ||
| Student t1 | 4.13** | 3.02* | 3.01* | 5.61** | - | |||
| Ca | 0-10 | 5.14* | 16.15 (8.01)ab | 28.36 (15.96)a | 2.06 (1.01)b | 0.99 (0.25) | 2.1ns | |
| 10-25 | 4.30* | 3.75 (2.39)ab | 9.19 (6.01)a | 0.93 (0.62)b | 1.37 (0.38) | 1.2ns | ||
| Student t1 | 3.32* | 2.51* | 1.65ns | 1.65ns | - | |||
| Mg | 0-10 | 5.49* | 1.57 (0.78)b | 4.55 (2.56)a | 1.00 (0.49)b | 2.07 (0.51) | 2.8* | |
| 10-25 | 2.60ns | 0.34 (0.22) | 0.71 (0.46) | 0.20 (0.13) | 0.38 (0.11) | 2.0ns | ||
| Student t1 | 3.40** | 3.30* | 2.73ns | 6.46*** | - | |||
| Na | 0-10 | 6.49* | 0.06 (0.03)b | 0.24 (0.13)a | 0.05 (0.02)b | 1.03 (0.26) | 6.5*** | |
| 10-25 | 4.99* | 0.09 (0.06)a | 0.03 (0.02)b | 0.01(0.01)b | 0.01 (0.003) | 1.1ns | ||
| Student t1 | 0.99ns | 3.36* | 2.89* | 8.00*** | - | |||
| Small Roots | N | 0-10 | 1.31ns | 27.37 (8.52) | 45.39 (26.73) | 31.94 (8.12) | 27.48 (8.90) | 0.7ns |
| 10-25 | 1.93ns | 7.16 (6.09) | 10.39 (3.88) | 98.70 (155.1) | 78.19 (18.55) | 0.2ns | ||
| Student t1 | 4.32** | 2.90* | 0.74ns | 4.95* | - | |||
| P | 0-10 | 3.03ns | 1.23 (0.38) | 1.83 (1.08) | 2.64 (0.67) | 2.54 (0.82) | 0.2ns | |
| 10-25 | 2.07ns | 0.42 (0.36) | 0.51 (0.19) | 8.17 (12.85) | 6.55 (9.93) | 0.2ns | ||
| Student t1 | 3.43** | 2.69* | 0.75ns | 0.81ns | - | |||
| K | 0-10 | 5.36* | 4.16 (1.30)ab | 10.18 (6.00)a | 1.63 (0.41)b | 1.91 (0.62) | 0.7ns | |
| 10-25 | 1.51ns | 1.24 (1.05) | 0.82 (0.31) | 5.50 (8.64) | 4.85 (7.35) | 01ns | ||
| Student t1 | 3.91** | 3.49** | 0.77ns | 0.74ns | - | |||
| Ca | 0-10 | 7.53* | 3.54 (10.95)ab | 24.85 (14.63)a | 2.52 (1.64)b | 1.53 (0.49) | 2.2ns | |
| 10-25 | 0.42ns | 8.08 (6.88) | 4.87 (1.82) | 10.48 (16.48) | 10.28 (15.58) | 0.02ns | ||
| Student t1 | 4.69** | 3.03* | 0.84ns | 0.51ns | - | |||
| Mg | 0-10 | 4.26* | 0.78 (0.24)b | 1.72 (1.01)a | 0.44 (0.11)b | 0.38 (0.12) | 0.7ns | |
| 10-25 | 1.96ns | 0.32 (0.03) | 0.70 (0.26) | 3.52 (5.54) | 2.91 (4.41) | 0.2ns | ||
| Student t1 | 6.85*** | 2.18ns | 0.97ns | 0.49ns | - | |||
| Na | 0-10 | 11.15* | 0.19 (0.06)a | 0.08 (0.05)b | 0.04 (0.01)b | 0.03 (0.01) | 1.1ns | |
| 10-25 | 1.60ns | 0.02 (0.02) | 0.03 (0.01) | 0.15 (0.24) | 0.08 (0.12) | 0.5ns | ||
| Student t1 | 6.15*** | 2.27ns | 0.83ns | 0.69ns | - | |||
Variation between undisturbed and disturbed forest at Ebom
Generally, the N, P, K and Ca contents are higher in the undisturbed than in the disturbed forest (Tab. 3). The Mg content in the fine roots is higher in the disturbed than the undisturbed forest, while in the small roots the variation in the Mg content is other way round, however not significantly. The Na content is the similar in the two forest types.
The nutrient amounts in the roots vary with the soil depth and the root diameter classes in the disturbed forest (Tab. 4). For this forest, the amount of N, P, K, Mg, Na decrease significantly with soil depth, only in the fine roots contrary to Ca amount (t1 = 1.65, P > 0.05).
On the whole, the nutrient amount of the roots do not differ significantly between the disturbed and undisturbed forest, except for Mg (t2 = 2.8, P < 0.05) and Na amount (t2 = 6.50, P < 0.001) whose quantity in fine roots is significantly higher in the disturbed than undisturbed forest.
Discussion
Comparison with literature data
The root biomasses found in the present study fall in the same range of data from other rainforests (Tab. 5). Indeed, in south Cameroon, the total biomass for a soil depth of 0-25 cm range between 10 and 30 t ha-1, with the fine roots (diameter < 2 mm) from 2 to 7 t ha-1, small roots (diameter 2-5 mm) from 4 to 5 t ha-1 and medium roots (diameter 5-20 mm) from 3 to 21 t ha-1. In the Campo Ma’an National park, also in southern Cameroon, Kanmegne ([14]), found 45 t ha-1 roots at a total soil depth of 50 cm. Values found elsewhere show that total root biomass range from 14 to 45 t ha-1, with, 2-33 t ha-1 fine and small root (diameter ≤ 6 mm - Tab. 5). In the Venezuelan forest, Klinge et al. ([16]) came up with an exceptional high value of 132 t ha-1 for all roots and 93 t ha-1 for small roots only.
Tab. 5 - Root biomass (t ha-1) and their nutrient contents (g kg-1) of tropical rainforests. (*): Source: Noij et al. ([21]). TRP: total root phytomass; FR: Fine roots (≤ 6 mm); DC: Diameter class for the fine roots. (1): total depth: 0-25 cm; (2): total depth 0-50 cm.
| Country | TRP | DC (mm) | FR phytomass |
N | P | K | Ca | Mg | Sources |
|---|---|---|---|---|---|---|---|---|---|
| Oxisols/Ultisols (infertile soils) | |||||||||
| Cameroon | 9.6-29.91 | - | - | - | - | - | - | - | This study |
| - | < 2 | 1.7-7.4 | 7.4-18.7 | 0.4-2.0 | 0.8-4.4 | 1.1-5.9 | 0.2-0.8 | This study | |
| - | 2-5 | 4.2-4.6 | 6.7-21.7 | 0.4-1.8 | 1.1-2.9 | 1.1-7.5 | 0.3-0.9 | This study | |
| - | 5-20 | 3.3-21.0 | - | - | - | - | - | This study | |
| 44.52 | - | - | - | - | - | - | - | Kanmegne 2004 | |
| Ghana (Kumasi) | - | 5/6 | - | 10.00 | 0.14 | 0.69 | 1.10 | 0.62 | Greenland & Kowal 1960 |
| Brazil | 32.2 | 6 | 14.57 | - | - | - | - | - | Klinge et al. 1975 |
| Venezuela | - | 6 | 2.0 | - | - | - | - | - | Jordan & Escalante 1980* |
| - | 2 | 15.4 | - | - | - | - | - | Sanford 1980* | |
| 56 | 6 | 32 | - | - | - | - | - | Stark & Pratt 1977* | |
| Other soil types | |||||||||
| Costa Rica | - | 2 | 2.7 | - | - | - | - | - | Raich 1980* |
| 14.4 | 2 | 2.9 | - | - | - | - | - | Jordan 1985* | |
| Venezuela | - | 6 | 32.9 | - | - | - | - | - | Herrera & Klinge 1978* |
| 132.2 | 6 | 92.5 | - | - | - | - | - | Klinge et al. 1975 | |
| Ghana (Kade) | 22.1 | 5/6 | 4.45 | 8.1 | 0.8 | 5.6 | 8.8 | 2.0 | Greenland & Kowal 1960 |
| Nouvelle Guinée | 40.0 | 5 | 2.8 | 7.5 | 0.3 | 3.9 | 7.1 | 6.1 | Grubb & Edwards 1982* |
| Porto Rico | - | 5/6 | - | 7.0 | 0.3 | 4.2 | 5.6 | 1.8 | Ovington & Olsen 1970* |
| Venezuela | - | 5/6 | - | - | 1.2 | 7.1 | 9.3 | 2.7 | Hase & Folster 1982* |
| - | 5/6 | - | 10.0 | 0.1 | 0.7 | 1.1 | 0.6 | Golley et al. 1980* | |
| Tropical forests | - | 5/6 | - | 6.7 | 0.6 | 2.9 | 1.6 | 1.4 | Vitousek & Sanford 1986 |
| - | 5/6 | - | 10.7 | 0.3 | 1.1 | 1.2 | 1.5 | Vitousek & Sanford 1986 | |
Data from the literature on the nutrient contents of root differ from our results in respect of on the nutrient considered and soil type (Tab. 5). The values found in the present study are higher than those of the literature concerning the infertile soil (Oxisols/Ultisols). The results of Greenland & Kowal ([7]) in the Ghanian humid forests, on the same soil type as those of the forests in which we carried out our experiences are generally lower than ours. This is an indication that, in spite of the spatial heterogeneity of nutrient contents in fine roots, the south Cameroon forests belong to the rainforests, rich in nutrients although growing on poor soils (Oxisols/Ultisols).
Influence of soil depth on the vertical distribution of fine root and their nutrients
The distribution of the fine roots, as well as the nutrient amount of the three undisturbed forests decrease significantly with soil depth. Eighty two, 79 and 70% of the fine root biomass are produced in the top layer (0-10 cm), respectively at Ebom, Nyangong and Ebimimbang. This vertical distribution is in conformity with those reported in other tropical forests ([3]). Physical as well as chemical properties of the soils, in as much as the accumulation of litter and organic matter in the topsoil and availability of water led to fine root accumulation in the topsoil ([20]).
Soil texture can equally constitute a factor that is likely to explain this distribution in depth in our study, since the clay percentage increases with soil depth in the three undisturbed forest types (Tab. 1). Furthermore, fine root development in the topsoil, especially in oligotrophic forests is often considered as a nutrient conservation mechanism ([13]). Stark & Jordan ([29]) have shown that fine roots are constitute an efficient nutrient trap, capable of recovering more than 99% of P and Ca, spread in the topsoil.
Spatial variation of root biomass and their nutrient content in the undisturbed forests
The distribution of fine root biomass in the topsoil layer varies in the three forest types. They constitute 54, 34 and 12% of the total biomass respectively at Nyangong, Ebimimbang and Ebom. The share of small roots is equal in these forests, with 33, 32 and 35% respectively at Nyangong, Ebimimbang and Ebom. A comparison of different rainforests has shown that a higher root biomass production occurs in sites that are poor in nutrients ([15]). Noij et al. ([21]) also reported that fine root biomass development is related to soil fertility, that is, the availability of nutrients, especially phosphorus (P) which serves as a limiting factor in the absence of mycorhizia associations, but under conditions where the supply of P is adequate, with all other nutrient becoming limiting for the growth.
Likewise, the three undisturbed forests differ in the nutrient contents in roots. In fact, the variation trend of N and P contents among the forests are similar; with these elements contents tending to decrease from Ebom to Ebimimbang respectively for the two diameter classes for a depth of 10-25 cm and for small roots for a depth of 0-10 cm (Tab. 3). On the contrary, in the topsoil layer, these two nutrients in fine roots tend to decrease from Ebom to Nyangong. The total amounts of the two elements, particularly that of P are also decreased from Ebom (15.09 kg ha-1) to Nyangong (6.46 kg ha-1). This variation is inversely related to the fine root biomass variation, which decreases from the Nyangong forest to that of Ebom.
Van Gemerden & Hazeu ([33]) have shown that the availability of water content in the three forests and the available P and K amounts in the soil (column of 1 m) decrease from the Ebom forest toward that of Nyangong (Tab. 6). This fact partially explains the spatial heterogeneity of the root biomass variation as well as their P amount among these three forests and, confirms the results of Whitmore ([38]) who has shown that the production of fine roots in the topsoil and their nutrient contents vary with soil quality. In infertile soils as that of Nyangong (low P amount), the production of fine roots is high and the nutrient contents are low. Inversely, in fertile soils such as in Ebom (high P amount), fine root biomass is low and the nutrient contents are high. Vitousek & Sanford ([34]) have shown that the fine root turnover can also influence their spatial distribution and their nutrient contents. Unfortunately, the turnover of roots has not been studied in the present work. According to Vitousek & Sanford ([34]), it takes place at rate of 25% per month in the first 10 cm of the Venezuelan soils of the Oxisols type. For the other nutrients, no clear trend is observed in the three undisturbed forests.
Tab. 6 - Variation of soil available P, total K, Mg, Ca and N, and soil water content among three undisturbed forests. Values in kg ha-1. Source: van Gemerden & Hazeu ([33]). (*): at 0 - 20 cm of depth. All elements in soil column of 1 m.
| Elements | Ebom | Ebimimbang | Nyangong |
|---|---|---|---|
| Total N | 8900 | 7000 | 12500 |
| Available P | 28 | 24 | 8 |
| K | 755 | 370 | 360 |
| Mg | 175 | 165 | 195 |
| Ca | 1785 | 1810 | 1065 |
| Water content available (%)* | 17 | 11 | 10 |
Impact of logging on the fine root biomass and their nutrients changes
In this study, differences between the disturbed and undisturbed forests of Ebom are not significant with regard to root biomass and nutrient amounts, except for Mg and Na which are significantly higher in the disturbed than undisturbed forest. This suggests that the impact of selective logging on root biomass and their nutrient loss in Ebom is relatively small and recovery of fine roots was relatively fast. In fact, Van Gemerden & Hazeu ([33]) have shown that less than a tree per hectare was logged during the last exploitation and this means intensity of logging was low in this forest. Van Dam ([30]) found that the effect of disturbance caused by extracting l or 2 trees from stand on the leaching of N, K, Ca and Mg is less serious than the disturbance caused by the logging from 5 to 10 trees. In addition, Van Gemerden ([32]) has reported that recovery of basal area, plant density and species composition was relatively fast in Cameroon, particularly in Ebom forest. Basal area and plant density recovered in 5 years and floristic recovery took 14 years in logged areas. Comparing to other tropical rainforests, structural recovery following selective logging took more than 50 years in Uganda ([27]) and floristic recovery in other regions ranged from 40 to 200 years ([18], [1]). We found after logging, 6 or 7 years have occurred before this assessment and the difference between disturbed and undisturbed forest was not significant. This suggested that the recovery of the fine and small roots took place 5 to 6 years as found by Van Gemerden ([32]) for basal area and plant density. In logging gaps, mass destruction of dominant vegetation cover occurs but generally many seedling and saplings survive the crown fall ([37]) and contribute considerably to the filling of canopy gaps ([26]). As a consequence, regeneration in most logging sites was formed by individuals that were already present before disturbance and pioneers species like Musanga cecropioides.
Conclusion
Our study shows that root biomass in the Cameroonian rainforest - especially of fine roots - are among of the lower values found in other tropical rainforests, growing on the similar soils type as the Oxisols/Ultisols. Fine root biomass decreases with soil depth. Spatial distribution of fine root biomass varies between forest types, especially in the upper of soil layers. Ebom forest has a lowest root production and highest available P amount in the root, while Nyangong forest has highest root production and lowest available P amount and Ebimimbang is intermediate according its root production and available P amount. Mg was found in low quantities in root biomass, especially at Ebom forest. Logging activities provoked nutrient deficit, especially N, P and Ca that is generally present in low amounts in soil, and an increase of the root biomass, especially those of fine roots for landing to nutrient deficits in soils. But, fast fine root recovery, less than 7 years and low extraction of logs from a stand and relative small effects of logging systems on the site lead to insignificant nutrient losses.
Acknowledgements
This work has been done in Tropenbos Cameroon Programme for sustainable management forest of south west of Cameroon, with financing of European commission. The authors thank MAB Ayangma, C Kana and MM Mva for their field and laboratory assistance and technicians of the Laboratoire des Sols et de l’Environnement of the University of Dschang, Cameroon for their chemical analysis.
References
Gscholar
Gscholar
Gscholar
Gscholar
Gscholar
Gscholar
Gscholar
Gscholar
Gscholar
Gscholar
Gscholar
Gscholar
Gscholar
Gscholar
Gscholar
Gscholar
Gscholar
Gscholar
Gscholar
Gscholar
Gscholar
Authors’ Info
Authors’ Affiliation
Department of Biological Sciences, University of Ngaoundere, P.O. Box 454, Ngaoundéré (Cameroon)
Faculty of Agronomy and Agricultural Sciences, University of Dschang, P.O. Box 234, Dschangs (Cameroon)
Institute of Geological and Mining Research, P.O. Box 4110, Yaoundé (Cameroon)
Corresponding author
Paper Info
Citation
Ibrahima A, Mvondo ZEA, Ntonga JC (2010). Fine root production and distribution in the tropical rainforests of south-western Cameroon: effects of soil type and selective logging. iForest 3: 130-136. - doi: 10.3832/ifor0549-003
Paper history
Received: Oct 21, 2009
Accepted: Jun 05, 2010
First online: Sep 27, 2010
Publication Date: Sep 27, 2010
Publication Time: 3.80 months
Copyright Information
© SISEF - The Italian Society of Silviculture and Forest Ecology 2010
Open Access
This article is distributed under the terms of the Creative Commons Attribution-Non Commercial 4.0 International (https://creativecommons.org/licenses/by-nc/4.0/), which permits unrestricted use, distribution, and reproduction in any medium, provided you give appropriate credit to the original author(s) and the source, provide a link to the Creative Commons license, and indicate if changes were made.

Web Metrics
Breakdown by View Type
Article Usage
Total Article Views: 58087
(from publication date up to now)
Breakdown by View Type
HTML Page Views: 47685
Abstract Page Views: 4260
PDF Downloads: 4365
Citation/Reference Downloads: 18
XML Downloads: 1759
Web Metrics
Days since publication: 5768
Overall contacts: 58087
Avg. contacts per week: 70.49
Article Citations
Article citations are based on data periodically collected from the Clarivate Web of Science web site
(last update: Mar 2025)
Total number of cites (since 2010): 8
Average cites per year: 0.50
Publication Metrics
by Dimensions ©
Articles citing this article
List of the papers citing this article based on CrossRef Cited-by.
Related Contents
iForest Similar Articles
Research Articles
Fine root morphological traits and production in coniferous- and deciduous-tree forests with drained and naturally wet nutrient-rich organic soils in hemiboreal Latvia
vol. 16, pp. 165-173 (online: 08 June 2023)
Research Articles
Short-term recovery of fine root carbon stock is inhibited by skid trails in a humid tropical forest
vol. 18, pp. 344-349 (online: 30 November 2025)
Research Articles
Modeling the fine root biomass dispersion using a special influence function
vol. 1, pp. 141-144 (online: 25 November 2008)
Research Articles
Effects of understory removal on root production, turnover and total belowground carbon allocation in Moso bamboo forests
vol. 9, pp. 187-194 (online: 20 November 2015)
Research Articles
Mid-rotation fertilization and liming of Pinus taeda: growth, litter, fine root mass, and elemental composition
vol. 14, pp. 195-202 (online: 24 April 2021)
Research Articles
Thinning effects on soil and microbial respiration in a coppice-originated Carpinus betulus L. stand in Turkey
vol. 9, pp. 783-790 (online: 29 May 2016)
Research Articles
Effects on soil characteristics by different management regimes with root sucker generated hybrid aspen (Populus tremula L. × P. tremuloides Michx.) on abandoned agricultural land
vol. 11, pp. 619-627 (online: 04 October 2018)
Research Articles
Ectomycorrhizae of Norway spruce from its southernmost natural distribution range in Serbia
vol. 12, pp. 43-50 (online: 10 January 2019)
Research Articles
Quantifying the vertical microclimate profile within a tropical seasonal rainforest, based on both ground- and canopy-referenced approaches
vol. 15, pp. 24-32 (online: 27 January 2022)
Research Articles
Net ecosystem production of a tropical secondary forest in Jengka, Pahang, Malaysia
vol. 18, pp. 54-60 (online: 04 April 2025)
iForest Database Search
Search By Author
Search By Keyword
Google Scholar Search
Citing Articles
Search By Author
Search By Keywords
PubMed Search
Search By Author
Search By Keyword


