Spatial and temporal changes of Hyrcanian forest in Iran
iForest - Biogeosciences and Forestry, Volume 2, Issue 5, Pages 198-206 (2009)
doi: https://doi.org/10.3832/ifor0515-002
Published: Oct 15, 2009 - Copyright © 2009 SISEF
Research Articles
Abstract
Original old-growth northern forests of Iran are essential sources of genetic variation, biodiversity, commercial woody products, and various environmental services (e.g., ground water reservation, auxiliary forest products provision, wildlife habitation, and erosion control). Today, the forests are depleting rapidly due to population growth, and associated socio-economic problems, industrial development, urbanism, and more recently intensive/irregular tourism. Satellite image processing and other geo-spatial tools have been used in Iran from the early 80’s to map the vegetative attributes of forests for environmental resource monitoring. This paper aims to build up a basic assumption of when and how the spectral, spatial and temporal features of satellite-borne remote sensing have been applied for the sustainable resource monitoring of the Caspian forests of Iran. To this end, available literature will be reviewed, specific features of the studies discussed in brief, and the future prospects for remote sensing-aided delineation of structural and functional characteristics of the forests will be outlined.
Keywords
Iranian Caspian forests, Natural resource monitoring and management, Remote Sensing, Satellite-borne image analysis
Introduction
Since the launching of the first earth-observation satellite in 1972 (ERTS1), satellite remote sensing has been used for gathering synoptic information on natural resources. The data have been so far used to a variety of applications for sustainable and feasible forest management. These include a wide range of applications, from creating forest area/type maps, to the recent efforts for assessment of sophisticated physiological forest attributes using experimentally-launched optical/radar sensors. Briefly, detecting landscape change over time, relating landscape patterns to biological or physical phenomena, evaluating physiological processes of forest canopies, and quantifying forest cover, biomass, or productivity over varying scales of spatial/spectral/temporal resolution can be listed as some of the applications in which satellite remote sensing has been widely used in forest ecosystems during the recent decades.
As stated by Iverson et al. ([33]), the sophistication of applications evident in recent years has been made possible by the use of more spectrally and/or spatially discriminating sensors; ([2], [1]) the improvement of hardware and software systems designed to process spatially-referenced digital data, and the increased availability, standardization, and compatibility of other spatially-referenced digital datasets such as topographic variables generated from digital elevation models (DEM - [33]). There is much literature on spectral/ spatial features of satellite-borne data related to the electromagnetic spectrum recorded for green vegetation (e.g., forests - [15], [25], [18], [35], [22], [37]). According to Franklin ([22]), remote sensing has been a valuable source of information over the course of the past few decades in mapping and monitoring forest activities ([22]). As the need for increasing quality and quantity of information for such activities becomes more apparent and remote sensing technology continues to improve. It is felt that the role of remote sensing as an information source will be increasingly critical in the future.
The natural forest ecosystems in Iran include a broad range of climatic and geographical conditions. Amongst them, the original old-growth Northern forest covers of Iran (located chiefly on northern slopes of Alborz mountains) in the three provinces of Guilan, Mazandaran and Golestan (Fig. 1) are an unparalleled source of genetic variation, biodiversity, commercial woody products and various environmental services as they are specifically situated in a region associated with specific natural, climatic and socio-economic attributes. The presence of approximately 146 native woody species, some of which are ecologically endemic ([52]), the diverse range of climatic conditions over the approximately 900 × 70 km2 of horizontal/vertical forest expansion, and extensive wildlife habitat, highlight the importance of the original northern forests of Iran (also addressed in historical literature as the Hyrcanian forests - [50], [2]). The existence of different land-uses, and their increasing alteration, mainly by local communities, mismanagement of natural resources over long periods of time, intensive and irregular tourism and shortage of human/financial resources for sustainable monitoring and management of the forest resources are threatening the existence of the Caspian forests. More recently, plans for industrial development (e.g., establishment of industrial towns adjacent to the forested areas), public road construction without detailed environmental considerations, etc. have been added to the long list of activities threatening the environment of the Caspian forests.
Fig. 1 - Geographic location of the Hyrcanian forest, represented as a narrow green band around the southern coast of the Caspian Sea.
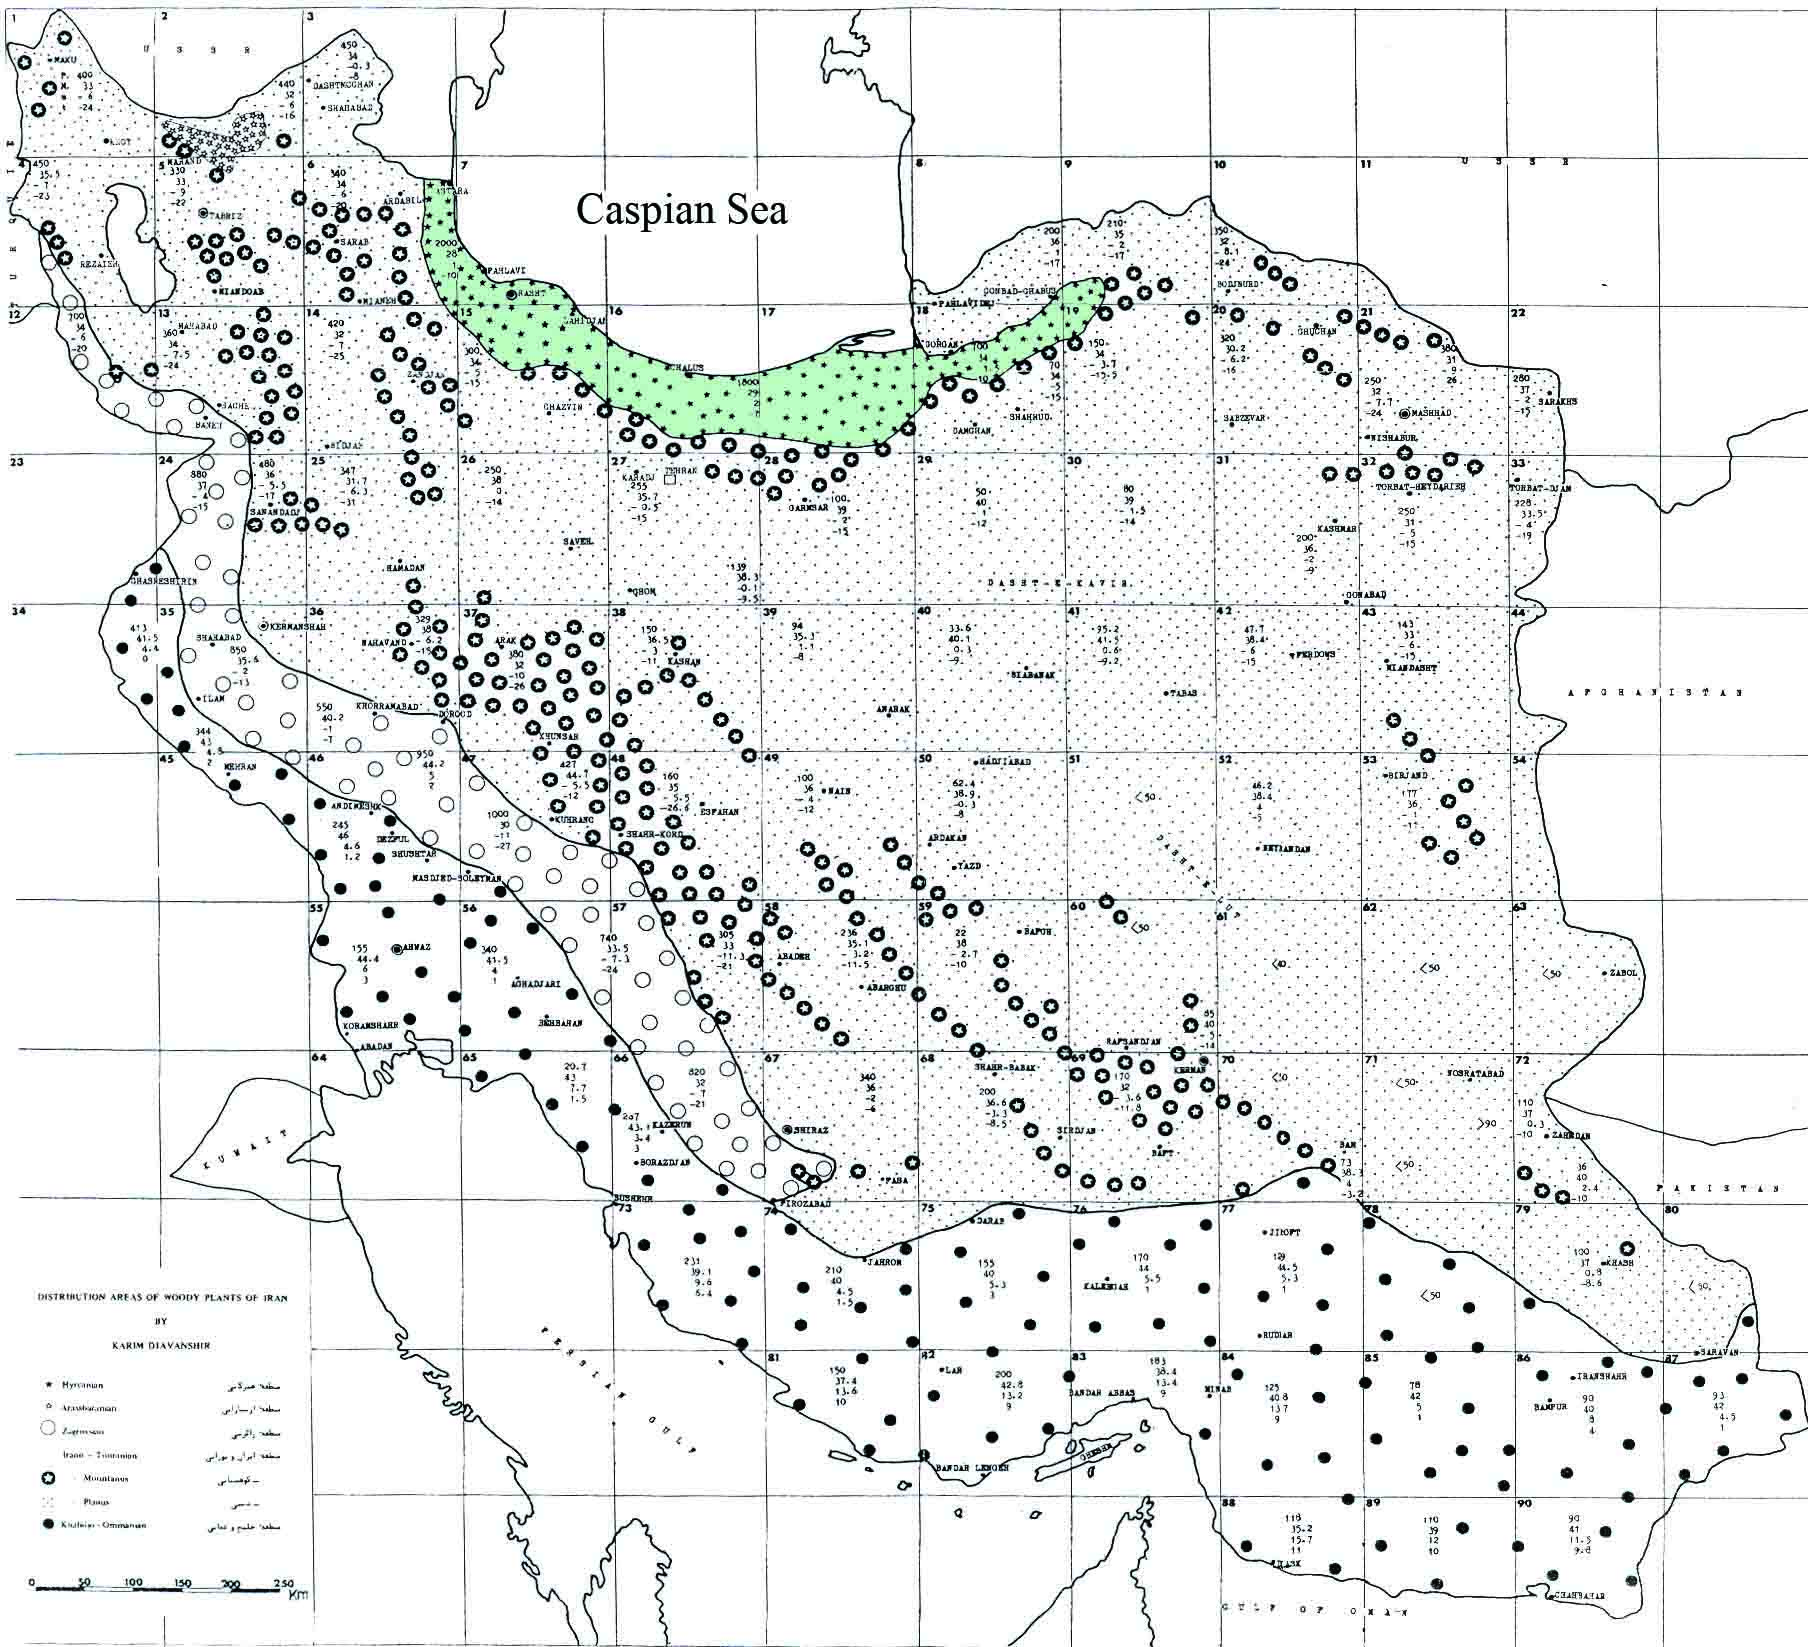
As a matter of fact, different statistics have been presented as to the area of the Caspian forests.Amongst the reported statistics, the initial 3 600 000 ha surveyed in 1942 ([51]), 3 400 000 ha in a study carried out in 1964 ([38]), and 1 920 000 ha published in 1990 ([43]) can be considered. The area of Hyrcaniyan Forests is 1.2% of the whole country area with 1 648 195 ha ([38]). Accuracy and reliability of the publicized data have been critically discussed. Notwithstanding accuracy, what is obvious and remains a fact is that the forest resources have been under continuous degradation over the last few decades.
National forest management officials have acknowledged this fact and have initiated actions for sustainable management of the Caspian Forests, Different forms of management schemes are planned for implementation, such as documenting and exhibiting the forest disturbance and supervision and management of the remaining natural forest ecosystems in the region. In recent years, the focus of natural resource conservationists, researchers, and managers has shifted to the application of remote sensing imagery and geo-spatial tools for the efficient, precise and continuous documentation of vegetation biophysical attributes, such as canopy density, cover type, and cover change.
The application of satellite image processing, along with other forms of geo-referenced digital tools, for documenting vegetation attributes for environmental resource monitoring in Iran has a long history dating back to the 80’s. Prior to that, B/W aerial photographs, acquired as two major countrywide projects in the mid 50 and 60’s, served as a useful monitoring tool for forest area/ type mapping. A variety of satellite remote sensing functions have been introduced, tested and proposed by environmental analysts, many of which have been pointed out by Iverson et al. ([33]). Forest type mapping, change detection, forest succession monitoring, stand’s structure and physiological parameters and forest productivity assessment can be highlighted as some of the major applications, many of which are not known in Iran yet. Further information on the basic potential applications of satellite imagery in forest assessments can be found in the available literature ([17], [25], [28], [15], [35]).
The aim of this paper is to build up a basic assumption of when and how the spectral, spatial and temporal features of satellite-borne remote sensing have been applied toward sustainable resource monitoring over Caspian forests of Iran. To this end, the available literature will be reviewed, the specific perspectives of the studies will be briefly discussed, and future prospects toward the delineation of Caspian forest’s structural and functional characteristics by remote sensing will be outlined.
The applications of satellite image processing in Caspian forests of Iran: a review
Forest monitoring mainly focuses on detecting and estimating the land conversion rate and more recently, on assessing carbon stocks in the forest ecosystems ([19]). In fact, the spatial and spectral features of the images acquired by different sensors nowadays advocate several advantages to natural resource managers and academic researchers in order to classify, monitor, and manage natural ecosystems. As briefly outlined above, the specific natural characteristics (i.e., occurrence of various temperate forest cover types, canopy densities, and physiographic-induced microclimates) and human induced features (e.g., the destructive effects of local/regional development plans, extensive land use conversion, population overgrowth and its associated socio economic problems) of the northern Iranian forest sites, together with the obvious lack of financial/human resources for efficient land monitoring in the last decades, gradually induced official and private environmental analysts to effectively make use of up-to-date and repetitive remotely sensed data in a number of forest management practices. Nevertheless, existing literature shows that the applications have been mainly focused on a set of definite image analysis methods. They can be generally categorized as:
- mapping forest attributes using image classification;
- land use/forest change detection;
- delineation of structural forest attributes by image analysis.
Thus, the recorded literature will be reviewed as follows.
Mapping forest attributes using image classification
Forest area assessment
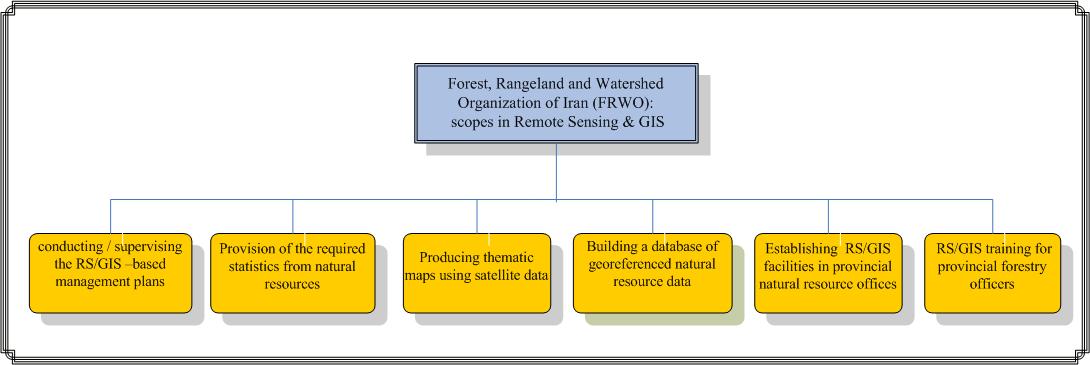
Satellite image classification has always been one of the most regular applications of remotely sensed data. In image classification, pixels are classified according to their ground reflectance values measured by a satellite/air-borne sensor. The desired map is created by displaying the classified pixels in their appropriate geographic context ([33], [35]). The magnitude of image classification for forest mapping has also been pointed out by Beaubien ([13]). In Iran, image classification (in either unsupervised or supervised forms) has historically been one of the widespread and common methods of information extraction from remotely sensed data. One of the main scopes of work of the Iranian Forests, Rangelands and Watershed Organization (hereafter called FRWO) is “…producing various thematic maps using satellite data analysis and GIS” (Fig. 2).
Fig. 2 - The official priorities of RS-based natural resource monitoring in Iran.
In 1984, a joint research project was conducted between the University of Tehran and the Ministry of Agriculture with the objective of investigating Landsat MSS data capability for forest area assessment and change detection in Northern Iran ([3]). The square and linear transect methods were applied to estimate the forested area’s portion from 1:20 000 aerial photographs, which was then used for a final change detection process using image differencing method ([59]). The application of visual/digital image interpretation aided by field-based ancillary information in land use mapping, was later highlighted in another project carried out around Guilan and Mazandaran provinces by the Ministry of Agriculture ([4]). The visual interpretation of remotely sensed data according to previously-defined land use units, aided by ancillary information (e.g., land suitability and forest cover-type maps etc.), aided by digital image processing for generation of land use maps were the main steps of the project.
Eighteen years later, Partovi & Talouri ([46]), assessed the Density Slicing carried out on NDVI data as “the most appropriate method of land use stratification” in a survey conducted on a provincial scale in Guilan (western Caspian Range - [46]). In the study, the vegetation was classified into 6 classes including dense forests, semi-dense and degraded forests, cultivated lands, bare lands, surface water and urban areas, in which the most areas are covered by semi-dense forest, bare lands, and urban areas, in sequence.
Ramtin nia ([49]) conducted an experiment in Nowshahr, Mazandaran, for classification of forest cover type. The image classification was done using threefold supervised classification including Maximum Likelihood (ML), Minimum Distance to Mean (MD), and Parallelepiped (PPD) and Density Slicing schemes, in which the best image channels to be applied were a three-band combination for supervised classification (TM 5.4.3, TM4 and TM7 and TM3 for forest cover extraction by density slicing). The classified data was cross-validated to the ground reference and resulted in the best accuracy results for PPD scheme (96%). The author thus evaluated the appropriate TM data potentiality for forest area mapping in the mountainous study site in Northern Iran. The results confirmed those obtained by Shataee ([56]) who had earlier reported the TM data potential for forest mapping in a portion of plateau forests in western Mazandaran.
As an experiment in the central part of the Caspian forest range, Hosseini et al. ([31]) evaluated Landsat ETM+ data for land use mapping in forested areas of Chamestan-Mazandran. Unsupervised (clustering) and supervised (ML, MD, PPD) classifications methods along with hierarchical hybrid method were applied to the data. The results showed that image contrast enhancement; linear PCA and Tasseled cap transformations have effective roles in land use stratification. The best accuracy result for supervised classification was achieved by ML classifier, with the overall accuracy and Kappa coefficient of 85.83% and 62.81% respectively. However, hierarchical classification ([36], [49] achieved better results (94% and 84.89% respectively).
Mirakhorlo ([39]) defined the study of land use mapping over northern forests of Iran as “to increase the accuracy of information for multidisciplinary decision making various environmental factors”. He used Landsat ETM+ data for the survey. On account of the fact that ETM+ 3 and 4 bands are useful for vegetation stratification, the ETM+ (3, 4, 5) band combination was considered for the unsupervised classification. In field observations, 450 forest sites including 3860 field samples were recorded. After an extensive data processing, a forest land use/land cover map featuring 6 classes was prepared. The accuracy of the six fold land use classification was assessed to be 83%, 78%, 54%, 46%, 79%, and 98%, respectively.
Due to the importance of the sparse temperate forest patches located in the southern temperate forest boundaries in northern Iran, a classification-based study was carried out by FRWO in Shahroud-Semnan province ([5]). The supervised classification was followed by ground controls to document the final land use map of the area. This method (image classification aided by extensive ground controls) was later carried out again by FRWO in its further RS-based forest monitoring projects ([6], [7], [8], [9], [10]). Unfortunately, no comprehensive reports containing precise quantitative results have been published as the output of the above projects. They also applied the use of aerial ortho-photographs in land use mapping of coastal areas of northern Iran ([6]), quantitative/qualitative forest assessment using a set of medium resolution imagery including ETM+, SPOT5, and IRS-1C ([9]) and 1:250 000 vegetation mapping of the entire country using Landsat5 data ([10]).
In 1994 and 1995, the northern forests of Iran were captured by the B/W aerial photographs. The yielded forest maps were published in 2001, to 1:25 000 scales. The northwestern parts (including Astara, in western Guilan) were not photographed due to Iran-Azerbaijan international border security issues, and are therefore not included in the maps. To cover the missing area, a study was defined using satellite-derived images (the data such as IRS-1C Pan associated with 5.8 m of spatial resolution) for producing a 1:25 000 scale forest map for such areas ([36]). The ground reference data was prepared for over 10% of the total study area across the forest and non-forest borderline image classification using Density Slicing, ML, and digital/optical hybrid methods. Based on the results achieved in the study, the highest overall accuracy and Kappa coefficient achieved by the hybrid classification, were 76.8% and 52%, respectively. The author pointed out the similarity in the spectral signatures of low-density forest with non-forest vegetation (e.g., range lands and orchards) as the major source of classification errors which can reduce accuracy (particularly in statistical classification methods such as ML). He proposed the integration of other user-defined parameters in classification processes to attain better accuracy results.
Najjarlou & Shataee ([44]) studied a portion of IRS-LISSIII multi-spectral data (with a spatial resolution of 23.5 m) and “pan” acquired from western Golestan province (eastern part of the Caspian forest zone), aiming to provide an accurate forest area map across the region. Supervised classification was carried out using ML algorithm. A 100%-intensity ground reference layer was developed with the interpretation of digital ortho-photomosaic of the area. An accuracy assessment revealed an overall accuracy of 91% (the cloud cover class was masked). The author thus stated that “since aerial photography of forested areas in Iran is accomplished with large time intervals, the spectrally/spatially fused IRS data can be applied for forest area mapping and monitoring in northern forests of Iran”.
The application of multi-date satellite imagery in forest classification has been discussed by Ghazanfari ([24]) as “the phenological difference between different forest types can be used as a discriminative means for forest classification”. A study conducted one decade later by Poorshakouri ([48]) to separate the northern borderline of Caspian forests in eastern Guilan, using SPOT-HRG and ASTER data. The forest/orchard classification was done using mono-temporal and multi-temporal images applying hierarchical and digital/optical image interpretation techniques. Ground reference data was prepared by GPS survey across the forest and non-forest border. The hierarchical image interpretation achieved the best results for overall accuracy and Kappa coefficient, with 83.3% and 71%, respectively. As stated by Pourshakoori, the establishment of small conifer stands, deciduous orchards, cultivated fields, and the shadows created by different shading situations, form the major sources of classification errors, though some problems were solved by applying hierarchical and digital/ optical image analysis. The results showed that forest and non-forest borderline can be accurately separated using multi-temporal remotely sensed data.
Forest cover type/canopy density mapping
Preparing forest cover type maps using spectral/spatial features of remotely sensed data is considered a prerequisite for investigating biodiversity changes in forested areas, and the application of digital remotely sensed imagery for the purpose has exhibited great potential in recent decades. A variety of empirical approaches have been used to discriminate and map forest cover types using digital remote sensing imagery on different local and regional scales worldwide.
In the 80’s, which can be referred to as the early days of satellite remote sensing analysis in Iran, Oladi ([45]) made an attempt to stratify some land cover types of forested areas based on Landsat MSS spectral pixel values. In the survey, the land cover classes including dense forests, high-altitude forest and rangelands, medium-altitude forest and rangelands, rock outcrops featuring low rangeland/scrubland cover, plateaus, and poor-vegetated areas, were separated based on spectral DN’s, field surveys and user preferences.
Study of the dispersal and composition of plant communities in environmentally-protected areas (e.g., national parks), for the purpose of producing vegetation maps, can be considered as a tool for other scientific studies in the realm of appropriate planning for the utilization, conservation, and rehabilitation of natural ecosystems. With this objective, Shirian ([58]) tested TM data for the vegetation mapping of Golestan National Park in the eastern part of the Caspian ecosystem. The image was classified using the unsupervised scheme, along with slope, aspect, and elevation maps, to sample the study site. Cover type dominance was modelled in GIS to assess the accuracy of the separated cover types. Artemisia spp. was found to be the area’s dominant species; in addition, the probability of the species’ occurrence across the area was calculated. The results showed a high correlation between the probability of occurrence, site suitability and classified image for the extracted cover types. The study states that developing these models for vegetation mapping requires lesser fieldwork. TM image analysis was also assessed as suitable for classification of forest type and for mapping major forest cover type across an area.
In an early attempt for forest type classification using remotely sensed data in Iran, Ghazanfari ([24]) applied Landsat TM data for forest type stratification in the Eastern Caspian range in Mazandaran Province. To this end, the unsupervised classification applied to the image resulted in 15 spectral classes attributed to 4 major cover types. The author concluded that the correlation between NDVI spectral values and different forest attributes (e.g., canopy density and volume per ha) can be investigated for regression assessment, among the factors. This provides the potential for evaluating the forest density/volume, by the analysing vegetation indices (e.g., NDVI - [24]) However, Ramtin nia ([49]) acknowledged that Landsat TM data were insufficient for forest type mapping within his study area in western Mazandaran, due to the low separability of the cover type classes as judged by the spectral separability measures (i.e., Bhattacharya distance).
An evolution of forest type mapping using medium-resolution Landsat data in northern country was presented by Abbasi ([1]), who evaluated ETM+ data to identify the Fagus orientalis plant community as one of the most valuable forest communities in northern Iran in terms of biological and economic value; in a mountainous area of an experimental forest located in the Central Caspian Range (Nowshahr - [1]). To test the accuracy of classified data, ground truth was prepared using a transect sampling OF almost 42% of the site area (approx. 338.6 ha). The Fagus orientalis types were recognized by qualitative canopy cover assessment of the over-story. Various hard classifiers (ML, PPD, and MD) were implemented on the dataset. Accuracy assessment showed that the maximum overall accuracy and Kappa coefficient was achieved applying ML classifier on ETM+(7), Tasseled Cap brightness, ETM+(4)/ETM(3+2), Tasseled Cap greenness, PC1 (from ETM1-5 and 7 bands) as the dataset. The final results conveyed that non-Fagus type vegetation was generally better classified. Thus, ETM+ data was judged to be spectrally and spatially inappropriate for Fagus orientalis mapping in northern Iran. The view supported the conclusions of earlier studies, as mentioned above, in terms of forest type classification in the region.
In one of the most comprehensive studies for forest type mapping in northern Iran, Shataee ([57]) applied Landsat ETM+ data in a comparative pixel/object based framework for forest type stratification. The ground truth information was prepared by a field survey using one-ha field plots in which the diameter at breast height (DBH) of all the trees in the field plot was recorded, along with their physiographical attributes. Based on the measurements, two different forest type maps featuring 7 cover types were prepared and applied as the ground truth. The classification was done using pixel and object based methods, integrating the ancillary spatial data along with the spectral data. The results of analysis showed that the separability rate amongst pure/mixed Fagus orientalis-Carpinus betulus is low. Therefore, the final classification was carried out using 5 major merged classes. Based upon the results, the best overall accuracy and Kappa coefficient reached 55.63% and 31.45%, respectively. As the physiographic attributes (i.e., altitude and aspect) are effective in the spatial distribution of some cover types, they were used as the non-spectral ancillary data for the classification process. The results showed that while utilizing the altitude’s prior probability can individually cause for an increase in overall accuracy, applying the aspects prior probability did not improve the overall accuracy. However, the combined altitude/aspect’s prior probabilities improved the overall accuracy and Kappa coefficient up to 60.87% and 41.22%, respectively. In addition, object based classification, using k-nn, fuzzy membership functions and a combination of both methods, was conducted on the data. The results indicated that integration of the nearest neighbor with fuzzy membership functions can improve the results more than both techniques individually, with accuracy results of 60.77% and 44.4%, in sequence ([57]). Hence, it was concluded that object based method outperformed the pixel based method in terms of forest type classification without ancillary data ([54], [56]). The superiority of object-oriented image processing over the conventional pixel-based methods has been discussed by Farzaneh ([21]) in a recently completed research project in Mazandaran.
In consideration of the existing variations in vegetation communities in different geographical areas of the Caspian forests, an attempt in forest type/density mapping in the Eastern part of the Caspian ecosystems in Golestan province by Shahbabaei ([53]) investigated the capability of ETM+ data for forest type and density mapping in an experimental forest ([53]).The ground reference data was prepared using systematic randomized sampling, measuring DBH and average canopy percentage inside the field plots. The data was classified using ML, MD, and PPD algorithms, amongst them ML classifier achieved the best results with 75% and 66% of overall accuracy and Kappa coefficient for forest type mapping; and 64% and 54% of the measures for forest density mapping. In addition, the results obtained from separability measures showed that Fagus orientalis-Carpinus betulus and mixed Fagus orientalis cover type classes could not be distinguished accurately, which supports the results obtained earlier by Shataee ([57]). Nevertheless, the author’s conclusions in terms of forest density mapping was strongly in contrast with the results of Mirakhorlo ([40]), who reported the average overall accuracy of 85.43% following a ML classification of forest density (featuring 4 density classes) using ETM+ data in the western part of the Caspian Range. The divergence can mainly be attributed to the difference between the criteria used to define the forest density classes (one yielded as the precise average of total basal area measurement, and the other based on qualitative canopy measurement).
Among the multitude of forest density mapping of the Caspian forests, a study based on fourfold biophysical indices conducted by Moeinazad ([42]) can also be pointed out. He applied a model (namely FCD) based on the spectral indices including Vegetation Index (VI), Shadow Index (SI), Thermal Index (TI), and Bare soil Index (BI) in a process toward generation of a forest density map ([43]). The model-induced map was then cross-validated with the ground reference prepared by the visual interpretation of aerial photos. The maximum overall accuracy and Kappa coefficient were achieved using the 5-class FCD map (61% and 0.38% respectively). The study points out that the model is capable of high density classification, while it is unsuitable for the low-density classes in northern Iran.
Forest canopy density is a major factor in evaluation of forest status and is an important indicator of possible management interventions. Forest canopy cover, also known as canopy coverage or crown cover, is defined as the proportion of the forest floor covered by the vertical projection of the tree crowns. Estimation of forest canopy cover has recently become an important part of forest inventories. Using satellite imagery to estimate crown coverage has a long history. Conventional remote sensing methods assess the forest status based on qualitative data analysis derived from “training areas”. This has certain disadvantages in terms of time and cost requirements for training area establishment. Forest Canopy Density Model is one of the useful methods to detect and estimate the canopy density over large area in a time and cost effective manner. This model is based on four indices, i.e., soil, shadow, thermal and vegetation. This model requires very less ground truths, just for accuracy check. In this study have tested the FCD model by using IRS image in an old growth forest of north forest division of Iran. The overall accuracy for IRS image was 84.4% and Kappa coefficient was 78.3% ([11]).
As is evident from the literature review, studies have almost uninanimously emphasized on the intermediate/ poor capabilities of commercial medium resolution data (particularly Landsat-derived data) for forest type mapping in low and moderate altitudes of northern forests of Iran. According to Franklin ([22]), the vegetative forms (i.e., trees, shrubs, etc.) can be used as a criterion for vegetation (especially forest) stratification using remotely sensed data.
Land use/forest change detection
Digital change detection essentially comprises quantification of temporal phenomena from multi-date imagery that is most commonly acquired from satellite-based multi-spectral sensors ([17]). So far, satellite remote sensing has been widely used to detect forest change and update existing forest maps. According to Desclee et al. ([19]), many change detection techniques have been developed since the early days of earth observation, broadly grouped into three categories: (1) visual interpretation, (2) pixel-based and (3) object-based methods. Iranian environmental analysts appear to be unfamiliar with all the available change detection methods and have remained confined to a selected few. For example, few attempts have been made so far to analyse forest cover change based on remotely sensed data in northern Iran. The focus is mainly on a method of pixel-based change detection (Post-Classification method).
In the mid 80’s, the Ministry of Agriculture and University of Tehran initiated forest change detection studies in the Caspian forests, by focusing on the comparison of Landsat MSS data to B/W aerial photos for calculation of the changed areas during the 11-year interval. Their studies showed that 438 ha of the original 27 541 ha in Guilan province had been deforested. According to Hosseini Razi ([30]), “ìn view of the growing rate of forest degradation, especially during recent decades, the use of satellite image and aerial photography is an important tool for obtaining accurate statistics and information regarding the actual status of Iran’s forest resources for making the right decisions for planning purposes”. The FRWO has implemented several management projects to detect multi-temporal forest changes in eastern Caspian range (Golestan province), and the coastal strip of the entire Caspian region; however, no comprehensive quantitative results have been published ([7], [8])
In a study conducted later in eastern Guilan, the correlation between the rate of deforestation and topographic factors including slope, aspect, elevation, and human induced factors (i.e., distance from villages or public roads) Pir Bavaghar ([47]), demonstrated that a converse relationship exists between deforestation and slope, distance from villages, and public roads.
Amongst other studies, Haghighi ([26]) applied a post-classification method to estimate the forest area changes in Guilan. The overall accuracies of the Maximum Likelihood classification on 1991 and 2000 TM/ETM+ images were 68% and 62%, respectively. In addition, the rate of deforestation across the area was estimated at 1 441 ha during a 9-year period.
According to Hosseinpour et al. ([32]), “using multi-temporal satellite imagery, the forest degradation trend can be effectively investigated”. Moreover, the resource changes can be modelled and simulated using GIS for proposing appropriate solutions toward controlling the destructive factors”. To this end, the author classified the multi-temporal Landsat data, simulated the land use change, and explored forest degradation sources following extensive field visits in eastern Mazandaran. The author concluded that forest degradation sources across the area include illegal logging, fuel wood extraction by the locals, extension of the cultivating lands, occurrence of several floods within the river bodies, and irregular nature based tourism in summer.
In another study, Rafiian et al. (2006) applied two Landsat TM and ETM+ scenes belonging to 1994 and 2001, respectively. Maximum Likelihood classification aided by visual image interpretation scheme was carried out on both images, resulting in a final change map with 96% overall accuracy and 0.92% Kappa coefficient. They recommended this method for forest area change detection, across a broad range of the northern forests of Iran.
In a change detection experiment of the timberline fields of Caspian forests, Mirakhorlo ([41]) detected forest-rangeland boundary changes over a 15-year time span, by identifying land use types in Landsat images. The information derived from the final change maps showed that 121 528 ha of mountainous lands has been deforested during the period, with average annual deforestation rate of 8 101 ha.
Adding up the deforested areas in the three above-mentioned studies showed that 0.22%, 0.47% and 0.67% of the total northern forest lands have been degraded at the timberline level annually, of which the maximum rate of degradation was observed in Golestan province, and the minimum in Guilan province.
Delineation of structural forest attributes using image analysis
Satellite data have been widely used with varying degrees of success to quantify spatially forest structure characteristics such as crown cover, tree density, tree diameter, basal area, tree height, tree age, biomass, and Leaf Area Index (LAI). In general, the technique involves collecting spatially-referenced ground data on the forest structure variable of interest and then to determining the statistical relationship between the ground-obtained data and the spectral data for the same location ([33]).
Hosseini ([29]) has proposed the use of satellite data and aerial photography to investigate harvest-related forestry practices. As a case study, he tested the capability of TM data to detect harvesting areas, including cutting areas, forest roads and skid trails, aided by TM individual bands and false colour composites in western Guilan. The results showed that using a correlation between the harvest area existing on digitized aerial photos and topographic maps, the mentioned areas can be determined accurately on the images. The results also showed that discriminating harvested areas using visual interpretation can be better accomplished on visible TM bands than its infrared bands. However, the gaps resulting from shelter wood cuts, which are one of the main methods of forest harvesting in Iran, featuring area of 1-2 ha was not recognizable using available TM bands.
On account of their vital role in terms of both area coverage and mix, the possibility of separating different mixtures of Fagus orientalis and Carpinus betulus stands, based on their spectral reflections was studied by Bakhshandeh & Oladi ([12]) using Landsat ETM+ digital imagery. Ground sample plots were selected using a cluster sampling in four mixture levels of the species (based on the species percentage and the DNs were extracted from the image. Statistical analysis of this study showed the superiority of ETM+ band in separating different mixtures of all the fourfold groups. ETM+ band 5 was found to be capable of separating pure stands of Fagus orientalis and all of the two species mixtures, except the one comprising 80% Fagus orientalis, 20% Carpinus betulus. Nevertheless, other mixtures seemed to be inseparable from each other. The results of this study were relatively satisfying, in terms of the ability of ETM+ imagery to separate mixtures of Fagus orientalis and Carpinus betulus in northern Iran.
In order to investigate ETM+ data for tree volume assessment in Fagus orientalis stands, a study was carried out in south-eastern Mazandaran ([34]). The ground survey was conducted using selectively-sampled plots from pure Fagus orientalis stands, located on the northern slopes, which are its original habitat using an average volume of 68-80 m3 ha-1. The standing volume was calculated using local tariff figures. Using a ground reference map, the corresponding DNs were extracted from the image. The extracted DN and the standing volume were used to develop a regression in which the data extracted from ETM+ (4) and Pan-fused ETM+ (4) represented the highest correlation with the standing volume. The multivariate linear regression using ETM+ 7, 2, 4, and 5 bands, Tasseled Cap greenness, ETM+ (3)/ETM+ (4) ratio and Pan-fused ETM+ (4) showed that the two latter channels are the most appropriate spectral data for standing volume assessment, using the implemented method. Thus, the PCA of the bands was entered in the analysis. The author, however, subsequently acknowledged that “complementary studies (e.g., using either ETM+ or other satellite-borne data) can be proposed for the other mixed/pure forest site to develop such regressions”.
Discussion
The spatial and spectral features of images acquired by different sensors nowadays, advocate several advantages to natural resource managers and academic researchers for the classification, monitoring, and management of natural ecosystems. Countries with large land areas require cost effective monitoring of their inland ecosystems for sustainable management of natural resources ([23]).
Some of the basic requirements for a successful remote sensing-aided natural resource monitoring may be listed briefly as follows:
- availability of required digital data sources (i.e., imagery, maps, and any other forms of data);
- collecting up-to-date and precise information exhibiting the field’s actual baseline;
- applying the image processing methodology, with respect to the specific characteristics of the study area;
- producing accurate and useful outputs (e.g., maps and statistics).
The majority of studies carried out so far on northern Iranian forest sites have faced severe constraints in terms of purchasing the required digital data. As is evident, most of the studies mentioned above have used Landsat-derived (MSS, TM, and ETM+) image data for the studies, which are in many cases not appropriate for the pre-defined study goals, such as extracting forest cover type maps in mixed temperate forests using pixel-based hard classifiers, and deriving forest/non forest land use maps over the areas associated with heterogeneous land cover boundaries. As a result, the accuracy and therefore the reliability of the maps produced with pixel-based or statistical signal processing techniques in such areas can be sometimes violated, as the heterogeneity of different land cover types (which occur either within the cover types or between cover type borders) increases. Moreover, the large rate of background reflectance in the areas such as forest/rangeland timberlines (reflected by non-vegetative objects like soil, rock outcrops, or atmospheric effects) sometimes can prevent the image analyst from fully exploiting the image spectral capabilities in order to discriminate between cover types (defined by the user as different forest types, density classes, or forest/non-forest land use classes) and produce operationally representative maps.
For change detection studies, Coppin & Bauer ([16]) state that anniversary dates or anniversary windows (annual cycles or multiples thereof) are often used because they minimize discrepancies in reflectance caused by seasonal vegetation fluxes and sun angle differences. Hame ([27]) concluded that for change detection, summer and winter are the best seasons because of their phonology stability. The afore-mentioned change detection surveys have mostly conformed this view.
In terms of ground reference data collection, the accepted perspective is that “the more comprehensive the ground data collection is, the more correct will be the accuracy assessment process”. However, the shortage of analogue/digital reference data sources in Iran has been a limitation for the accomplished studies. The 1:50 000 tally sheets (produced by the Iranian National Geographic Organization), the 1:25 000 scale topographic maps (distributed by the National Cartographic Centre), and the B/W aerial photographs acquired in the mid 50’s, 60’s and 90’s all across the country are the main available data sources which could be utilized for generating the ground-based information needed for the analysis. Apart from these, the authors have mainly been limited to conducting statistical sampling surveys of the study areas in order to collect the required information on the actual land’s condition, for which using at least a 2% intensity ground reference sampling has been proposed ([20]). The lack of a geo-referenced natural resource data bank for the country, which FRWO aims to build up in the upcoming years, is a serious limitation in change detection studies, where the ground reference information of multi-date time spans are often necessary for the analyst.
The application of various image analysis methods based on spectral features of pixels (known as pixel-based methods) has been tested, suggested, and applied by many environmental analysts and natural resource managers for decades. Nevertheless, pixel based methods have shown to be sometimes inappropriate tools for correctly extracting forest cover attributes from remotely sensed data, mainly due to the above-mentioned site heterogeneity. On the contrary, object oriented image analysis, which has been used in recent years, has proved to be an excellent method for image processing and extracting information in various forest environments. Some of the advantages of implementing object based image processing techniques, pointed out by various studies are excellent capabilities for automatic/semi-automatic image segmentation, compatibility with knowledge-based information applied by the analyst, potential integration with fuzzy logic in class allocation, and potential for high accuracy output map production ([14]). In Iran, Shataee et al. ([55]) and Farzaneh ([21]) have recently advocated the application of object-based image analysis for forest cover monitoring. In addition, the integration of optical/radar remote sensing data in some operational practices (e.g., forest disturbance/fire mapping) can be rewarding, provided that the needed data sources, i.e., satellite-borne data, fine-scale informative maps, and required software/hardware facilities are available.
The future prospects
The application of satellite imagery for effective management of the northern Forests of Iran, has exhibited promise throughout its application; from applying visual image interpretation in the early 80’s, to the application of biophysical density modelling and object-oriented image analysis in the recent decade. The efficient use the satellite image processing techniques, together with extensive forestry expert knowledge for generating a potential remote sensing-aided framework for forest assessment of the northern forests, which have long been an essential source of environmental values across the region, appears to be of even more significance today.
Owing to the extensive degradation of natural resources, caused by population over-growth, extensive land use conversion, and irregular urbanism, which is destroying the unique northern forest ecosystems rapidly, it is expected that different sections involved in environmental management in Iran will increasingly advocate application of short-term remote sensing analysis (e.g., the data associated with regional spatial scale) for effective resource monitoring across the region.
As most of the reviewed studies proposed, the need for getting access to a diverse range of remote sensing data is a necessary step to be taken in the future. To this end, a range of fine-scale satellite data (e.g., high resolution satellite imagery) featuring high spatial, spectral, and temporal capabilities can be collected for the national data archives, ready to be used for the research purpose. The completion of the national geo-referenced database for the natural resources of Iran (as stated by FRWO) will be an effective tool for the national natural resource management body for proper natural resource monitoring. This can be more satisfying if the official management makes available the data and statistics for educational/ research projects, to both research institutes and academic sections, which have long suffered shortage of financial resources needed for such projects.
As the theoretical and applied knowledge of remote sensing improves amongst Iranian analysts, new image analysing methods and study subjects are anticipated to be applied in the future, among which the application of object-based image processing techniques, change detection algorithms apart from post classification routines (e.g., change vector analysis, multi-temporal linear transformations, image ratio-ing, etc.), the study of forest succession, assessment of stand’s physiological parameters (e.g., photosynthesis, evapo-transpiration, and leaf area index), and the integration of optical/radar data may be highlighted.
References
Gscholar
Gscholar
Gscholar
Gscholar
Gscholar
Gscholar
Gscholar
Gscholar
Gscholar
Gscholar
Gscholar
Gscholar
Gscholar
Gscholar
Gscholar
Gscholar
Gscholar
Gscholar
Gscholar
Gscholar
Gscholar
Gscholar
Gscholar
Gscholar
Gscholar
Gscholar
Gscholar
Gscholar
Gscholar
Gscholar
Gscholar
Gscholar
Gscholar
Gscholar
Gscholar
Gscholar
Gscholar
Gscholar
Gscholar
Gscholar
Gscholar
Gscholar
Gscholar
Gscholar
Gscholar
Gscholar
Authors’ Info
Authors’ Affiliation
Department of Forestry and Forest Economy, University of Tehran, Karaj, Iran
Department of Environmental Science, University of Tehran, Karaj, Iran
Corresponding author
Paper Info
Citation
Poorzady M, Bakhtiari F (2009). Spatial and temporal changes of Hyrcanian forest in Iran. iForest 2: 198-206. - doi: 10.3832/ifor0515-002
Academic Editor
Agostino Ferrara
Paper history
Received: Apr 19, 2009
Accepted: Aug 24, 2009
First online: Oct 15, 2009
Publication Date: Oct 15, 2009
Publication Time: 1.73 months
Copyright Information
© SISEF - The Italian Society of Silviculture and Forest Ecology 2009
Open Access
This article is distributed under the terms of the Creative Commons Attribution-Non Commercial 4.0 International (https://creativecommons.org/licenses/by-nc/4.0/), which permits unrestricted use, distribution, and reproduction in any medium, provided you give appropriate credit to the original author(s) and the source, provide a link to the Creative Commons license, and indicate if changes were made.

Web Metrics
Breakdown by View Type
Article Usage
Total Article Views: 64808
(from publication date up to now)
Breakdown by View Type
HTML Page Views: 52136
Abstract Page Views: 4718
PDF Downloads: 6702
Citation/Reference Downloads: 29
XML Downloads: 1223
Web Metrics
Days since publication: 6125
Overall contacts: 64808
Avg. contacts per week: 74.07
Article Citations
Article citations are based on data periodically collected from the Clarivate Web of Science web site
(last update: Mar 2025)
Total number of cites (since 2009): 24
Average cites per year: 1.41
Publication Metrics
by Dimensions ©
Articles citing this article
List of the papers citing this article based on CrossRef Cited-by.
Related Contents
iForest Similar Articles
Review Papers
Remote sensing support for post fire forest management
vol. 1, pp. 6-12 (online: 28 February 2008)
Review Papers
Remote sensing of selective logging in tropical forests: current state and future directions
vol. 13, pp. 286-300 (online: 10 July 2020)
Review Papers
Accuracy of determining specific parameters of the urban forest using remote sensing
vol. 12, pp. 498-510 (online: 02 December 2019)
Research Articles
Afforestation monitoring through automatic analysis of 36-years Landsat Best Available Composites
vol. 15, pp. 220-228 (online: 12 July 2022)
Review Papers
Remote sensing-supported vegetation parameters for regional climate models: a brief review
vol. 3, pp. 98-101 (online: 15 July 2010)
Research Articles
Assessing the influence of different Synthetic Aperture Radar parameters and Digital Elevation Model layers combined with optical data on the identification of argan forest in Essaouira region, Morocco
vol. 17, pp. 100-108 (online: 24 April 2024)
Research Articles
Long-term effects of single-tree selection cutting management on coarse woody debris in natural mixed beech stands in the Caspian forest (Iran)
vol. 10, pp. 652-658 (online: 20 June 2017)
Research Articles
Mapping the vegetation and spatial dynamics of Sinharaja tropical rain forest incorporating NASA’s GEDI spaceborne LiDAR data and multispectral satellite images
vol. 18, pp. 45-53 (online: 01 April 2025)
Review Papers
Biodiversity assessment in forests - from genetic diversity to landscape diversity
vol. 2, pp. 1-3 (online: 21 January 2009)
Technical Reports
Detecting tree water deficit by very low altitude remote sensing
vol. 10, pp. 215-219 (online: 11 February 2017)
iForest Database Search
Search By Author
Search By Keyword
Google Scholar Search
Citing Articles
Search By Author
Search By Keywords
PubMed Search
Search By Author
Search By Keyword


